


Key Insights
The smart fabrics market is poised for significant expansion, with an anticipated market size of 39.51 billion by 2025. This robust growth trajectory is underpinned by a projected Compound Annual Growth Rate (CAGR) of 28.4%. Key growth drivers include escalating demand across fashion and entertainment, sports and fitness, and critical medical applications. Technological advancements are enhancing fabric functionalities, offering superior comfort, breathability, and seamless integration with wearable technology. The adoption of smart textiles in athletic apparel for performance enhancement and injury prevention is a notable contributor, alongside expanding healthcare applications for patient monitoring and therapeutic interventions.

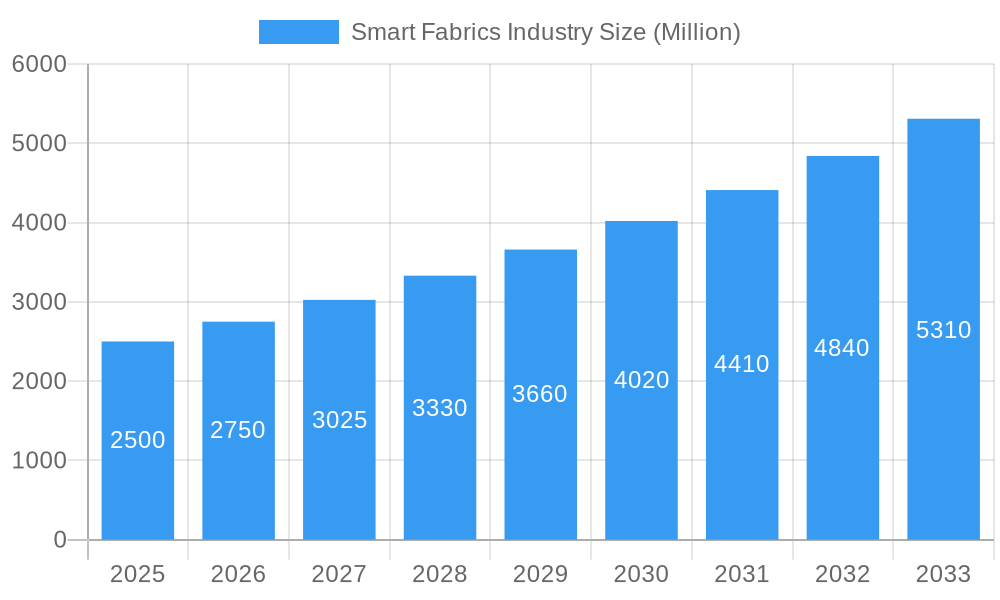
Smart Fabrics Industry Market Size (In Billion)

While production costs and data security concerns present challenges, continuous innovation and industry collaboration are actively addressing these issues. Active and ultra-smart fabric segments are anticipated to lead growth due to demand for advanced functionalities. Geographically, North America and Europe exhibit strong market presence, with Asia Pacific projected for substantial future growth driven by rising disposable incomes and technological adoption.
Smart Fabrics Industry Company Market Share
The competitive environment features established brands and innovative startups. Companies like Adidas and Nike are integrating smart fabrics into their offerings, while specialists such as Sensoria and Ohmatex are pioneering advanced materials and technologies. The market is expected to experience further consolidation and strategic alliances to broaden product portfolios and market reach. Future expansion will hinge on ongoing advancements in material science, sensor miniaturization, and navigating data privacy and safety regulations. The diverse potential applications, from self-cleaning textiles and embedded power generation to advanced medical diagnostics and military uses, signal considerable opportunities for market diversification and sustained growth.
Smart Fabrics Industry Market Report: 2019-2033
This comprehensive report provides an in-depth analysis of the Smart Fabrics market, encompassing market dynamics, growth trends, regional insights, product landscape, key players, and future outlook. The study period covers 2019-2033, with 2025 as the base and estimated year. The report segments the market by type (Passive Smart Fabrics, Active Fabrics, Ultra-smart Fabrics) and application (Fashion and Entertainment, Sports and Fitness, Medical, Transportation and Others, Space and Military, Industrial), providing granular insights for strategic decision-making. The market size is valued in Million Units.
Smart Fabrics Industry Market Dynamics & Structure
The global smart fabrics market, valued at xx Million Units in 2024, is experiencing significant growth driven by technological advancements and increasing demand across diverse sectors. Market concentration is moderately high, with key players like Adidas AG, NIKE Inc, and Schoeller Textil AG holding substantial market share. However, the emergence of innovative startups is fostering competition.
- Market Concentration: The top 5 players hold an estimated xx% market share in 2025.
- Technological Innovation: Continuous advancements in materials science, sensor technology, and miniaturization are key drivers.
- Regulatory Frameworks: Government initiatives promoting sustainable and technologically advanced textiles are influencing market growth.
- Competitive Product Substitutes: Traditional fabrics remain a significant substitute, but the unique functionalities of smart fabrics are driving adoption.
- End-User Demographics: The market is driven by a growing young population, increased disposable incomes, and a shift toward technologically enhanced lifestyle products.
- M&A Trends: The number of M&A deals in the sector increased by xx% between 2020 and 2024, indicating consolidation and expansion strategies among players. Innovation barriers include the high cost of research and development, integration challenges, and scalability issues.
Smart Fabrics Industry Growth Trends & Insights
The smart fabrics market is projected to exhibit a CAGR of xx% during the forecast period (2025-2033), reaching xx Million Units by 2033. This growth is fueled by rising demand from the sports and fitness, medical, and fashion industries. Adoption rates are increasing steadily, particularly in developed economies, driven by rising consumer awareness and technological advancements. The market is witnessing significant technological disruptions, with the integration of advanced functionalities such as bio-sensing, energy harvesting, and connectivity pushing the boundaries of smart fabric capabilities. Consumer behavior shifts towards personalized and technologically integrated products further bolster market expansion. Market penetration is expected to increase from xx% in 2025 to xx% by 2033.
Dominant Regions, Countries, or Segments in Smart Fabrics Industry
North America and Europe currently dominate the smart fabrics market, driven by strong technological infrastructure, consumer demand, and established industry players. However, the Asia-Pacific region is projected to experience the fastest growth, fueled by increasing manufacturing capabilities and rising disposable incomes.
- Leading Segment by Type: Active smart fabrics hold the largest market share in 2025, driven by applications in sports and fitness.
- Leading Segment by Application: The Sports and Fitness segment is the largest application area in 2025.
- Key Drivers (North America): Strong R&D investments, early adoption of new technologies, and a robust regulatory environment.
- Key Drivers (Europe): High consumer awareness of smart textiles, and government support for sustainable and innovative textile manufacturing.
- Key Drivers (Asia-Pacific): Growing consumer base, cost-effective manufacturing, and increasing investments in the textile industry.
Smart Fabrics Industry Product Landscape
Smart fabrics are constantly evolving, integrating advanced functionalities like embedded sensors for biometrics, embedded LEDs for illumination, and conductive threads for energy transfer. These innovations provide unique selling propositions like improved athletic performance monitoring, enhanced patient care, and improved safety features in various applications. Technological advancements are focused on enhancing comfort, durability, and seamless integration of functionalities.
Key Drivers, Barriers & Challenges in Smart Fabrics Industry
Key Drivers:
- Technological advancements in materials science and sensor technology.
- Growing demand from diverse industries such as healthcare, sports, and fashion.
- Increasing consumer preference for technologically integrated products.
Key Challenges and Restraints:
- High production costs and limited scalability.
- Regulatory hurdles related to safety and data privacy.
- Potential supply chain disruptions and material sourcing challenges.
- Competition from traditional fabrics and emerging substitutes.
Emerging Opportunities in Smart Fabrics Industry
Untapped markets in developing economies, the integration of smart fabrics into new applications such as wearable medical devices and smart home textiles, and personalized solutions based on evolving consumer preferences are key emerging opportunities. The development of sustainable and biodegradable smart fabrics will create new market segments and further expansion.
Growth Accelerators in the Smart Fabrics Industry
Technological breakthroughs in flexible electronics, the development of advanced materials with enhanced functionalities, and the establishment of strategic partnerships between textile manufacturers, technology companies, and end-users are significant growth accelerators. Market expansion strategies focusing on untapped markets and the diversification of applications will further fuel market expansion.
Key Players Shaping the Smart Fabrics Industry Market
- Adidas AG
- NIKE Inc
- ThermoSoft International Corporation
- Ohmatex
- AIQ Smart Clothing Inc
- OTEX Specialty Narrow Fabrics Inc
- Sensoria Inc
- Schoeller Textil AG
- Interactive Wear AG
- Kolon Industries Inc
Notable Milestones in Smart Fabrics Industry Sector
- April 2023: Cambridge University develops cost-effective smart fabric incorporating LEDs, energy harvesting, and sensors.
- March 2023: Schoeller Textil AG launches Re-Source, a sustainable smart textile collection.
- April 2022: AFFOA showcases advanced functional fibers with embedded LED chips at the Smart Textiles Summit.
In-Depth Smart Fabrics Industry Market Outlook
The future of the smart fabrics market is bright, driven by ongoing technological innovations, growing consumer demand, and the emergence of new applications across diverse industries. Strategic partnerships and expansion into untapped markets will be critical to realizing the significant growth potential predicted for the coming decade. The market is poised for continued expansion, driven by increased adoption across various segments and the emergence of novel applications.
Smart Fabrics Industry Segmentation
-
1. Type
- 1.1. Passive Smart Fabrics
- 1.2. Active Fabrics
- 1.3. Ultra-smart Fabrics
-
2. Application
- 2.1. Fashion and Entertainment
- 2.2. Sports and Fitness
- 2.3. Medical
- 2.4. Transportation and Others
- 2.5. Space and Military
- 2.6. Industrial
Smart Fabrics Industry Segmentation By Geography
- 1. North America
- 2. Asia Pacific
- 3. Europe
- 4. Rest of the World

Smart Fabrics Industry Regional Market Share
Geographic Coverage of Smart Fabrics Industry
Smart Fabrics Industry REPORT HIGHLIGHTS
| Aspects | Details |
|---|---|
| Study Period | 2020-2034 |
| Base Year | 2025 |
| Estimated Year | 2026 |
| Forecast Period | 2026-2034 |
| Historical Period | 2020-2025 |
| Growth Rate | CAGR of 28.4% from 2020-2034 |
| Segmentation |
|
Table of Contents
- 1. Introduction
- 1.1. Research Scope
- 1.2. Market Segmentation
- 1.3. Research Methodology
- 1.4. Definitions and Assumptions
- 2. Executive Summary
- 2.1. Introduction
- 3. Market Dynamics
- 3.1. Introduction
- 3.2. Market Drivers
- 3.2.1. Growth in Wearable Electronics Industry; Miniaturization of Electronics and Developments across Flexible Electronics
- 3.3. Market Restrains
- 3.3.1. High Initial Cost
- 3.4. Market Trends
- 3.4.1. Fashion and Entertainment Industry to Witness Significant Growth
- 4. Market Factor Analysis
- 4.1. Porters Five Forces
- 4.2. Supply/Value Chain
- 4.3. PESTEL analysis
- 4.4. Market Entropy
- 4.5. Patent/Trademark Analysis
- 5. Global Smart Fabrics Industry Analysis, Insights and Forecast, 2020-2032
- 5.1. Market Analysis, Insights and Forecast - by Type
- 5.1.1. Passive Smart Fabrics
- 5.1.2. Active Fabrics
- 5.1.3. Ultra-smart Fabrics
- 5.2. Market Analysis, Insights and Forecast - by Application
- 5.2.1. Fashion and Entertainment
- 5.2.2. Sports and Fitness
- 5.2.3. Medical
- 5.2.4. Transportation and Others
- 5.2.5. Space and Military
- 5.2.6. Industrial
- 5.3. Market Analysis, Insights and Forecast - by Region
- 5.3.1. North America
- 5.3.2. Asia Pacific
- 5.3.3. Europe
- 5.3.4. Rest of the World
- 5.1. Market Analysis, Insights and Forecast - by Type
- 6. North America Smart Fabrics Industry Analysis, Insights and Forecast, 2020-2032
- 6.1. Market Analysis, Insights and Forecast - by Type
- 6.1.1. Passive Smart Fabrics
- 6.1.2. Active Fabrics
- 6.1.3. Ultra-smart Fabrics
- 6.2. Market Analysis, Insights and Forecast - by Application
- 6.2.1. Fashion and Entertainment
- 6.2.2. Sports and Fitness
- 6.2.3. Medical
- 6.2.4. Transportation and Others
- 6.2.5. Space and Military
- 6.2.6. Industrial
- 6.1. Market Analysis, Insights and Forecast - by Type
- 7. Asia Pacific Smart Fabrics Industry Analysis, Insights and Forecast, 2020-2032
- 7.1. Market Analysis, Insights and Forecast - by Type
- 7.1.1. Passive Smart Fabrics
- 7.1.2. Active Fabrics
- 7.1.3. Ultra-smart Fabrics
- 7.2. Market Analysis, Insights and Forecast - by Application
- 7.2.1. Fashion and Entertainment
- 7.2.2. Sports and Fitness
- 7.2.3. Medical
- 7.2.4. Transportation and Others
- 7.2.5. Space and Military
- 7.2.6. Industrial
- 7.1. Market Analysis, Insights and Forecast - by Type
- 8. Europe Smart Fabrics Industry Analysis, Insights and Forecast, 2020-2032
- 8.1. Market Analysis, Insights and Forecast - by Type
- 8.1.1. Passive Smart Fabrics
- 8.1.2. Active Fabrics
- 8.1.3. Ultra-smart Fabrics
- 8.2. Market Analysis, Insights and Forecast - by Application
- 8.2.1. Fashion and Entertainment
- 8.2.2. Sports and Fitness
- 8.2.3. Medical
- 8.2.4. Transportation and Others
- 8.2.5. Space and Military
- 8.2.6. Industrial
- 8.1. Market Analysis, Insights and Forecast - by Type
- 9. Rest of the World Smart Fabrics Industry Analysis, Insights and Forecast, 2020-2032
- 9.1. Market Analysis, Insights and Forecast - by Type
- 9.1.1. Passive Smart Fabrics
- 9.1.2. Active Fabrics
- 9.1.3. Ultra-smart Fabrics
- 9.2. Market Analysis, Insights and Forecast - by Application
- 9.2.1. Fashion and Entertainment
- 9.2.2. Sports and Fitness
- 9.2.3. Medical
- 9.2.4. Transportation and Others
- 9.2.5. Space and Military
- 9.2.6. Industrial
- 9.1. Market Analysis, Insights and Forecast - by Type
- 10. Competitive Analysis
- 10.1. Global Market Share Analysis 2025
- 10.2. Company Profiles
- 10.2.1 Adidas AG
- 10.2.1.1. Overview
- 10.2.1.2. Products
- 10.2.1.3. SWOT Analysis
- 10.2.1.4. Recent Developments
- 10.2.1.5. Financials (Based on Availability)
- 10.2.2 NIKE Inc
- 10.2.2.1. Overview
- 10.2.2.2. Products
- 10.2.2.3. SWOT Analysis
- 10.2.2.4. Recent Developments
- 10.2.2.5. Financials (Based on Availability)
- 10.2.3 ThermoSoft International Corporation
- 10.2.3.1. Overview
- 10.2.3.2. Products
- 10.2.3.3. SWOT Analysis
- 10.2.3.4. Recent Developments
- 10.2.3.5. Financials (Based on Availability)
- 10.2.4 Ohmatex
- 10.2.4.1. Overview
- 10.2.4.2. Products
- 10.2.4.3. SWOT Analysis
- 10.2.4.4. Recent Developments
- 10.2.4.5. Financials (Based on Availability)
- 10.2.5 AIQ Smart Clothing Inc
- 10.2.5.1. Overview
- 10.2.5.2. Products
- 10.2.5.3. SWOT Analysis
- 10.2.5.4. Recent Developments
- 10.2.5.5. Financials (Based on Availability)
- 10.2.6 OTEX Specialty Narrow Fabrics Inc
- 10.2.6.1. Overview
- 10.2.6.2. Products
- 10.2.6.3. SWOT Analysis
- 10.2.6.4. Recent Developments
- 10.2.6.5. Financials (Based on Availability)
- 10.2.7 Sensoria Inc
- 10.2.7.1. Overview
- 10.2.7.2. Products
- 10.2.7.3. SWOT Analysis
- 10.2.7.4. Recent Developments
- 10.2.7.5. Financials (Based on Availability)
- 10.2.8 Schoeller Textil AG
- 10.2.8.1. Overview
- 10.2.8.2. Products
- 10.2.8.3. SWOT Analysis
- 10.2.8.4. Recent Developments
- 10.2.8.5. Financials (Based on Availability)
- 10.2.9 Interactive Wear AG
- 10.2.9.1. Overview
- 10.2.9.2. Products
- 10.2.9.3. SWOT Analysis
- 10.2.9.4. Recent Developments
- 10.2.9.5. Financials (Based on Availability)
- 10.2.10 Kolon Industries Inc
- 10.2.10.1. Overview
- 10.2.10.2. Products
- 10.2.10.3. SWOT Analysis
- 10.2.10.4. Recent Developments
- 10.2.10.5. Financials (Based on Availability)
- 10.2.1 Adidas AG
List of Figures
- Figure 1: Global Smart Fabrics Industry Revenue Breakdown (billion, %) by Region 2025 & 2033
- Figure 2: Global Smart Fabrics Industry Volume Breakdown (Million, %) by Region 2025 & 2033
- Figure 3: North America Smart Fabrics Industry Revenue (billion), by Type 2025 & 2033
- Figure 4: North America Smart Fabrics Industry Volume (Million), by Type 2025 & 2033
- Figure 5: North America Smart Fabrics Industry Revenue Share (%), by Type 2025 & 2033
- Figure 6: North America Smart Fabrics Industry Volume Share (%), by Type 2025 & 2033
- Figure 7: North America Smart Fabrics Industry Revenue (billion), by Application 2025 & 2033
- Figure 8: North America Smart Fabrics Industry Volume (Million), by Application 2025 & 2033
- Figure 9: North America Smart Fabrics Industry Revenue Share (%), by Application 2025 & 2033
- Figure 10: North America Smart Fabrics Industry Volume Share (%), by Application 2025 & 2033
- Figure 11: North America Smart Fabrics Industry Revenue (billion), by Country 2025 & 2033
- Figure 12: North America Smart Fabrics Industry Volume (Million), by Country 2025 & 2033
- Figure 13: North America Smart Fabrics Industry Revenue Share (%), by Country 2025 & 2033
- Figure 14: North America Smart Fabrics Industry Volume Share (%), by Country 2025 & 2033
- Figure 15: Asia Pacific Smart Fabrics Industry Revenue (billion), by Type 2025 & 2033
- Figure 16: Asia Pacific Smart Fabrics Industry Volume (Million), by Type 2025 & 2033
- Figure 17: Asia Pacific Smart Fabrics Industry Revenue Share (%), by Type 2025 & 2033
- Figure 18: Asia Pacific Smart Fabrics Industry Volume Share (%), by Type 2025 & 2033
- Figure 19: Asia Pacific Smart Fabrics Industry Revenue (billion), by Application 2025 & 2033
- Figure 20: Asia Pacific Smart Fabrics Industry Volume (Million), by Application 2025 & 2033
- Figure 21: Asia Pacific Smart Fabrics Industry Revenue Share (%), by Application 2025 & 2033
- Figure 22: Asia Pacific Smart Fabrics Industry Volume Share (%), by Application 2025 & 2033
- Figure 23: Asia Pacific Smart Fabrics Industry Revenue (billion), by Country 2025 & 2033
- Figure 24: Asia Pacific Smart Fabrics Industry Volume (Million), by Country 2025 & 2033
- Figure 25: Asia Pacific Smart Fabrics Industry Revenue Share (%), by Country 2025 & 2033
- Figure 26: Asia Pacific Smart Fabrics Industry Volume Share (%), by Country 2025 & 2033
- Figure 27: Europe Smart Fabrics Industry Revenue (billion), by Type 2025 & 2033
- Figure 28: Europe Smart Fabrics Industry Volume (Million), by Type 2025 & 2033
- Figure 29: Europe Smart Fabrics Industry Revenue Share (%), by Type 2025 & 2033
- Figure 30: Europe Smart Fabrics Industry Volume Share (%), by Type 2025 & 2033
- Figure 31: Europe Smart Fabrics Industry Revenue (billion), by Application 2025 & 2033
- Figure 32: Europe Smart Fabrics Industry Volume (Million), by Application 2025 & 2033
- Figure 33: Europe Smart Fabrics Industry Revenue Share (%), by Application 2025 & 2033
- Figure 34: Europe Smart Fabrics Industry Volume Share (%), by Application 2025 & 2033
- Figure 35: Europe Smart Fabrics Industry Revenue (billion), by Country 2025 & 2033
- Figure 36: Europe Smart Fabrics Industry Volume (Million), by Country 2025 & 2033
- Figure 37: Europe Smart Fabrics Industry Revenue Share (%), by Country 2025 & 2033
- Figure 38: Europe Smart Fabrics Industry Volume Share (%), by Country 2025 & 2033
- Figure 39: Rest of the World Smart Fabrics Industry Revenue (billion), by Type 2025 & 2033
- Figure 40: Rest of the World Smart Fabrics Industry Volume (Million), by Type 2025 & 2033
- Figure 41: Rest of the World Smart Fabrics Industry Revenue Share (%), by Type 2025 & 2033
- Figure 42: Rest of the World Smart Fabrics Industry Volume Share (%), by Type 2025 & 2033
- Figure 43: Rest of the World Smart Fabrics Industry Revenue (billion), by Application 2025 & 2033
- Figure 44: Rest of the World Smart Fabrics Industry Volume (Million), by Application 2025 & 2033
- Figure 45: Rest of the World Smart Fabrics Industry Revenue Share (%), by Application 2025 & 2033
- Figure 46: Rest of the World Smart Fabrics Industry Volume Share (%), by Application 2025 & 2033
- Figure 47: Rest of the World Smart Fabrics Industry Revenue (billion), by Country 2025 & 2033
- Figure 48: Rest of the World Smart Fabrics Industry Volume (Million), by Country 2025 & 2033
- Figure 49: Rest of the World Smart Fabrics Industry Revenue Share (%), by Country 2025 & 2033
- Figure 50: Rest of the World Smart Fabrics Industry Volume Share (%), by Country 2025 & 2033
List of Tables
- Table 1: Global Smart Fabrics Industry Revenue billion Forecast, by Type 2020 & 2033
- Table 2: Global Smart Fabrics Industry Volume Million Forecast, by Type 2020 & 2033
- Table 3: Global Smart Fabrics Industry Revenue billion Forecast, by Application 2020 & 2033
- Table 4: Global Smart Fabrics Industry Volume Million Forecast, by Application 2020 & 2033
- Table 5: Global Smart Fabrics Industry Revenue billion Forecast, by Region 2020 & 2033
- Table 6: Global Smart Fabrics Industry Volume Million Forecast, by Region 2020 & 2033
- Table 7: Global Smart Fabrics Industry Revenue billion Forecast, by Type 2020 & 2033
- Table 8: Global Smart Fabrics Industry Volume Million Forecast, by Type 2020 & 2033
- Table 9: Global Smart Fabrics Industry Revenue billion Forecast, by Application 2020 & 2033
- Table 10: Global Smart Fabrics Industry Volume Million Forecast, by Application 2020 & 2033
- Table 11: Global Smart Fabrics Industry Revenue billion Forecast, by Country 2020 & 2033
- Table 12: Global Smart Fabrics Industry Volume Million Forecast, by Country 2020 & 2033
- Table 13: Global Smart Fabrics Industry Revenue billion Forecast, by Type 2020 & 2033
- Table 14: Global Smart Fabrics Industry Volume Million Forecast, by Type 2020 & 2033
- Table 15: Global Smart Fabrics Industry Revenue billion Forecast, by Application 2020 & 2033
- Table 16: Global Smart Fabrics Industry Volume Million Forecast, by Application 2020 & 2033
- Table 17: Global Smart Fabrics Industry Revenue billion Forecast, by Country 2020 & 2033
- Table 18: Global Smart Fabrics Industry Volume Million Forecast, by Country 2020 & 2033
- Table 19: Global Smart Fabrics Industry Revenue billion Forecast, by Type 2020 & 2033
- Table 20: Global Smart Fabrics Industry Volume Million Forecast, by Type 2020 & 2033
- Table 21: Global Smart Fabrics Industry Revenue billion Forecast, by Application 2020 & 2033
- Table 22: Global Smart Fabrics Industry Volume Million Forecast, by Application 2020 & 2033
- Table 23: Global Smart Fabrics Industry Revenue billion Forecast, by Country 2020 & 2033
- Table 24: Global Smart Fabrics Industry Volume Million Forecast, by Country 2020 & 2033
- Table 25: Global Smart Fabrics Industry Revenue billion Forecast, by Type 2020 & 2033
- Table 26: Global Smart Fabrics Industry Volume Million Forecast, by Type 2020 & 2033
- Table 27: Global Smart Fabrics Industry Revenue billion Forecast, by Application 2020 & 2033
- Table 28: Global Smart Fabrics Industry Volume Million Forecast, by Application 2020 & 2033
- Table 29: Global Smart Fabrics Industry Revenue billion Forecast, by Country 2020 & 2033
- Table 30: Global Smart Fabrics Industry Volume Million Forecast, by Country 2020 & 2033
Frequently Asked Questions
1. What is the projected Compound Annual Growth Rate (CAGR) of the Smart Fabrics Industry?
The projected CAGR is approximately 28.4%.
2. Which companies are prominent players in the Smart Fabrics Industry?
Key companies in the market include Adidas AG, NIKE Inc, ThermoSoft International Corporation, Ohmatex, AIQ Smart Clothing Inc, OTEX Specialty Narrow Fabrics Inc , Sensoria Inc, Schoeller Textil AG, Interactive Wear AG, Kolon Industries Inc.
3. What are the main segments of the Smart Fabrics Industry?
The market segments include Type, Application.
4. Can you provide details about the market size?
The market size is estimated to be USD 39.51 billion as of 2022.
5. What are some drivers contributing to market growth?
Growth in Wearable Electronics Industry; Miniaturization of Electronics and Developments across Flexible Electronics.
6. What are the notable trends driving market growth?
Fashion and Entertainment Industry to Witness Significant Growth.
7. Are there any restraints impacting market growth?
High Initial Cost.
8. Can you provide examples of recent developments in the market?
April 2023 : A team at Cambridge University has developed a fabric that would incorporate LEDs, energy harvesting, storage capabilities, and sensors into clothing. The researchers have exhibited a method to produce next-generation smart textiles inexpensively and without changing the technology currently used for textile manufacturing.
9. What pricing options are available for accessing the report?
Pricing options include single-user, multi-user, and enterprise licenses priced at USD 4750, USD 5250, and USD 8750 respectively.
10. Is the market size provided in terms of value or volume?
The market size is provided in terms of value, measured in billion and volume, measured in Million.
11. Are there any specific market keywords associated with the report?
Yes, the market keyword associated with the report is "Smart Fabrics Industry," which aids in identifying and referencing the specific market segment covered.
12. How do I determine which pricing option suits my needs best?
The pricing options vary based on user requirements and access needs. Individual users may opt for single-user licenses, while businesses requiring broader access may choose multi-user or enterprise licenses for cost-effective access to the report.
13. Are there any additional resources or data provided in the Smart Fabrics Industry report?
While the report offers comprehensive insights, it's advisable to review the specific contents or supplementary materials provided to ascertain if additional resources or data are available.
14. How can I stay updated on further developments or reports in the Smart Fabrics Industry?
To stay informed about further developments, trends, and reports in the Smart Fabrics Industry, consider subscribing to industry newsletters, following relevant companies and organizations, or regularly checking reputable industry news sources and publications.
Methodology
Step 1 - Identification of Relevant Samples Size from Population Database


Step 2 - Approaches for Defining Global Market Size (Value, Volume* & Price*)

Note*: In applicable scenarios
Step 3 - Data Sources
Primary Research
- Web Analytics
- Survey Reports
- Research Institute
- Latest Research Reports
- Opinion Leaders
Secondary Research
- Annual Reports
- White Paper
- Latest Press Release
- Industry Association
- Paid Database
- Investor Presentations

Step 4 - Data Triangulation
Involves using different sources of information in order to increase the validity of a study
These sources are likely to be stakeholders in a program - participants, other researchers, program staff, other community members, and so on.
Then we put all data in single framework & apply various statistical tools to find out the dynamic on the market.
During the analysis stage, feedback from the stakeholder groups would be compared to determine areas of agreement as well as areas of divergence