Gesture Recognition in Retail Industry Analysis Report 2025: Market to Grow by a CAGR of XX to 2033, Driven by Government Incentives, Popularity of Virtual Assistants, and Strategic Partnerships

Gesture Recognition in Retail Industry by Technology (Touch-based Gesture Recognition, Touch-less Gesture Recognition), by North America, by Europe, by Asia Pacific, by Latin America, by Middle East Forecast 2025-2033

Aug 24 2025
Base Year: 2024

234 Pages
Main Logo

Gesture Recognition in Retail Industry Analysis Report 2025: Market to Grow by a CAGR of XX to 2033, Driven by Government Incentives, Popularity of Virtual Assistants, and Strategic Partnerships


Home
Industries
Technology, Media and Telecom
sponsor image
sponsor image
sponsor image
sponsor image
sponsor image
sponsor image
sponsor image
sponsor image
sponsor image
sponsor image
sponsor image
sponsor image
sponsor image
sponsor image
sponsor image
sponsor image
sponsor image
sponsor image
sponsor image
sponsor image

Tailored for you

  • In-depth Analysis Tailored to Specified Regions or Segments
  • Company Profiles Customized to User Preferences
  • Comprehensive Insights Focused on Specific Segments or Regions
  • Customized Evaluation of Competitive Landscape to Meet Your Needs
  • Tailored Customization to Address Other Specific Requirements
Ask for customization


Key Insights

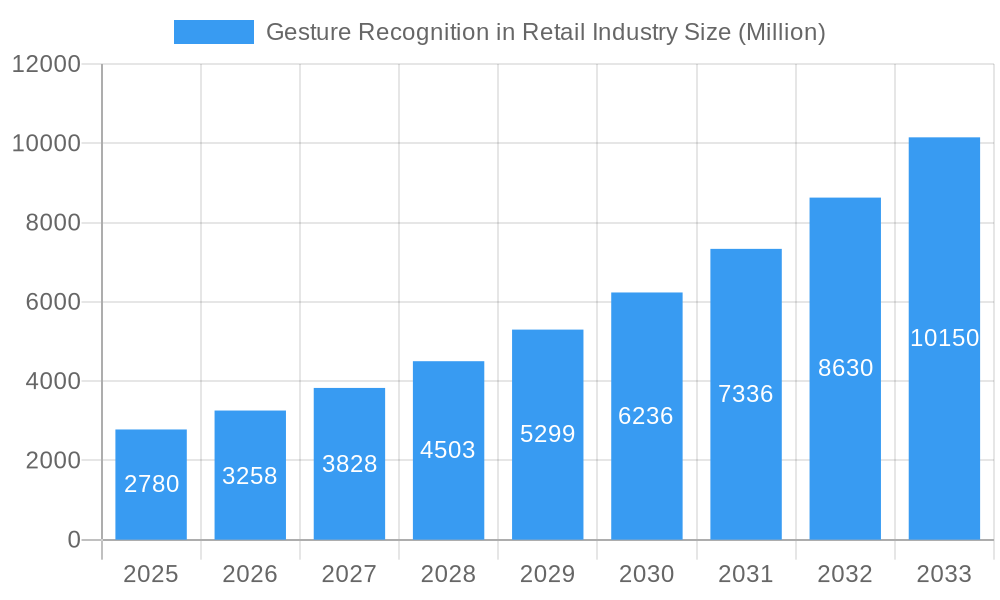
The gesture recognition market in the retail industry is experiencing robust growth, projected to reach $2.78 billion in 2025 and exhibiting a Compound Annual Growth Rate (CAGR) of 17.26% from 2025 to 2033. This expansion is driven by several key factors. Firstly, the increasing adoption of contactless technologies, fueled by hygiene concerns post-pandemic and the desire for quicker checkout experiences, is significantly boosting demand for gesture-based interfaces. Secondly, advancements in computer vision and machine learning are enabling more accurate and responsive gesture recognition systems, overcoming previous limitations in reliability and robustness. Retailers are increasingly integrating gesture recognition into various applications, such as interactive displays, self-checkout kiosks, and inventory management systems, to enhance customer engagement, streamline operations, and improve overall efficiency. The market segmentation reveals a strong preference for touchless solutions, driven by hygiene concerns and the potential for a more seamless user experience. Major players like Apple, Google, and Microsoft are heavily invested in this technology, fostering innovation and driving wider adoption.

The North American market currently holds a significant share, reflecting high technological adoption rates and a robust retail infrastructure. However, rapid growth is anticipated in the Asia-Pacific region, driven by increasing smartphone penetration, rising disposable incomes, and a burgeoning e-commerce sector. While the high initial investment costs for implementing gesture recognition systems present a restraint, the long-term return on investment in terms of improved customer experience, operational efficiency, and reduced labor costs is increasingly outweighing this hurdle. Furthermore, ongoing research and development efforts are focusing on enhancing accuracy, reducing costs, and expanding the functionalities of gesture recognition technology, promising further market expansion in the coming years. Competition is fierce, with established tech giants and specialized companies vying for market dominance. Future growth will likely be influenced by the successful integration of gesture recognition into augmented reality and virtual reality shopping experiences, further blurring the lines between the physical and digital retail landscapes.

Gesture Recognition in Retail Industry Research Report - Market Size, Growth & Forecast

Gesture Recognition in Retail Industry: A Comprehensive Market Report (2019-2033)

This in-depth report provides a comprehensive analysis of the Gesture Recognition in Retail Industry market, encompassing market dynamics, growth trends, regional segmentation, product landscape, key players, and future outlook. The study period covers 2019-2033, with 2025 as the base and estimated year. The report focuses on two key parent markets: Human-Machine Interface (HMI) and Retail Technology, with child markets segmented by technology (Touch-based and Touchless Gesture Recognition). The market size is projected in million units.

Keywords: Gesture Recognition, Retail Technology, Touchless Gesture Recognition, Touch-based Gesture Recognition, Human-Machine Interface (HMI), Retail Automation, AI, Virtual Smart Sensors, Market Size, Market Share, CAGR, Market Growth, Infineon Technologies AG, Cognitec Systems GmbH, Crunchfish AB, Google LLC, GestureTek Inc, Microsoft Corporation, Omron Corporation, Elliptic Labs, Sony Corporation, Apple Inc, Intel Corporation.

Gesture Recognition in Retail Industry Market Dynamics & Structure

The Gesture Recognition in Retail Industry market exhibits a moderately concentrated structure, with key players like Infineon Technologies AG, Microsoft Corporation, and Apple Inc holding significant market share. However, the emergence of smaller, innovative companies is driving competition. Technological innovation, particularly in AI and machine learning, is a key driver, pushing the boundaries of accuracy and responsiveness. Regulatory frameworks related to data privacy and security influence market development, while the rising adoption of contactless technologies further fuels growth. Existing technologies like barcode scanners and POS systems act as competitive substitutes, but gesture recognition offers a more streamlined and intuitive user experience. The market is driven by younger demographics who readily adopt new technologies. M&A activity is expected to remain moderate, with strategic acquisitions primarily focusing on enhancing technological capabilities and expanding market reach. The total M&A deals closed between 2019-2024 are estimated at xx.

  • Market Concentration: Moderately Concentrated
  • Technological Innovation: AI, Machine Learning, Enhanced Accuracy
  • Regulatory Frameworks: Data Privacy Regulations (GDPR, CCPA)
  • Competitive Substitutes: Barcode Scanners, POS Systems
  • End-User Demographics: Younger Generations (18-45 years) demonstrating higher adoption rates.
  • M&A Trends: xx deals between 2019 and 2024, focusing on technology acquisition and market expansion.

Gesture Recognition in Retail Industry Growth Trends & Insights

The Gesture Recognition in Retail Industry market experienced significant growth during the historical period (2019-2024), with a CAGR of xx%. This growth is attributed to several factors, including the increasing adoption of contactless technologies, rising consumer demand for seamless shopping experiences, and technological advancements leading to enhanced accuracy and reliability of gesture recognition systems. The market size in 2024 was estimated at xx million units. The forecast period (2025-2033) projects continued expansion, driven by the increasing integration of gesture recognition into various retail applications, such as self-checkout kiosks, interactive displays, and inventory management systems. Technological disruptions, such as the integration of AI and computer vision, will further propel market growth. Consumer behavior shifts toward personalized and contactless shopping experiences are key factors boosting adoption rates. Market penetration is anticipated to reach xx% by 2033. The forecasted market size for 2033 is projected at xx million units.

Gesture Recognition in Retail Industry Growth

Dominant Regions, Countries, or Segments in Gesture Recognition in Retail Industry

North America currently holds the leading position in the Gesture Recognition in Retail Industry market, driven by high technological adoption rates and a strong focus on enhancing customer experience in the retail sector. The region's robust technological infrastructure and the presence of major technology companies significantly contribute to its dominance. Within North America, the United States and Canada are experiencing rapid market growth due to favorable government policies and regulations supporting technological advancements and digitalization in retail. Europe is another rapidly growing market, fueled by increasing adoption of smart retail solutions and rising investments in technology across major economies like Germany, the UK, and France. Asia Pacific is also expected to witness significant growth driven by increasing smartphone penetration, rising disposable incomes and a large base of retail businesses eager to improve customer engagement through innovative technologies. Touchless gesture recognition is experiencing faster growth compared to touch-based technology due to hygiene concerns and the desire for contactless interactions, particularly post-pandemic.

  • Key Drivers in North America: Strong technological infrastructure, high consumer adoption rates, presence of major tech companies.
  • Key Drivers in Europe: Investment in smart retail technologies, favorable government policies.
  • Key Drivers in Asia Pacific: High smartphone penetration, rising disposable income, large retail sector.
  • Technology Segment Growth: Touchless Gesture Recognition showing faster growth due to hygiene concerns and contactless interaction preferences.

Gesture Recognition in Retail Industry Product Landscape

The Gesture Recognition in Retail Industry boasts a diverse product landscape, ranging from simple touch-based systems for interactive kiosks to sophisticated AI-powered touchless solutions offering advanced features like 3D gesture recognition and personalized interactions. These systems incorporate various technologies, including computer vision, machine learning, and deep learning algorithms, providing high accuracy and responsiveness. The unique selling propositions often center on ease of use, enhanced customer experience, and improved efficiency in retail operations. Technological advancements focus on increasing accuracy in challenging environments, reducing latency, and enhancing security.

Key Drivers, Barriers & Challenges in Gesture Recognition in Retail Industry

Key Drivers: The primary drivers are the increasing demand for contactless interactions post-pandemic, advancements in AI and machine learning, and the need for enhanced customer engagement in the retail sector. Government initiatives promoting digitalization in retail also contribute. For example, many governments are incentivizing contactless payments and technology upgrades.

Key Challenges and Restraints: High implementation costs for retailers can hinder adoption, especially for smaller businesses. Data security and privacy concerns are significant barriers, influencing regulatory requirements and consumer trust. The need for robust and reliable technology that functions accurately across various environments and conditions poses a technical challenge. Supply chain disruptions and component shortages can also impact market growth. These factors collectively could reduce market growth by xx% in the coming years.

Emerging Opportunities in Gesture Recognition in Retail Industry

Emerging opportunities lie in the integration of gesture recognition into augmented reality (AR) and virtual reality (VR) shopping experiences, personalized recommendations based on gesture analysis, and advanced inventory management systems. The growing adoption of smart shelves and interactive displays presents opportunities for incorporating gesture-based interactions. Expansion into untapped markets, especially in developing economies, holds significant growth potential.

Growth Accelerators in the Gesture Recognition in Retail Industry Industry

Strategic partnerships between technology providers and retailers are crucial accelerators, facilitating seamless integration of gesture recognition solutions into existing retail infrastructure. Technological breakthroughs, particularly in improving accuracy and reducing latency, will drive widespread adoption. Market expansion strategies focused on targeting smaller businesses and expanding into new geographic regions are vital for sustaining growth.

Key Players Shaping the Gesture Recognition in Retail Industry Market

  • Infineon Technologies AG
  • Cognitec Systems GmbH
  • Crunchfish AB
  • Google LLC
  • GestureTek Inc
  • Microsoft Corporation
  • Omron Corporation
  • Elliptic Labs
  • Sony Corporation
  • Apple Inc
  • Intel Corporation

Notable Milestones in Gesture Recognition in Retail Industry Sector

  • March 2023: Sohar University researchers developed a hand gesture detection system using neural networks, image processing, and IoT, translating hand motions into text and audio. This signifies progress in accessible gesture recognition technology.
  • March 2022: Elliptic Labs partnered with AMD to integrate its AI Virtual Smart Sensor Platform into AMD Ryzen PRO 5000 Series laptops, enabling features like 3D touchless gesture recognition. This collaboration broadened touchless technology's reach to a wider market.

In-Depth Gesture Recognition in Retail Industry Market Outlook

The future of the Gesture Recognition in Retail Industry market looks promising, with continued growth driven by technological advancements, increasing demand for seamless customer experiences, and expansion into new applications. Strategic partnerships and market expansion initiatives will play a crucial role in unlocking the full potential of this market. The focus on enhancing accuracy, reliability, and security of gesture recognition systems will further drive adoption, leading to significant growth over the forecast period.

Gesture Recognition in Retail Industry Segmentation

  • 1. Technology
    • 1.1. Touch-based Gesture Recognition
    • 1.2. Touch-less Gesture Recognition

Gesture Recognition in Retail Industry Segmentation By Geography

  • 1. North America
  • 2. Europe
  • 3. Asia Pacific
  • 4. Latin America
  • 5. Middle East
Gesture Recognition in Retail Industry Regional Share


Gesture Recognition in Retail Industry REPORT HIGHLIGHTS

AspectsDetails
Study Period 2019-2033
Base Year 2024
Estimated Year 2025
Forecast Period2025-2033
Historical Period2019-2024
Growth RateCAGR of 17.26% from 2019-2033
Segmentation
    • By Technology
      • Touch-based Gesture Recognition
      • Touch-less Gesture Recognition
  • By Geography
    • North America
    • Europe
    • Asia Pacific
    • Latin America
    • Middle East


Table of Contents

  1. 1. Introduction
    • 1.1. Research Scope
    • 1.2. Market Segmentation
    • 1.3. Research Methodology
    • 1.4. Definitions and Assumptions
  2. 2. Executive Summary
    • 2.1. Introduction
  3. 3. Market Dynamics
    • 3.1. Introduction
      • 3.2. Market Drivers
        • 3.2.1. Increasing Dependence on Gestures to Communicate with Machines; Increasing Use of Devices Supporting Gesture Recognition Across the Retail Sector
      • 3.3. Market Restrains
        • 3.3.1 Algorithms
        • 3.3.2 Mathematical and Other Complexities Associated with the Gesture Recognition Technology
      • 3.4. Market Trends
        • 3.4.1. Touchless Technology is Expected to hold the Major Share
  4. 4. Market Factor Analysis
    • 4.1. Porters Five Forces
    • 4.2. Supply/Value Chain
    • 4.3. PESTEL analysis
    • 4.4. Market Entropy
    • 4.5. Patent/Trademark Analysis
  5. 5. Global Gesture Recognition in Retail Industry Analysis, Insights and Forecast, 2019-2031
    • 5.1. Market Analysis, Insights and Forecast - by Technology
      • 5.1.1. Touch-based Gesture Recognition
      • 5.1.2. Touch-less Gesture Recognition
    • 5.2. Market Analysis, Insights and Forecast - by Region
      • 5.2.1. North America
      • 5.2.2. Europe
      • 5.2.3. Asia Pacific
      • 5.2.4. Latin America
      • 5.2.5. Middle East
  6. 6. North America Gesture Recognition in Retail Industry Analysis, Insights and Forecast, 2019-2031
    • 6.1. Market Analysis, Insights and Forecast - by Technology
      • 6.1.1. Touch-based Gesture Recognition
      • 6.1.2. Touch-less Gesture Recognition
  7. 7. Europe Gesture Recognition in Retail Industry Analysis, Insights and Forecast, 2019-2031
    • 7.1. Market Analysis, Insights and Forecast - by Technology
      • 7.1.1. Touch-based Gesture Recognition
      • 7.1.2. Touch-less Gesture Recognition
  8. 8. Asia Pacific Gesture Recognition in Retail Industry Analysis, Insights and Forecast, 2019-2031
    • 8.1. Market Analysis, Insights and Forecast - by Technology
      • 8.1.1. Touch-based Gesture Recognition
      • 8.1.2. Touch-less Gesture Recognition
  9. 9. Latin America Gesture Recognition in Retail Industry Analysis, Insights and Forecast, 2019-2031
    • 9.1. Market Analysis, Insights and Forecast - by Technology
      • 9.1.1. Touch-based Gesture Recognition
      • 9.1.2. Touch-less Gesture Recognition
  10. 10. Middle East Gesture Recognition in Retail Industry Analysis, Insights and Forecast, 2019-2031
    • 10.1. Market Analysis, Insights and Forecast - by Technology
      • 10.1.1. Touch-based Gesture Recognition
      • 10.1.2. Touch-less Gesture Recognition
  11. 11. North America Gesture Recognition in Retail Industry Analysis, Insights and Forecast, 2019-2031
      • 11.1. Market Analysis, Insights and Forecast - By Country/Sub-region
        • 11.1.1 United States
        • 11.1.2 Canada
        • 11.1.3 Mexico
  12. 12. Europe Gesture Recognition in Retail Industry Analysis, Insights and Forecast, 2019-2031
      • 12.1. Market Analysis, Insights and Forecast - By Country/Sub-region
        • 12.1.1 Germany
        • 12.1.2 United Kingdom
        • 12.1.3 France
        • 12.1.4 Spain
        • 12.1.5 Italy
        • 12.1.6 Spain
        • 12.1.7 Belgium
        • 12.1.8 Netherland
        • 12.1.9 Nordics
        • 12.1.10 Rest of Europe
  13. 13. Asia Pacific Gesture Recognition in Retail Industry Analysis, Insights and Forecast, 2019-2031
      • 13.1. Market Analysis, Insights and Forecast - By Country/Sub-region
        • 13.1.1 China
        • 13.1.2 Japan
        • 13.1.3 India
        • 13.1.4 South Korea
        • 13.1.5 Southeast Asia
        • 13.1.6 Australia
        • 13.1.7 Indonesia
        • 13.1.8 Phillipes
        • 13.1.9 Singapore
        • 13.1.10 Thailandc
        • 13.1.11 Rest of Asia Pacific
  14. 14. South America Gesture Recognition in Retail Industry Analysis, Insights and Forecast, 2019-2031
      • 14.1. Market Analysis, Insights and Forecast - By Country/Sub-region
        • 14.1.1 Brazil
        • 14.1.2 Argentina
        • 14.1.3 Peru
        • 14.1.4 Chile
        • 14.1.5 Colombia
        • 14.1.6 Ecuador
        • 14.1.7 Venezuela
        • 14.1.8 Rest of South America
  15. 15. MEA Gesture Recognition in Retail Industry Analysis, Insights and Forecast, 2019-2031
      • 15.1. Market Analysis, Insights and Forecast - By Country/Sub-region
        • 15.1.1 United Arab Emirates
        • 15.1.2 Saudi Arabia
        • 15.1.3 South Africa
        • 15.1.4 Rest of Middle East and Africa
  16. 16. Competitive Analysis
    • 16.1. Global Market Share Analysis 2024
      • 16.2. Company Profiles
        • 16.2.1 Infineon Technologies AG
          • 16.2.1.1. Overview
          • 16.2.1.2. Products
          • 16.2.1.3. SWOT Analysis
          • 16.2.1.4. Recent Developments
          • 16.2.1.5. Financials (Based on Availability)
        • 16.2.2 Cognitec Systems GmbH
          • 16.2.2.1. Overview
          • 16.2.2.2. Products
          • 16.2.2.3. SWOT Analysis
          • 16.2.2.4. Recent Developments
          • 16.2.2.5. Financials (Based on Availability)
        • 16.2.3 Crunchfish AB
          • 16.2.3.1. Overview
          • 16.2.3.2. Products
          • 16.2.3.3. SWOT Analysis
          • 16.2.3.4. Recent Developments
          • 16.2.3.5. Financials (Based on Availability)
        • 16.2.4 Google LLC
          • 16.2.4.1. Overview
          • 16.2.4.2. Products
          • 16.2.4.3. SWOT Analysis
          • 16.2.4.4. Recent Developments
          • 16.2.4.5. Financials (Based on Availability)
        • 16.2.5 GestureTek Inc
          • 16.2.5.1. Overview
          • 16.2.5.2. Products
          • 16.2.5.3. SWOT Analysis
          • 16.2.5.4. Recent Developments
          • 16.2.5.5. Financials (Based on Availability)
        • 16.2.6 Microsoft Corporation
          • 16.2.6.1. Overview
          • 16.2.6.2. Products
          • 16.2.6.3. SWOT Analysis
          • 16.2.6.4. Recent Developments
          • 16.2.6.5. Financials (Based on Availability)
        • 16.2.7 Omron Corporation
          • 16.2.7.1. Overview
          • 16.2.7.2. Products
          • 16.2.7.3. SWOT Analysis
          • 16.2.7.4. Recent Developments
          • 16.2.7.5. Financials (Based on Availability)
        • 16.2.8 Elliptic Labs
          • 16.2.8.1. Overview
          • 16.2.8.2. Products
          • 16.2.8.3. SWOT Analysis
          • 16.2.8.4. Recent Developments
          • 16.2.8.5. Financials (Based on Availability)
        • 16.2.9 Sony Corporation
          • 16.2.9.1. Overview
          • 16.2.9.2. Products
          • 16.2.9.3. SWOT Analysis
          • 16.2.9.4. Recent Developments
          • 16.2.9.5. Financials (Based on Availability)
        • 16.2.10 Apple Inc
          • 16.2.10.1. Overview
          • 16.2.10.2. Products
          • 16.2.10.3. SWOT Analysis
          • 16.2.10.4. Recent Developments
          • 16.2.10.5. Financials (Based on Availability)
        • 16.2.11 Intel Corporation
          • 16.2.11.1. Overview
          • 16.2.11.2. Products
          • 16.2.11.3. SWOT Analysis
          • 16.2.11.4. Recent Developments
          • 16.2.11.5. Financials (Based on Availability)

List of Figures

  1. Figure 1: Global Gesture Recognition in Retail Industry Revenue Breakdown (Million, %) by Region 2024 & 2032
  2. Figure 2: North America Gesture Recognition in Retail Industry Revenue (Million), by Country 2024 & 2032
  3. Figure 3: North America Gesture Recognition in Retail Industry Revenue Share (%), by Country 2024 & 2032
  4. Figure 4: Europe Gesture Recognition in Retail Industry Revenue (Million), by Country 2024 & 2032
  5. Figure 5: Europe Gesture Recognition in Retail Industry Revenue Share (%), by Country 2024 & 2032
  6. Figure 6: Asia Pacific Gesture Recognition in Retail Industry Revenue (Million), by Country 2024 & 2032
  7. Figure 7: Asia Pacific Gesture Recognition in Retail Industry Revenue Share (%), by Country 2024 & 2032
  8. Figure 8: South America Gesture Recognition in Retail Industry Revenue (Million), by Country 2024 & 2032
  9. Figure 9: South America Gesture Recognition in Retail Industry Revenue Share (%), by Country 2024 & 2032
  10. Figure 10: MEA Gesture Recognition in Retail Industry Revenue (Million), by Country 2024 & 2032
  11. Figure 11: MEA Gesture Recognition in Retail Industry Revenue Share (%), by Country 2024 & 2032
  12. Figure 12: North America Gesture Recognition in Retail Industry Revenue (Million), by Technology 2024 & 2032
  13. Figure 13: North America Gesture Recognition in Retail Industry Revenue Share (%), by Technology 2024 & 2032
  14. Figure 14: North America Gesture Recognition in Retail Industry Revenue (Million), by Country 2024 & 2032
  15. Figure 15: North America Gesture Recognition in Retail Industry Revenue Share (%), by Country 2024 & 2032
  16. Figure 16: Europe Gesture Recognition in Retail Industry Revenue (Million), by Technology 2024 & 2032
  17. Figure 17: Europe Gesture Recognition in Retail Industry Revenue Share (%), by Technology 2024 & 2032
  18. Figure 18: Europe Gesture Recognition in Retail Industry Revenue (Million), by Country 2024 & 2032
  19. Figure 19: Europe Gesture Recognition in Retail Industry Revenue Share (%), by Country 2024 & 2032
  20. Figure 20: Asia Pacific Gesture Recognition in Retail Industry Revenue (Million), by Technology 2024 & 2032
  21. Figure 21: Asia Pacific Gesture Recognition in Retail Industry Revenue Share (%), by Technology 2024 & 2032
  22. Figure 22: Asia Pacific Gesture Recognition in Retail Industry Revenue (Million), by Country 2024 & 2032
  23. Figure 23: Asia Pacific Gesture Recognition in Retail Industry Revenue Share (%), by Country 2024 & 2032
  24. Figure 24: Latin America Gesture Recognition in Retail Industry Revenue (Million), by Technology 2024 & 2032
  25. Figure 25: Latin America Gesture Recognition in Retail Industry Revenue Share (%), by Technology 2024 & 2032
  26. Figure 26: Latin America Gesture Recognition in Retail Industry Revenue (Million), by Country 2024 & 2032
  27. Figure 27: Latin America Gesture Recognition in Retail Industry Revenue Share (%), by Country 2024 & 2032
  28. Figure 28: Middle East Gesture Recognition in Retail Industry Revenue (Million), by Technology 2024 & 2032
  29. Figure 29: Middle East Gesture Recognition in Retail Industry Revenue Share (%), by Technology 2024 & 2032
  30. Figure 30: Middle East Gesture Recognition in Retail Industry Revenue (Million), by Country 2024 & 2032
  31. Figure 31: Middle East Gesture Recognition in Retail Industry Revenue Share (%), by Country 2024 & 2032

List of Tables

  1. Table 1: Global Gesture Recognition in Retail Industry Revenue Million Forecast, by Region 2019 & 2032
  2. Table 2: Global Gesture Recognition in Retail Industry Revenue Million Forecast, by Technology 2019 & 2032
  3. Table 3: Global Gesture Recognition in Retail Industry Revenue Million Forecast, by Region 2019 & 2032
  4. Table 4: Global Gesture Recognition in Retail Industry Revenue Million Forecast, by Country 2019 & 2032
  5. Table 5: United States Gesture Recognition in Retail Industry Revenue (Million) Forecast, by Application 2019 & 2032
  6. Table 6: Canada Gesture Recognition in Retail Industry Revenue (Million) Forecast, by Application 2019 & 2032
  7. Table 7: Mexico Gesture Recognition in Retail Industry Revenue (Million) Forecast, by Application 2019 & 2032
  8. Table 8: Global Gesture Recognition in Retail Industry Revenue Million Forecast, by Country 2019 & 2032
  9. Table 9: Germany Gesture Recognition in Retail Industry Revenue (Million) Forecast, by Application 2019 & 2032
  10. Table 10: United Kingdom Gesture Recognition in Retail Industry Revenue (Million) Forecast, by Application 2019 & 2032
  11. Table 11: France Gesture Recognition in Retail Industry Revenue (Million) Forecast, by Application 2019 & 2032
  12. Table 12: Spain Gesture Recognition in Retail Industry Revenue (Million) Forecast, by Application 2019 & 2032
  13. Table 13: Italy Gesture Recognition in Retail Industry Revenue (Million) Forecast, by Application 2019 & 2032
  14. Table 14: Spain Gesture Recognition in Retail Industry Revenue (Million) Forecast, by Application 2019 & 2032
  15. Table 15: Belgium Gesture Recognition in Retail Industry Revenue (Million) Forecast, by Application 2019 & 2032
  16. Table 16: Netherland Gesture Recognition in Retail Industry Revenue (Million) Forecast, by Application 2019 & 2032
  17. Table 17: Nordics Gesture Recognition in Retail Industry Revenue (Million) Forecast, by Application 2019 & 2032
  18. Table 18: Rest of Europe Gesture Recognition in Retail Industry Revenue (Million) Forecast, by Application 2019 & 2032
  19. Table 19: Global Gesture Recognition in Retail Industry Revenue Million Forecast, by Country 2019 & 2032
  20. Table 20: China Gesture Recognition in Retail Industry Revenue (Million) Forecast, by Application 2019 & 2032
  21. Table 21: Japan Gesture Recognition in Retail Industry Revenue (Million) Forecast, by Application 2019 & 2032
  22. Table 22: India Gesture Recognition in Retail Industry Revenue (Million) Forecast, by Application 2019 & 2032
  23. Table 23: South Korea Gesture Recognition in Retail Industry Revenue (Million) Forecast, by Application 2019 & 2032
  24. Table 24: Southeast Asia Gesture Recognition in Retail Industry Revenue (Million) Forecast, by Application 2019 & 2032
  25. Table 25: Australia Gesture Recognition in Retail Industry Revenue (Million) Forecast, by Application 2019 & 2032
  26. Table 26: Indonesia Gesture Recognition in Retail Industry Revenue (Million) Forecast, by Application 2019 & 2032
  27. Table 27: Phillipes Gesture Recognition in Retail Industry Revenue (Million) Forecast, by Application 2019 & 2032
  28. Table 28: Singapore Gesture Recognition in Retail Industry Revenue (Million) Forecast, by Application 2019 & 2032
  29. Table 29: Thailandc Gesture Recognition in Retail Industry Revenue (Million) Forecast, by Application 2019 & 2032
  30. Table 30: Rest of Asia Pacific Gesture Recognition in Retail Industry Revenue (Million) Forecast, by Application 2019 & 2032
  31. Table 31: Global Gesture Recognition in Retail Industry Revenue Million Forecast, by Country 2019 & 2032
  32. Table 32: Brazil Gesture Recognition in Retail Industry Revenue (Million) Forecast, by Application 2019 & 2032
  33. Table 33: Argentina Gesture Recognition in Retail Industry Revenue (Million) Forecast, by Application 2019 & 2032
  34. Table 34: Peru Gesture Recognition in Retail Industry Revenue (Million) Forecast, by Application 2019 & 2032
  35. Table 35: Chile Gesture Recognition in Retail Industry Revenue (Million) Forecast, by Application 2019 & 2032
  36. Table 36: Colombia Gesture Recognition in Retail Industry Revenue (Million) Forecast, by Application 2019 & 2032
  37. Table 37: Ecuador Gesture Recognition in Retail Industry Revenue (Million) Forecast, by Application 2019 & 2032
  38. Table 38: Venezuela Gesture Recognition in Retail Industry Revenue (Million) Forecast, by Application 2019 & 2032
  39. Table 39: Rest of South America Gesture Recognition in Retail Industry Revenue (Million) Forecast, by Application 2019 & 2032
  40. Table 40: Global Gesture Recognition in Retail Industry Revenue Million Forecast, by Country 2019 & 2032
  41. Table 41: United Arab Emirates Gesture Recognition in Retail Industry Revenue (Million) Forecast, by Application 2019 & 2032
  42. Table 42: Saudi Arabia Gesture Recognition in Retail Industry Revenue (Million) Forecast, by Application 2019 & 2032
  43. Table 43: South Africa Gesture Recognition in Retail Industry Revenue (Million) Forecast, by Application 2019 & 2032
  44. Table 44: Rest of Middle East and Africa Gesture Recognition in Retail Industry Revenue (Million) Forecast, by Application 2019 & 2032
  45. Table 45: Global Gesture Recognition in Retail Industry Revenue Million Forecast, by Technology 2019 & 2032
  46. Table 46: Global Gesture Recognition in Retail Industry Revenue Million Forecast, by Country 2019 & 2032
  47. Table 47: Global Gesture Recognition in Retail Industry Revenue Million Forecast, by Technology 2019 & 2032
  48. Table 48: Global Gesture Recognition in Retail Industry Revenue Million Forecast, by Country 2019 & 2032
  49. Table 49: Global Gesture Recognition in Retail Industry Revenue Million Forecast, by Technology 2019 & 2032
  50. Table 50: Global Gesture Recognition in Retail Industry Revenue Million Forecast, by Country 2019 & 2032
  51. Table 51: Global Gesture Recognition in Retail Industry Revenue Million Forecast, by Technology 2019 & 2032
  52. Table 52: Global Gesture Recognition in Retail Industry Revenue Million Forecast, by Country 2019 & 2032
  53. Table 53: Global Gesture Recognition in Retail Industry Revenue Million Forecast, by Technology 2019 & 2032
  54. Table 54: Global Gesture Recognition in Retail Industry Revenue Million Forecast, by Country 2019 & 2032


Frequently Asked Questions

1. What is the projected Compound Annual Growth Rate (CAGR) of the Gesture Recognition in Retail Industry?

The projected CAGR is approximately 17.26%.

2. Which companies are prominent players in the Gesture Recognition in Retail Industry?

Key companies in the market include Infineon Technologies AG, Cognitec Systems GmbH, Crunchfish AB, Google LLC, GestureTek Inc, Microsoft Corporation, Omron Corporation, Elliptic Labs, Sony Corporation, Apple Inc, Intel Corporation.

3. What are the main segments of the Gesture Recognition in Retail Industry?

The market segments include Technology.

4. Can you provide details about the market size?

The market size is estimated to be USD 2.78 Million as of 2022.

5. What are some drivers contributing to market growth?

Increasing Dependence on Gestures to Communicate with Machines; Increasing Use of Devices Supporting Gesture Recognition Across the Retail Sector.

6. What are the notable trends driving market growth?

Touchless Technology is Expected to hold the Major Share.

7. Are there any restraints impacting market growth?

Algorithms. Mathematical and Other Complexities Associated with the Gesture Recognition Technology.

8. Can you provide examples of recent developments in the market?

March 2023: Sohar University researchers created a hand gesture detection system based on neural networks, image processing techniques, and the Internet of Things. The device identifies hand motions and converts them to written text and audio.

9. What pricing options are available for accessing the report?

Pricing options include single-user, multi-user, and enterprise licenses priced at USD 4750, USD 5250, and USD 8750 respectively.

10. Is the market size provided in terms of value or volume?

The market size is provided in terms of value, measured in Million.

11. Are there any specific market keywords associated with the report?

Yes, the market keyword associated with the report is "Gesture Recognition in Retail Industry," which aids in identifying and referencing the specific market segment covered.

12. How do I determine which pricing option suits my needs best?

The pricing options vary based on user requirements and access needs. Individual users may opt for single-user licenses, while businesses requiring broader access may choose multi-user or enterprise licenses for cost-effective access to the report.

13. Are there any additional resources or data provided in the Gesture Recognition in Retail Industry report?

While the report offers comprehensive insights, it's advisable to review the specific contents or supplementary materials provided to ascertain if additional resources or data are available.

14. How can I stay updated on further developments or reports in the Gesture Recognition in Retail Industry?

To stay informed about further developments, trends, and reports in the Gesture Recognition in Retail Industry, consider subscribing to industry newsletters, following relevant companies and organizations, or regularly checking reputable industry news sources and publications.


Methodology

Step 1 - Identification of Relevant Samples Size from Population Database

Step Chart
Bar Chart
Method Chart

Step 2 - Approaches for Defining Global Market Size (Value, Volume* & Price*)

Approach Chart
Top-down and bottom-up approaches are used to validate the global market size and estimate the market size for manufactures, regional segments, product, and application.

Note*: In applicable scenarios

Step 3 - Data Sources

Primary Research

  • Web Analytics
  • Survey Reports
  • Research Institute
  • Latest Research Reports
  • Opinion Leaders

Secondary Research

  • Annual Reports
  • White Paper
  • Latest Press Release
  • Industry Association
  • Paid Database
  • Investor Presentations
Analyst Chart

Step 4 - Data Triangulation

Involves using different sources of information in order to increase the validity of a study

These sources are likely to be stakeholders in a program - participants, other researchers, program staff, other community members, and so on.

Then we put all data in single framework & apply various statistical tools to find out the dynamic on the market.

During the analysis stage, feedback from the stakeholder groups would be compared to determine areas of agreement as well as areas of divergence

Additionally, after gathering mixed and scattered data from a wide range of sources, data is triangulated and correlated to come up with estimated figures which are further validated through primary mediums or industry experts, opinion leaders.

About Visionary Data Reports

Visionary Data Reports provides future-focused market research, advanced analytics, and strategic insights for technology, healthcare, green energy, and finance. Our reports help you anticipate trends, innovate, and lead in your industry. Our expert team combines primary research, data science, and industry knowledge to deliver actionable intelligence. We offer syndicated reports, custom analytics, and consulting services tailored to your business needs. At Visionary Data Reports, we are committed to quality, transparency, and client satisfaction. Every report is rigorously validated to ensure accuracy and relevance. Our global perspective and forward-thinking approach help you understand both current and emerging market dynamics.

Stay ahead with Visionary Data Reports. Subscribe to our newsletter for the latest insights and research highlights, and follow us on social media for real-time updates. Visionary Data Reports – Your Guide to Tomorrow’s Opportunities.

artwork spiralartwork spiralRelated Reports
artwork underline

Future Forecasts for Indonesia Connected Healthcare Market Industry Growth

The size of the Indonesia Connected Healthcare Market market was valued at USD 0.69 Million in 2024 and is projected to reach USD 3.92 Million by 2033, with an expected CAGR of 28.18% during the forecast period.

October 2025
Base Year: 2024
No Of Pages: 197
Price: $3800

Innovations Driving Europe Soft Facility Management Market Market 2025-2033

Explore the dynamic Europe Soft Facility Management Market growth, key drivers like outsourcing and cleaning services, and major trends shaping the industry from 2025-2033. Discover market size, CAGR, and leading companies.

October 2025
Base Year: 2024
No Of Pages: 210
Price: $4750

Japan Cloud Data Center Industry Industry Growth Trends and Analysis

Explore the booming Japan Cloud Data Center Industry with key insights into market size, CAGR of 21.06%, drivers, trends, and top companies. Discover growth opportunities and regional analysis.

October 2025
Base Year: 2024
No Of Pages: 197
Price: $3800

DLP Market Market Size and Trends 2025-2033: Comprehensive Outlook

Explore the booming Data Loss Prevention (DLP) market, projected to hit USD 2.86 billion by 2025 with a 22.77% CAGR. Discover key drivers like AI, cloud security, and regulatory compliance shaping the future of data protection.

October 2025
Base Year: 2024
No Of Pages: 234
Price: $4750

Navigating Hebei Data Center Market Market Trends: Competitor Analysis and Growth 2025-2033

Explore the booming Hebei data center market, driven by digital transformation and cloud adoption. Discover key growth drivers, trends, restraints, and market size projections up to 2033.

October 2025
Base Year: 2024
No Of Pages: 197
Price: $3800

Strategic Insights for Tactical Inertial Systems Market Market Expansion

Explore the booming Tactical Inertial Systems Market with projected growth to over $4.7 billion by 2033. Discover key drivers like defense modernization, technological advancements in MEMS, FOG, and RLG, and insights into market segments, leading companies, and regional trends.

October 2025
Base Year: 2024
No Of Pages: 234
Price: $4750

Regional Analysis of North America Clinical Data Analytics in Healthcare Industry Growth Trajectories

The size of the North America Clinical Data Analytics in Healthcare Industry market was valued at USD 12.85 Million in 2024 and is projected to reach USD 33.01 Million by 2033, with an expected CAGR of 14.43% during the forecast period.

October 2025
Base Year: 2024
No Of Pages: 197
Price: $3800

Proximity Sensor Industry Industry Analysis and Consumer Behavior

Explore the booming global proximity sensor market, driven by automation and IoT. Discover market size, CAGR of 7.30%, key drivers, restraints, technology trends, and industry segments from 2019-2033.

October 2025
Base Year: 2024
No Of Pages: 234
Price: $4750

Exploring Innovation in Enterprise Mobility In Healthcare Market Industry

The size of the Enterprise Mobility In Healthcare Market market was valued at USD XX Million in 2024 and is projected to reach USD XXX Million by 2033, with an expected CAGR of 11.92% during the forecast period.

October 2025
Base Year: 2024
No Of Pages: 234
Price: $4750

US Hazardous Location LED Lighting Industry Navigating Dynamics Comprehensive Analysis and Forecasts 2025-2033

Explore the dynamic US Hazardous Location LED Lighting market, forecasting substantial growth driven by safety demands in oil & gas, petrochemicals, and industrial sectors. Discover key trends, drivers, and restraints.

October 2025
Base Year: 2024
No Of Pages: 197
Price: $3800

Automotive LED Lighting Market Market Demand Dynamics: Insights 2025-2033

Explore the dynamic Automotive LED Lighting Market with expert analysis on growth drivers, trends, restraints, and key segments. Discover market size, CAGR of 16.42%, and regional insights for 2025-2033.

October 2025
Base Year: 2024
No Of Pages: 197
Price: $3800

Latin America IT Device Market Market’s Evolutionary Trends 2025-2033

Explore the Latin America IT Device Market analysis, including market size, CAGR, drivers, trends, restraints, segments, and regional insights for Brazil, Argentina, Mexico, and more.

October 2025
Base Year: 2024
No Of Pages: 234
Price: $4750

Europe Outdoor LED Lighting Market Market Overview: Growth and Insights

Explore the booming Europe Outdoor LED Lighting Market, driven by energy efficiency, smart technology, and urban development. Discover key trends, drivers, and growth forecasts for street, public, and roadway lighting.

October 2025
Base Year: 2024
No Of Pages: 197
Price: $3800

Media Streaming Market Market Overview: Trends and Strategic Forecasts 2025-2033

Explore the booming media streaming market forecast, driven by music & video streaming, subscription models, and smart devices. Analyze key players, growth drivers, and regional trends from 2019-2033.

October 2025
Base Year: 2024
No Of Pages: 234
Price: $4750

Digital Signage Media Player Market Navigating Dynamics Comprehensive Analysis and Forecasts 2025-2033

Explore the surging Digital Signage Media Player Market, valued at \$1.95 billion and projected to grow at a 9.09% CAGR. Discover key drivers, trends, and segmentation across retail, hospitality, corporate, and transportation sectors.

October 2025
Base Year: 2024
No Of Pages: 234
Price: $4750

United Kingdom System Integrator Market for Industrial Automation and Emerging Technologies: Growth Insights 2025-2033

Explore the UK Industrial Automation System Integrator Market's robust growth, driven by Industry 4.0 adoption, PLCs, DCS, SCADA, HMIs, and robotics. Analyze key drivers, trends, and restraints shaping the future of manufacturing, automotive, food & beverage, and pharmaceutical sectors.

October 2025
Base Year: 2024
No Of Pages: 197
Price: $3800

Growth Roadmap for Internet of Things in the Energy Market Market 2025-2033

Explore the dynamic Internet of Things (IoT) in Energy Market, driven by efficiency and grid modernization. Discover key drivers, trends, and growth opportunities from 2019-2033.

October 2025
Base Year: 2024
No Of Pages: 234
Price: $4750

Edge Analytics Industry Insightful Analysis: Trends, Competitor Dynamics, and Opportunities 2025-2033

The size of the Edge Analytics Industry market was valued at USD 13.88 Million in 2024 and is projected to reach USD 64.86 Million by 2033, with an expected CAGR of 24.64% during the forecast period.

October 2025
Base Year: 2024
No Of Pages: 234
Price: $4750

Service Delivery Automation Industry: Harnessing Emerging Innovations for Growth 2025-2033

Explore the booming Service Delivery Automation market with insights into its $30.65M size, impressive 27.25% CAGR, key drivers, and future trends. Discover opportunities in BFSI, IT, and healthcare.

October 2025
Base Year: 2024
No Of Pages: 234
Price: $4750

Europe Sortation System Industry XX CAGR Growth to Drive Market Size to XXX Million by 2033

Explore the booming European Sortation System Industry! Discover market size, CAGR, key drivers like e-commerce & automation trends, and leading companies from 2025-2033.

October 2025
Base Year: 2024
No Of Pages: 210
Price: $4750

Strategic Insights into United Kingdom Marketing Agencies Market Market Trends

Explore the UK marketing agencies market's growth trajectory, key drivers like digital transformation, and dominant services. Discover trends in BFSI, Retail, and IT sectors with insights from leading agencies.

October 2025
Base Year: 2024
No Of Pages: 197
Price: $3800

Chemical Sensor Market Insights: Market Size Analysis to 2033

Explore the booming Chemical Sensor Market analysis, uncovering key growth drivers, emerging trends like IoT integration and advanced materials, and market size projections up to 2033. Discover segment-specific opportunities and regional market shares.

October 2025
Base Year: 2024
No Of Pages: 234
Price: $4750

Gas Sensor, Detector and Analyzer Market Charting Growth Trajectories 2025-2033: Strategic Insights and Forecasts

Explore the booming Gas Sensor, Detector, and Analyzer market, driven by environmental regulations and safety needs. Discover market size, CAGR, key drivers, trends, and leading companies shaping the future of gas monitoring.

October 2025
Base Year: 2024
No Of Pages: 234
Price: $4750

Romania Facility Management Industry XX CAGR Growth Analysis 2025-2033

Explore the dynamic Romania Facility Management market, highlighting growth drivers, key trends like bundled FM services, and market size projections up to 2033. Discover insights for commercial, institutional, and industrial sectors.

October 2025
Base Year: 2024
No Of Pages: 197
Price: $3800

Workforce Management Industry Market Overview: Trends and Strategic Forecasts 2025-2033

Explore the dynamic Workforce Management industry's growth, driven by cloud adoption and advanced analytics. Discover market trends, key drivers, and forecasts for 2025-2033, alongside leading companies and regional insights.

October 2025
Base Year: 2024
No Of Pages: 197
Price: $3800

Self-Organizing Network Market Market Analysis and Forecasts

The size of the Self-Organizing Network Market market was valued at USD XX Million in 2024 and is projected to reach USD XXX Million by 2033, with an expected CAGR of 11.00% during the forecast period.

October 2025
Base Year: 2024
No Of Pages: 234
Price: $4750

US Hardware OTP Token Authentication Market Trends and Opportunities for Growth

Explore the robust growth and key drivers of the US Hardware OTP Token Authentication Market, featuring insights on CAGR, market size, and dominant industry segments for enhanced digital security.

October 2025
Base Year: 2024
No Of Pages: 197
Price: $3800

Team Collaboration Tools Industry Consumer Behavior Dynamics: Key Trends 2025-2033

The size of the Team Collaboration Tools Industry market was valued at USD XX Million in 2024 and is projected to reach USD XXX Million by 2033, with an expected CAGR of 18.00% during the forecast period.

October 2025
Base Year: 2024
No Of Pages: 234
Price: $4750

Exploring Innovation in Video Streaming Market Industry

Explore the booming video streaming market, projected for massive growth driven by OTT, live streaming, and subscription models. Discover key drivers, trends, and leading companies.

October 2025
Base Year: 2024
No Of Pages: 234
Price: $4750

South Korea Data Center Rack Market Unlocking Growth Potential: 2025-2033 Analysis and Forecasts

Explore the booming South Korea data center rack market analysis, revealing key insights, CAGR, market drivers, and trends in racks, size, and end-users from 2019-2033.

October 2025
Base Year: 2024
No Of Pages: 197
Price: $3800

Iraq ICT Market Strategic Dynamics: Competitor Analysis 2025-2033

Explore the Iraqi ICT market's dynamic growth, driven by digital transformation, IT services, and telecommunications. Uncover key trends, drivers, and segments shaping Iraq's technology landscape through 2033.

October 2025
Base Year: 2024
No Of Pages: 197
Price: $3800

Comprehensive Overview of Canada Digital Transformation Market Trends: 2025-2033

Canada's digital transformation market is set for rapid expansion, driven by XR, IoT, AI, and Cloud. Discover key trends, drivers, and market size projections for 2025-2033.

October 2025
Base Year: 2024
No Of Pages: 197
Price: $3800

Drivers of Change in Europe Thermal Imaging Systems Market Market 2025-2033

Explore the dynamic European Thermal Imaging Systems Market, driven by robust growth, advanced security needs, and key industry applications. Discover market size, CAGR, key trends, and future projections up to 2033.

October 2025
Base Year: 2024
No Of Pages: 210
Price: $4750

UK Telecom Industry Report 2025: Growth Driven by Government Incentives and Partnerships

Explore the dynamic UK telecom industry forecast, analyzing market size, CAGR of 4.59%, key drivers like 5G and OTT services, and leading companies. Get insights into voice, data, and pay TV segments.

October 2025
Base Year: 2024
No Of Pages: 197
Price: $3800

Comprehensive Overview of Europe HVAC Market Trends: 2025-2033

The size of the Europe HVAC Market market was valued at USD 28.67 Million in 2024 and is projected to reach USD 43.68 Million by 2033, with an expected CAGR of 6.20% during the forecast period.

October 2025
Base Year: 2024
No Of Pages: 210
Price: $4750

Future Forecasts for South America Data Center Server Market Industry Growth

Explore the booming South America Data Center Server Market. Discover key insights, growth drivers, market size projections (2019-2033), and leading companies. Understand the impact of digital transformation and cloud adoption on server infrastructure.

October 2025
Base Year: 2024
No Of Pages: 234
Price: $4750

Exploring Opportunities in Internet of Things Security Industry Sector

Explore the booming Internet of Things (IoT) Security market, projected to reach USD 65 billion by 2033 with a 33.53% CAGR. Discover key drivers, trends, and segments for robust cybersecurity.

October 2025
Base Year: 2024
No Of Pages: 234
Price: $4750

South Korea Smart Home Market Market Analysis and Growth Roadmap

Explore the booming South Korea smart home market, projected for significant growth with a 16.15% CAGR. Discover key drivers, emerging trends in Wi-Fi and Bluetooth technologies, and leading companies shaping smart living.

October 2025
Base Year: 2024
No Of Pages: 197
Price: $3800

Market Deep Dive: Exploring Collaborative Robot Market Trends 2025-2033

Explore the booming Collaborative Robot Market, driven by automation, AI, and affordability. Discover key drivers, trends, and market size projections up to 2033 for electronics, automotive, manufacturing, and more.

October 2025
Base Year: 2024
No Of Pages: 234
Price: $4750

Exploring Europe Structured Cabling Market Market Evolution 2025-2033

Explore the dynamic European structured cabling market, driven by 5G, IoT, and data center growth. Get insights on market size, CAGR, drivers, and key players from 2019-2033.

October 2025
Base Year: 2024
No Of Pages: 210
Price: $4750

Understanding Growth Trends in Europe Machine Vision Systems Industry Market

Explore the booming Europe Machine Vision Systems market, driven by Industry 4.0 adoption, automation, and AI. Discover key trends, growth drivers, restraints, and forecast for 2025-2033.

October 2025
Base Year: 2024
No Of Pages: 210
Price: $4750

Radiation Detection, Monitoring & Safety Industry 2025-2033 Trends: Unveiling Growth Opportunities and Competitor Dynamics

Explore the dynamic Radiation Detection, Monitoring & Safety market, driven by healthcare, industrial, and defense needs. Discover growth drivers, key trends, and market size projections through 2033.

October 2025
Base Year: 2024
No Of Pages: 234
Price: $4750

North America Location Analytics Market Future-Proof Strategies: Market Trends 2025-2033

Explore the booming North America Location Analytics Market, projected to reach $4.49 million with a 16.32% CAGR. Discover key drivers, trends, and applications in retail, banking, and manufacturing.

October 2025
Base Year: 2024
No Of Pages: 197
Price: $3800

Growth Strategies in BI Market Market: 2025-2033 Outlook

Explore the dynamic Business Intelligence (BI) market, projected to reach $33.34 million with a 13.16% CAGR by 2033. Discover key drivers, trends like AI integration, and dominant industry segments shaping the future of data analytics.

October 2025
Base Year: 2024
No Of Pages: 234
Price: $4750

China Fitness Rings Market Market Predictions: Growth and Size Trends to 2033

Explore the booming China fitness rings market, driven by health trends and wearable tech adoption. Discover market size, CAGR, key players like Xiaomi and Huawei, and future growth potential through 2033.

October 2025
Base Year: 2024
No Of Pages: 197
Price: $3800

Unveiling South Korea Automotive LED Lighting Market Industry Trends

Explore the dynamic South Korea automotive LED lighting market with an estimated $1.2 billion size in 2025 and a strong 9.26% CAGR. Discover key growth drivers, emerging trends, and leading companies shaping the future of automotive lighting in Korea, from DRLs to advanced vehicle illumination.

October 2025
Base Year: 2024
No Of Pages: 197
Price: $3800

Exploring Barriers in Organic Field-Effect Transistor Industry Market: Trends and Analysis 2025-2033

Explore the booming Organic Field-Effect Transistor (OFET) market, driven by flexible electronics, IoT, and advanced applications. Discover market size, CAGR, key drivers, trends, and leading companies shaping the future of semiconductors.

October 2025
Base Year: 2024
No Of Pages: 234
Price: $4750

Data Wrangling Market 2025-2033 Market Analysis: Trends, Dynamics, and Growth Opportunities

Explore the booming Data Wrangling Market analysis, drivers, trends, and forecasts. Discover how businesses leverage data preparation for smarter insights and growth through 2033.

September 2025
Base Year: 2024
No Of Pages: 234
Price: $4750

North America Touch Screen Controllers Market Planning for the Future: Key Trends 2025-2033

Explore the North America touch screen controllers market forecast, driven by automotive, healthcare, and consumer electronics. Discover key insights, CAGR of 13.40%, and market trends.

September 2025
Base Year: 2024
No Of Pages: 210
Price: $4750

Europe Access Control Software Market Market’s Growth Blueprint

Explore the dynamic European Access Control Software Market, projected to reach \$153.30 million by 2025 with an 8.90% CAGR. Discover key drivers, trends, restraints, and leading companies shaping enhanced security solutions across commercial, residential, and industrial sectors.

September 2025
Base Year: 2024
No Of Pages: 210
Price: $4750

Business Address

Head Office

Ansec House 3 rd floor Tank Road, Yerwada, Pune, Maharashtra 411014

Contact Information

Craig Francis

Business Development Head

+17162654855

[email protected]

Secure Payment Partners

payment image
RetailLogisticsPackagingAutomotiveHealthcareAgricultureEnergy & PowerFood & BeverageAerospace & DefenseChemicals & MaterialsHospitality and TourismAnimal Nutrition & WellnessConsumer Goods and ServicesReal Estate and ConstructionHome and Property ImprovementTechnology, Media and TelecomManufacturing Products and ServicesFinancial Services and Investment Intelligence

© 2025 PRDUA Research & Media Private Limited, All rights reserved

Privacy Policy
Terms and Conditions
FAQ
  • Home
  • About Us
  • Industries
    • Aerospace & Defense
    • Agriculture
    • Animal Nutrition & Wellness
    • Automotive
    • Chemicals & Materials
    • Consumer Goods and Services
    • Energy & Power
    • Financial Services and Investment Intelligence
    • Food & Beverage
    • Home and Property Improvement
    • Hospitality and Tourism
    • Logistics
    • Manufacturing Products and Services
    • Packaging
    • Professional and Commercial Services
    • Real Estate and Construction
    • Retail
    • Technology, Media and Telecom
    • Healthcare
  • Services
  • Contact
Main Logo
  • Home
  • About Us
  • Industries
    • Aerospace & Defense
    • Agriculture
    • Animal Nutrition & Wellness
    • Automotive
    • Chemicals & Materials
    • Consumer Goods and Services
    • Energy & Power
    • Financial Services and Investment Intelligence
    • Food & Beverage
    • Home and Property Improvement
    • Hospitality and Tourism
    • Logistics
    • Manufacturing Products and Services
    • Packaging
    • Professional and Commercial Services
    • Real Estate and Construction
    • Retail
    • Technology, Media and Telecom
    • Healthcare
  • Services
  • Contact
+17162654855
[email protected]

+17162654855

[email protected]