

Key Insights
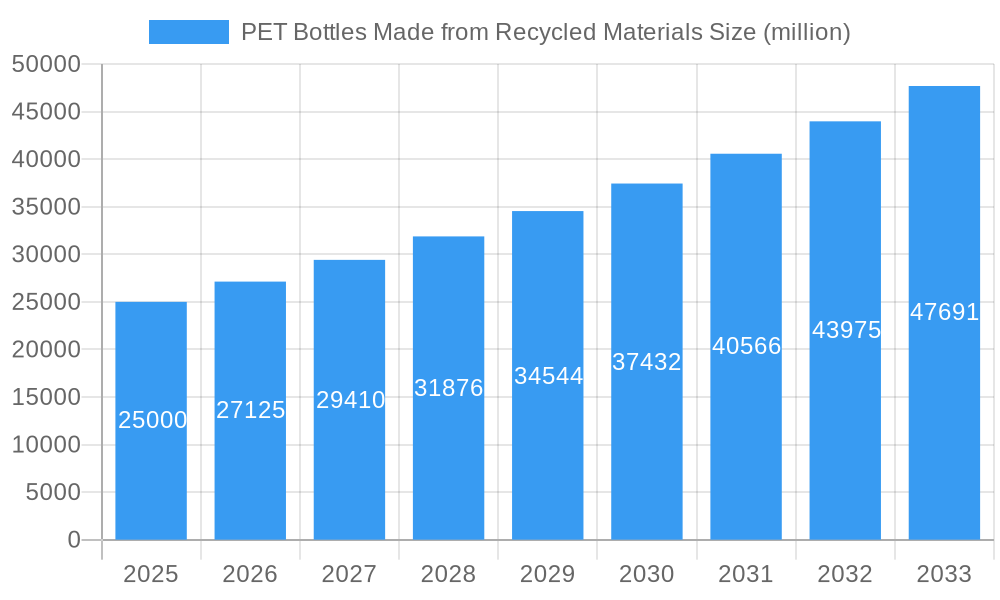
The global market for PET bottles made from recycled materials is experiencing robust growth, driven by increasing environmental consciousness among consumers and stringent regulatory mandates for sustainable packaging solutions. With a current market size estimated at USD 25,000 million in 2025, the sector is projected to expand at a Compound Annual Growth Rate (CAGR) of 8.5% through 2033. This significant expansion is fueled by the growing demand across key applications, particularly in the food and beverage sector, where brands are actively seeking eco-friendly alternatives to traditional virgin PET. The cosmetics industry also represents a substantial growth area, as consumers increasingly favor brands with demonstrable sustainability commitments. Furthermore, evolving consumer preferences for reusable and refillable options are indirectly boosting the market for recycled PET as it forms a key component in durable and sustainable packaging designs.
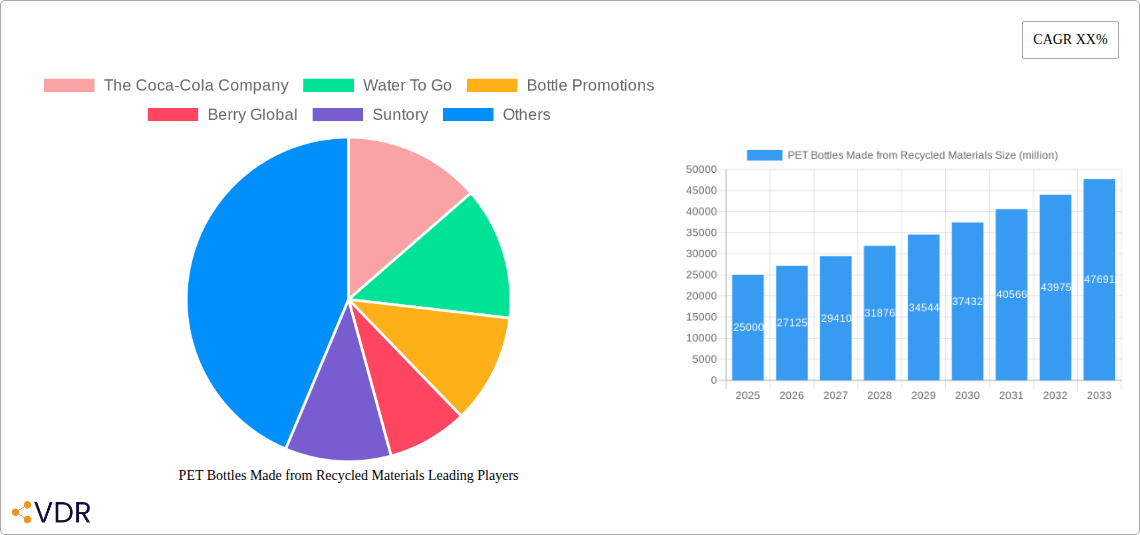
PET Bottles Made from Recycled Materials Market Size (In Billion)
The market's dynamism is further shaped by several key trends and a few restraining factors. Prominent trends include advancements in recycling technologies that enhance the quality and availability of recycled PET (rPET), making it a more viable and cost-effective option. The growing adoption of Extended Producer Responsibility (EPR) schemes and initiatives promoting a circular economy are also significant tailwinds. While the market is expanding, challenges such as the fluctuating cost and availability of high-quality recycled feedstock, alongside consumer concerns regarding the safety and aesthetic appeal of recycled materials in certain sensitive applications, warrant attention. However, these challenges are progressively being addressed through innovation and industry collaboration, ensuring a positive trajectory for recycled PET bottles. The market is segmented by bottle capacity, with medium-sized bottles (51 ml to 250 ml) holding a dominant share due to their widespread use in beverages and personal care products. Geographically, Asia Pacific is anticipated to witness the fastest growth, propelled by rapid industrialization and increasing environmental awareness in countries like China and India.
PET Bottles Made from Recycled Materials Company Market Share
Comprehensive Report: PET Bottles Made from Recycled Materials - Market Dynamics, Growth, and Future Outlook (2019–2033)
This in-depth report provides a critical analysis of the global PET bottles made from recycled materials market, offering unparalleled insights into its evolution, growth trajectory, and future potential. Covering the historical period from 2019 to 2024, the base year of 2025, and a comprehensive forecast period extending to 2033, this report is an essential resource for industry stakeholders seeking to understand market dynamics, identify growth opportunities, and navigate the competitive landscape. We meticulously analyze market concentration, technological innovations, regulatory frameworks, competitive product substitutes, end-user demographics, and M&A trends, alongside market size evolution, adoption rates, technological disruptions, and consumer behavior shifts. The report also highlights dominant regions, countries, and segments, detailing product innovations, key drivers, barriers, challenges, emerging opportunities, and growth accelerators. Essential for stakeholders including manufacturers, suppliers, investors, and policymakers, this report delivers actionable intelligence for strategic decision-making in the burgeoning recycled PET bottle market.
PET Bottles Made from Recycled Materials Market Dynamics & Structure
The PET bottles made from recycled materials market is characterized by a moderately concentrated structure, with a few key players holding significant market share, while a broader base of smaller manufacturers caters to niche demands. Technological innovation is primarily driven by advancements in recycling processes, such as chemical recycling, which aim to improve the quality and purity of recycled PET (rPET), enabling its use in a wider range of applications, including food-grade packaging. Regulatory frameworks, particularly in North America and Europe, are increasingly mandating the use of recycled content in plastic packaging, creating a significant push for market expansion. Competitive product substitutes, while present in the form of glass, aluminum, and other bioplastics, are facing growing pressure from the sustainability credentials of rPET. End-user demographics show a strong preference for brands demonstrating environmental responsibility, with younger generations being particularly influential in driving demand for sustainable packaging solutions. Mergers and acquisitions (M&A) activity is on the rise as larger companies seek to secure their supply chains of high-quality rPET and expand their production capacities.
- Market Concentration: Leading players like Berry Global and Pretium Packaging are prominent, but regional and specialized manufacturers contribute significantly to market diversity.
- Technological Innovation Drivers: Enhanced sorting technologies, advanced purification methods for rPET, and the development of closed-loop recycling systems are key innovation areas.
- Regulatory Frameworks: Extended Producer Responsibility (EPR) schemes and recycled content mandates are significant market shapers, especially in the EU and US.
- Competitive Product Substitutes: While glass and aluminum offer alternatives, their higher energy footprints and weight often favor rPET for beverage and food packaging.
- End-User Demographics: Growing consumer awareness of plastic pollution and a desire for eco-friendly products are powerful demand drivers.
- M&A Trends: Strategic acquisitions are focused on securing rPET supply, scaling production, and integrating recycling infrastructure. Deal volumes are projected to increase by 15% annually in the next three years.
PET Bottles Made from Recycled Materials Growth Trends & Insights
The global market for PET bottles made from recycled materials is on a robust growth trajectory, propelled by escalating environmental concerns and stringent regulatory mandates favoring circular economy principles. The market size is projected to witness a Compound Annual Growth Rate (CAGR) of approximately 8.5% during the forecast period (2025–2033). This expansion is underpinned by significant investments in advanced recycling technologies, including mechanical and chemical recycling, which are crucial for increasing the availability of high-quality rPET. Adoption rates for recycled PET are surging across various applications, particularly in the food and beverage sector, where major brands are actively integrating rPET into their packaging strategies to meet sustainability targets. Technological disruptions are not only improving the efficiency of recycling but also enhancing the properties of rPET, making it a viable and attractive alternative to virgin PET.
Consumer behavior is undergoing a palpable shift, with a growing segment of the population actively seeking out products packaged in recycled materials. This conscious consumerism translates into increased brand loyalty for companies demonstrating a commitment to sustainability. The increasing demand for convenience and portability, especially in the sports and beverage segments, further fuels the growth of rPET bottles. Furthermore, governments worldwide are implementing policies that incentivize the use of recycled content and penalize the use of virgin plastics, thereby creating a favorable market environment for rPET. The market penetration of recycled PET bottles is expected to reach over 60% of the total PET bottle market by 2030. The development of innovative bottle designs, lightweighting initiatives, and improved barrier properties in rPET are also contributing to its widespread adoption.
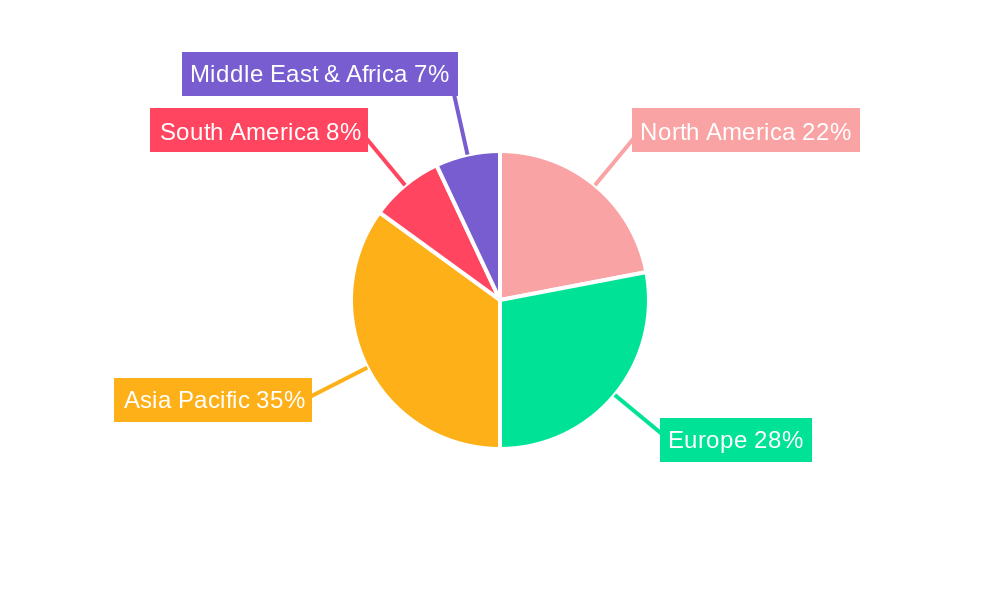
Dominant Regions, Countries, or Segments in PET Bottles Made from Recycled Materials
The global market for PET bottles made from recycled materials is experiencing dynamic growth, with certain regions and application segments leading the charge. Europe consistently emerges as the dominant region, driven by a confluence of stringent environmental regulations, high consumer awareness, and well-established recycling infrastructure. The Food and Beverages segment represents the largest and most influential application, accounting for an estimated 70 million units in 2025, with substantial growth driven by the immense volume of packaged beverages consumed globally. Within this segment, water, carbonated soft drinks, and juices are key drivers. The Sports Bottles application is also a significant contributor, with a projected market share of approximately 15 million units, fueled by the growing health and wellness trend and the demand for portable hydration solutions.
In terms of Types, bottles More than 250 ml represent the largest category by volume, encompassing a wide array of beverage and food packaging. This segment is estimated to account for over 50 million units in 2025. The 100 ml to 250 ml category is also a strong performer, catering to single-serving beverages and specialized food products, projected at around 25 million units. The increasing focus on sustainability by major beverage manufacturers, coupled with ambitious recycling targets set by national governments, such as those in Germany, France, and the UK, has solidified Europe's leading position. Furthermore, the strong commitment to the circular economy within the European Union, including initiatives like the EU Green Deal, provides a robust policy framework supporting the growth of recycled PET. The presence of key industry players like Suntory and Urtekram actively investing in recycled content further bolsters this dominance.
- Dominant Region: Europe: Characterized by proactive environmental policies and high consumer demand for sustainable products.
- Dominant Segment (Application): Food and Beverages: Accounts for the largest market share due to the vast consumption of packaged drinks and food items.
- Dominant Segment (Type): More than 250 ml: Reflects the prevalent packaging sizes for beverages and food products.
- Key Drivers in Europe: EU Circular Economy Action Plan, national plastic packaging taxes, and widespread consumer consciousness regarding environmental impact.
- Growth Potential in Food and Beverages: Continued brand commitments to reduce virgin plastic usage and meet corporate sustainability goals.
- Emerging Trends in Sports Bottles: Integration of lightweight designs and enhanced functionality in rPET sports bottles.
PET Bottles Made from Recycled Materials Product Landscape
The product landscape for PET bottles made from recycled materials is rapidly evolving, driven by innovations that enhance both sustainability and performance. Manufacturers are increasingly focused on producing high-quality rPET that meets stringent food-grade standards, enabling its use in a wider array of sensitive applications. Innovations in mechanical recycling processes are yielding cleaner and more consistent rPET flakes and pellets, while advancements in chemical recycling are unlocking the potential for infinite recyclability without significant degradation in material properties. Lightweighting initiatives continue to be a priority, reducing material usage and transportation emissions. Furthermore, improved barrier technologies are being integrated into rPET bottles to extend shelf life for sensitive products, expanding their applicability. Unique selling propositions often revolve around the percentage of recycled content, certifications for food safety, and the overall carbon footprint reduction achieved.
Key Drivers, Barriers & Challenges in PET Bottles Made from Recycled Materials
The PET bottles made from recycled materials market is propelled by several key drivers. Foremost among these are increasingly stringent government regulations mandating the use of recycled content and Extended Producer Responsibility (EPR) schemes, which incentivize circularity. Growing consumer demand for sustainable products and brands committed to environmental responsibility is a powerful market force. Technological advancements in recycling processes, such as improved sorting and purification, are increasing the availability and quality of rPET. Strategic partnerships between brand owners and recyclers are also accelerating adoption.
However, the market faces significant barriers and challenges. The availability and quality of high-grade rPET feedstock remain a concern, particularly in regions with less developed collection and sorting infrastructure. The cost of recycled PET can sometimes be higher than virgin PET, impacting price competitiveness. Regulatory inconsistencies across different regions can create complexity for global manufacturers. Supply chain disruptions and geopolitical factors can affect the stability of rPET sourcing. Furthermore, consumer perception and concerns about the safety and aesthetics of recycled materials, though diminishing, can still pose a challenge. The need for significant investment in recycling infrastructure and technology also presents a capital barrier.
- Key Drivers:
- Mandatory recycled content quotas (e.g., EU targets).
- Consumer preference for eco-friendly packaging.
- Technological innovations in recycling efficiency.
- Corporate Sustainability Goals (CSGs) of major brands.
- Barriers & Challenges:
- Inconsistent supply and quality of post-consumer rPET.
- Price volatility of rPET compared to virgin PET.
- Need for significant investment in collection and sorting infrastructure.
- Potential for contamination in the recycling stream.
- Global regulatory fragmentation.
Emerging Opportunities in PET Bottles Made from Recycled Materials
Emerging opportunities in the PET bottles made from recycled materials market are vast, driven by innovation and evolving consumer expectations. The development of advanced chemical recycling technologies presents a significant opportunity to create a truly circular economy for PET, enabling the production of food-grade rPET from mixed plastic waste. Untapped markets in developing economies, with growing middle classes and increasing awareness of environmental issues, offer substantial growth potential. Innovative applications beyond traditional beverage packaging, such as cosmetics, personal care products, and even certain industrial applications, are opening new avenues for rPET adoption. Evolving consumer preferences for transparency and traceability in product sourcing also present an opportunity for brands to highlight their commitment to using certified, high-quality recycled content. Furthermore, the integration of smart technologies for tracking recycled content within the supply chain can enhance consumer trust and brand value.
Growth Accelerators in the PET Bottles Made from Recycled Materials Industry
Several growth accelerators are poised to significantly boost the PET bottles made from recycled materials industry. Technological breakthroughs in sorting and purification of post-consumer PET are continuously improving the quality and availability of rPET, making it a more viable option for a wider range of applications. Strategic partnerships and collaborations between resin producers, brand owners, and waste management companies are crucial for building robust and efficient recycling ecosystems. Market expansion into new geographical regions, particularly those with nascent recycling infrastructure but growing demand, will be a key accelerator. Furthermore, government incentives, such as tax breaks and subsidies for using recycled content, play a vital role in driving investment and adoption. The increasing pressure from investors and financial institutions to adopt ESG (Environmental, Social, and Governance) principles is also a significant accelerator, pushing companies to invest in sustainable packaging solutions.
Key Players Shaping the PET Bottles Made from Recycled Materials Market
- The Coca-Cola Company
- Water To Go
- Bottle Promotions
- Berry Global
- Suntory
- Eurobottle
- Bottle Up
- Raepak
- Kaufman Container
- VeganBottle
- Pretium Packaging
- Fortis X
- IDEALPAK
- Urtekram
Notable Milestones in PET Bottles Made from Recycled Materials Sector
- 2019: Major beverage companies announce ambitious targets for increasing recycled content in their plastic bottles.
- 2020: Significant advancements in chemical recycling technologies are showcased, promising enhanced rPET quality.
- 2021: European Union implements stricter targets for minimum recycled content in PET beverage bottles.
- 2022: Increased M&A activity as larger players acquire or partner with rPET producers to secure supply chains.
- 2023: Launch of new product lines featuring 100% rPET by several leading consumer brands.
- 2024: Growing focus on traceability and transparency in the rPET supply chain through blockchain technology.
In-Depth PET Bottles Made from Recycled Materials Market Outlook
The future outlook for the PET bottles made from recycled materials market is exceptionally promising, driven by a powerful synergy of regulatory mandates, evolving consumer consciousness, and continuous technological innovation. Growth accelerators such as enhanced chemical recycling, strategic vertical integrations within the supply chain, and expansion into emerging economies will significantly propel market expansion. Companies that prioritize investing in advanced recycling infrastructure, securing sustainable feedstock, and transparently communicating their recycled content initiatives are poised to gain a substantial competitive advantage. The market is expected to transition towards a more circular model, with rPET becoming the de facto standard for plastic beverage packaging, creating substantial opportunities for stakeholders across the value chain.
PET Bottles Made from Recycled Materials Segmentation
-
1. Application
- 1.1. Sports Bottles
- 1.2. Food and Beverages
- 1.3. Cosmetics
- 1.4. Others
-
2. Types
- 2.1. Less than 50 ml
- 2.2. 51 ml to 100 ml
- 2.3. 100 ml to 250 ml
- 2.4. More than 250 ml
PET Bottles Made from Recycled Materials Segmentation By Geography
-
1. North America
- 1.1. United States
- 1.2. Canada
- 1.3. Mexico
-
2. South America
- 2.1. Brazil
- 2.2. Argentina
- 2.3. Rest of South America
-
3. Europe
- 3.1. United Kingdom
- 3.2. Germany
- 3.3. France
- 3.4. Italy
- 3.5. Spain
- 3.6. Russia
- 3.7. Benelux
- 3.8. Nordics
- 3.9. Rest of Europe
-
4. Middle East & Africa
- 4.1. Turkey
- 4.2. Israel
- 4.3. GCC
- 4.4. North Africa
- 4.5. South Africa
- 4.6. Rest of Middle East & Africa
-
5. Asia Pacific
- 5.1. China
- 5.2. India
- 5.3. Japan
- 5.4. South Korea
- 5.5. ASEAN
- 5.6. Oceania
- 5.7. Rest of Asia Pacific
PET Bottles Made from Recycled Materials Regional Market Share
Geographic Coverage of PET Bottles Made from Recycled Materials
PET Bottles Made from Recycled Materials REPORT HIGHLIGHTS
| Aspects | Details |
|---|---|
| Study Period | 2020-2034 |
| Base Year | 2025 |
| Estimated Year | 2026 |
| Forecast Period | 2026-2034 |
| Historical Period | 2020-2025 |
| Growth Rate | CAGR of 9.74% from 2020-2034 |
| Segmentation |
|
Table of Contents
- 1. Introduction
- 1.1. Research Scope
- 1.2. Market Segmentation
- 1.3. Research Objective
- 1.4. Definitions and Assumptions
- 2. Executive Summary
- 2.1. Market Snapshot
- 3. Market Dynamics
- 3.1. Market Drivers
- 3.2. Market Restrains
- 3.3. Market Trends
- 3.4. Market Opportunities
- 4. Market Factor Analysis
- 4.1. Porters Five Forces
- 4.1.1. Bargaining Power of Suppliers
- 4.1.2. Bargaining Power of Buyers
- 4.1.3. Threat of New Entrants
- 4.1.4. Threat of Substitutes
- 4.1.5. Competitive Rivalry
- 4.2. PESTEL analysis
- 4.3. BCG Analysis
- 4.3.1. Stars (High Growth, High Market Share)
- 4.3.2. Cash Cows (Low Growth, High Market Share)
- 4.3.3. Question Mark (High Growth, Low Market Share)
- 4.3.4. Dogs (Low Growth, Low Market Share)
- 4.4. Ansoff Matrix Analysis
- 4.5. Supply Chain Analysis
- 4.6. Regulatory Landscape
- 4.7. Current Market Potential and Opportunity Assessment (TAM–SAM–SOM Framework)
- 4.8. VDR Analyst Note
- 4.1. Porters Five Forces
- 5. Market Analysis, Insights and Forecast 2021-2033
- 5.1. Market Analysis, Insights and Forecast - by Application
- 5.1.1. Sports Bottles
- 5.1.2. Food and Beverages
- 5.1.3. Cosmetics
- 5.1.4. Others
- 5.2. Market Analysis, Insights and Forecast - by Types
- 5.2.1. Less than 50 ml
- 5.2.2. 51 ml to 100 ml
- 5.2.3. 100 ml to 250 ml
- 5.2.4. More than 250 ml
- 5.3. Market Analysis, Insights and Forecast - by Region
- 5.3.1. North America
- 5.3.2. South America
- 5.3.3. Europe
- 5.3.4. Middle East & Africa
- 5.3.5. Asia Pacific
- 5.1. Market Analysis, Insights and Forecast - by Application
- 6. Global PET Bottles Made from Recycled Materials Analysis, Insights and Forecast, 2021-2033
- 6.1. Market Analysis, Insights and Forecast - by Application
- 6.1.1. Sports Bottles
- 6.1.2. Food and Beverages
- 6.1.3. Cosmetics
- 6.1.4. Others
- 6.2. Market Analysis, Insights and Forecast - by Types
- 6.2.1. Less than 50 ml
- 6.2.2. 51 ml to 100 ml
- 6.2.3. 100 ml to 250 ml
- 6.2.4. More than 250 ml
- 6.1. Market Analysis, Insights and Forecast - by Application
- 7. North America PET Bottles Made from Recycled Materials Analysis, Insights and Forecast, 2021-2033
- 7.1. Market Analysis, Insights and Forecast - by Application
- 7.1.1. Sports Bottles
- 7.1.2. Food and Beverages
- 7.1.3. Cosmetics
- 7.1.4. Others
- 7.2. Market Analysis, Insights and Forecast - by Types
- 7.2.1. Less than 50 ml
- 7.2.2. 51 ml to 100 ml
- 7.2.3. 100 ml to 250 ml
- 7.2.4. More than 250 ml
- 7.1. Market Analysis, Insights and Forecast - by Application
- 8. South America PET Bottles Made from Recycled Materials Analysis, Insights and Forecast, 2021-2033
- 8.1. Market Analysis, Insights and Forecast - by Application
- 8.1.1. Sports Bottles
- 8.1.2. Food and Beverages
- 8.1.3. Cosmetics
- 8.1.4. Others
- 8.2. Market Analysis, Insights and Forecast - by Types
- 8.2.1. Less than 50 ml
- 8.2.2. 51 ml to 100 ml
- 8.2.3. 100 ml to 250 ml
- 8.2.4. More than 250 ml
- 8.1. Market Analysis, Insights and Forecast - by Application
- 9. Europe PET Bottles Made from Recycled Materials Analysis, Insights and Forecast, 2021-2033
- 9.1. Market Analysis, Insights and Forecast - by Application
- 9.1.1. Sports Bottles
- 9.1.2. Food and Beverages
- 9.1.3. Cosmetics
- 9.1.4. Others
- 9.2. Market Analysis, Insights and Forecast - by Types
- 9.2.1. Less than 50 ml
- 9.2.2. 51 ml to 100 ml
- 9.2.3. 100 ml to 250 ml
- 9.2.4. More than 250 ml
- 9.1. Market Analysis, Insights and Forecast - by Application
- 10. Middle East & Africa PET Bottles Made from Recycled Materials Analysis, Insights and Forecast, 2021-2033
- 10.1. Market Analysis, Insights and Forecast - by Application
- 10.1.1. Sports Bottles
- 10.1.2. Food and Beverages
- 10.1.3. Cosmetics
- 10.1.4. Others
- 10.2. Market Analysis, Insights and Forecast - by Types
- 10.2.1. Less than 50 ml
- 10.2.2. 51 ml to 100 ml
- 10.2.3. 100 ml to 250 ml
- 10.2.4. More than 250 ml
- 10.1. Market Analysis, Insights and Forecast - by Application
- 11. Asia Pacific PET Bottles Made from Recycled Materials Analysis, Insights and Forecast, 2021-2033
- 11.1. Market Analysis, Insights and Forecast - by Application
- 11.1.1. Sports Bottles
- 11.1.2. Food and Beverages
- 11.1.3. Cosmetics
- 11.1.4. Others
- 11.2. Market Analysis, Insights and Forecast - by Types
- 11.2.1. Less than 50 ml
- 11.2.2. 51 ml to 100 ml
- 11.2.3. 100 ml to 250 ml
- 11.2.4. More than 250 ml
- 11.1. Market Analysis, Insights and Forecast - by Application
- 12. Competitive Analysis
- 12.1. Company Profiles
- 12.1.1 The Coca-Cola Company
- 12.1.1.1. Company Overview
- 12.1.1.2. Products
- 12.1.1.3. Company Financials
- 12.1.1.4. SWOT Analysis
- 12.1.2 Water To Go
- 12.1.2.1. Company Overview
- 12.1.2.2. Products
- 12.1.2.3. Company Financials
- 12.1.2.4. SWOT Analysis
- 12.1.3 Bottle Promotions
- 12.1.3.1. Company Overview
- 12.1.3.2. Products
- 12.1.3.3. Company Financials
- 12.1.3.4. SWOT Analysis
- 12.1.4 Berry Global
- 12.1.4.1. Company Overview
- 12.1.4.2. Products
- 12.1.4.3. Company Financials
- 12.1.4.4. SWOT Analysis
- 12.1.5 Suntory
- 12.1.5.1. Company Overview
- 12.1.5.2. Products
- 12.1.5.3. Company Financials
- 12.1.5.4. SWOT Analysis
- 12.1.6 Eurobottle
- 12.1.6.1. Company Overview
- 12.1.6.2. Products
- 12.1.6.3. Company Financials
- 12.1.6.4. SWOT Analysis
- 12.1.7 Bottle Up
- 12.1.7.1. Company Overview
- 12.1.7.2. Products
- 12.1.7.3. Company Financials
- 12.1.7.4. SWOT Analysis
- 12.1.8 Raepak
- 12.1.8.1. Company Overview
- 12.1.8.2. Products
- 12.1.8.3. Company Financials
- 12.1.8.4. SWOT Analysis
- 12.1.9 Kaufman Container
- 12.1.9.1. Company Overview
- 12.1.9.2. Products
- 12.1.9.3. Company Financials
- 12.1.9.4. SWOT Analysis
- 12.1.10 VeganBottle
- 12.1.10.1. Company Overview
- 12.1.10.2. Products
- 12.1.10.3. Company Financials
- 12.1.10.4. SWOT Analysis
- 12.1.11 Pretium Packaging
- 12.1.11.1. Company Overview
- 12.1.11.2. Products
- 12.1.11.3. Company Financials
- 12.1.11.4. SWOT Analysis
- 12.1.12 Fortis X
- 12.1.12.1. Company Overview
- 12.1.12.2. Products
- 12.1.12.3. Company Financials
- 12.1.12.4. SWOT Analysis
- 12.1.13 IDEALPAK
- 12.1.13.1. Company Overview
- 12.1.13.2. Products
- 12.1.13.3. Company Financials
- 12.1.13.4. SWOT Analysis
- 12.1.14 Urtekram
- 12.1.14.1. Company Overview
- 12.1.14.2. Products
- 12.1.14.3. Company Financials
- 12.1.14.4. SWOT Analysis
- 12.1.1 The Coca-Cola Company
- 12.2. Market Entropy
- 12.2.1 Company's Key Areas Served
- 12.2.2 Recent Developments
- 12.3. Company Market Share Analysis 2025
- 12.3.1 Top 5 Companies Market Share Analysis
- 12.3.2 Top 3 Companies Market Share Analysis
- 12.4. List of Potential Customers
- 13. Research Methodology
List of Figures
- Figure 1: Global PET Bottles Made from Recycled Materials Revenue Breakdown (billion, %) by Region 2025 & 2033
- Figure 2: North America PET Bottles Made from Recycled Materials Revenue (billion), by Application 2025 & 2033
- Figure 3: North America PET Bottles Made from Recycled Materials Revenue Share (%), by Application 2025 & 2033
- Figure 4: North America PET Bottles Made from Recycled Materials Revenue (billion), by Types 2025 & 2033
- Figure 5: North America PET Bottles Made from Recycled Materials Revenue Share (%), by Types 2025 & 2033
- Figure 6: North America PET Bottles Made from Recycled Materials Revenue (billion), by Country 2025 & 2033
- Figure 7: North America PET Bottles Made from Recycled Materials Revenue Share (%), by Country 2025 & 2033
- Figure 8: South America PET Bottles Made from Recycled Materials Revenue (billion), by Application 2025 & 2033
- Figure 9: South America PET Bottles Made from Recycled Materials Revenue Share (%), by Application 2025 & 2033
- Figure 10: South America PET Bottles Made from Recycled Materials Revenue (billion), by Types 2025 & 2033
- Figure 11: South America PET Bottles Made from Recycled Materials Revenue Share (%), by Types 2025 & 2033
- Figure 12: South America PET Bottles Made from Recycled Materials Revenue (billion), by Country 2025 & 2033
- Figure 13: South America PET Bottles Made from Recycled Materials Revenue Share (%), by Country 2025 & 2033
- Figure 14: Europe PET Bottles Made from Recycled Materials Revenue (billion), by Application 2025 & 2033
- Figure 15: Europe PET Bottles Made from Recycled Materials Revenue Share (%), by Application 2025 & 2033
- Figure 16: Europe PET Bottles Made from Recycled Materials Revenue (billion), by Types 2025 & 2033
- Figure 17: Europe PET Bottles Made from Recycled Materials Revenue Share (%), by Types 2025 & 2033
- Figure 18: Europe PET Bottles Made from Recycled Materials Revenue (billion), by Country 2025 & 2033
- Figure 19: Europe PET Bottles Made from Recycled Materials Revenue Share (%), by Country 2025 & 2033
- Figure 20: Middle East & Africa PET Bottles Made from Recycled Materials Revenue (billion), by Application 2025 & 2033
- Figure 21: Middle East & Africa PET Bottles Made from Recycled Materials Revenue Share (%), by Application 2025 & 2033
- Figure 22: Middle East & Africa PET Bottles Made from Recycled Materials Revenue (billion), by Types 2025 & 2033
- Figure 23: Middle East & Africa PET Bottles Made from Recycled Materials Revenue Share (%), by Types 2025 & 2033
- Figure 24: Middle East & Africa PET Bottles Made from Recycled Materials Revenue (billion), by Country 2025 & 2033
- Figure 25: Middle East & Africa PET Bottles Made from Recycled Materials Revenue Share (%), by Country 2025 & 2033
- Figure 26: Asia Pacific PET Bottles Made from Recycled Materials Revenue (billion), by Application 2025 & 2033
- Figure 27: Asia Pacific PET Bottles Made from Recycled Materials Revenue Share (%), by Application 2025 & 2033
- Figure 28: Asia Pacific PET Bottles Made from Recycled Materials Revenue (billion), by Types 2025 & 2033
- Figure 29: Asia Pacific PET Bottles Made from Recycled Materials Revenue Share (%), by Types 2025 & 2033
- Figure 30: Asia Pacific PET Bottles Made from Recycled Materials Revenue (billion), by Country 2025 & 2033
- Figure 31: Asia Pacific PET Bottles Made from Recycled Materials Revenue Share (%), by Country 2025 & 2033
List of Tables
- Table 1: Global PET Bottles Made from Recycled Materials Revenue billion Forecast, by Application 2020 & 2033
- Table 2: Global PET Bottles Made from Recycled Materials Revenue billion Forecast, by Types 2020 & 2033
- Table 3: Global PET Bottles Made from Recycled Materials Revenue billion Forecast, by Region 2020 & 2033
- Table 4: Global PET Bottles Made from Recycled Materials Revenue billion Forecast, by Application 2020 & 2033
- Table 5: Global PET Bottles Made from Recycled Materials Revenue billion Forecast, by Types 2020 & 2033
- Table 6: Global PET Bottles Made from Recycled Materials Revenue billion Forecast, by Country 2020 & 2033
- Table 7: United States PET Bottles Made from Recycled Materials Revenue (billion) Forecast, by Application 2020 & 2033
- Table 8: Canada PET Bottles Made from Recycled Materials Revenue (billion) Forecast, by Application 2020 & 2033
- Table 9: Mexico PET Bottles Made from Recycled Materials Revenue (billion) Forecast, by Application 2020 & 2033
- Table 10: Global PET Bottles Made from Recycled Materials Revenue billion Forecast, by Application 2020 & 2033
- Table 11: Global PET Bottles Made from Recycled Materials Revenue billion Forecast, by Types 2020 & 2033
- Table 12: Global PET Bottles Made from Recycled Materials Revenue billion Forecast, by Country 2020 & 2033
- Table 13: Brazil PET Bottles Made from Recycled Materials Revenue (billion) Forecast, by Application 2020 & 2033
- Table 14: Argentina PET Bottles Made from Recycled Materials Revenue (billion) Forecast, by Application 2020 & 2033
- Table 15: Rest of South America PET Bottles Made from Recycled Materials Revenue (billion) Forecast, by Application 2020 & 2033
- Table 16: Global PET Bottles Made from Recycled Materials Revenue billion Forecast, by Application 2020 & 2033
- Table 17: Global PET Bottles Made from Recycled Materials Revenue billion Forecast, by Types 2020 & 2033
- Table 18: Global PET Bottles Made from Recycled Materials Revenue billion Forecast, by Country 2020 & 2033
- Table 19: United Kingdom PET Bottles Made from Recycled Materials Revenue (billion) Forecast, by Application 2020 & 2033
- Table 20: Germany PET Bottles Made from Recycled Materials Revenue (billion) Forecast, by Application 2020 & 2033
- Table 21: France PET Bottles Made from Recycled Materials Revenue (billion) Forecast, by Application 2020 & 2033
- Table 22: Italy PET Bottles Made from Recycled Materials Revenue (billion) Forecast, by Application 2020 & 2033
- Table 23: Spain PET Bottles Made from Recycled Materials Revenue (billion) Forecast, by Application 2020 & 2033
- Table 24: Russia PET Bottles Made from Recycled Materials Revenue (billion) Forecast, by Application 2020 & 2033
- Table 25: Benelux PET Bottles Made from Recycled Materials Revenue (billion) Forecast, by Application 2020 & 2033
- Table 26: Nordics PET Bottles Made from Recycled Materials Revenue (billion) Forecast, by Application 2020 & 2033
- Table 27: Rest of Europe PET Bottles Made from Recycled Materials Revenue (billion) Forecast, by Application 2020 & 2033
- Table 28: Global PET Bottles Made from Recycled Materials Revenue billion Forecast, by Application 2020 & 2033
- Table 29: Global PET Bottles Made from Recycled Materials Revenue billion Forecast, by Types 2020 & 2033
- Table 30: Global PET Bottles Made from Recycled Materials Revenue billion Forecast, by Country 2020 & 2033
- Table 31: Turkey PET Bottles Made from Recycled Materials Revenue (billion) Forecast, by Application 2020 & 2033
- Table 32: Israel PET Bottles Made from Recycled Materials Revenue (billion) Forecast, by Application 2020 & 2033
- Table 33: GCC PET Bottles Made from Recycled Materials Revenue (billion) Forecast, by Application 2020 & 2033
- Table 34: North Africa PET Bottles Made from Recycled Materials Revenue (billion) Forecast, by Application 2020 & 2033
- Table 35: South Africa PET Bottles Made from Recycled Materials Revenue (billion) Forecast, by Application 2020 & 2033
- Table 36: Rest of Middle East & Africa PET Bottles Made from Recycled Materials Revenue (billion) Forecast, by Application 2020 & 2033
- Table 37: Global PET Bottles Made from Recycled Materials Revenue billion Forecast, by Application 2020 & 2033
- Table 38: Global PET Bottles Made from Recycled Materials Revenue billion Forecast, by Types 2020 & 2033
- Table 39: Global PET Bottles Made from Recycled Materials Revenue billion Forecast, by Country 2020 & 2033
- Table 40: China PET Bottles Made from Recycled Materials Revenue (billion) Forecast, by Application 2020 & 2033
- Table 41: India PET Bottles Made from Recycled Materials Revenue (billion) Forecast, by Application 2020 & 2033
- Table 42: Japan PET Bottles Made from Recycled Materials Revenue (billion) Forecast, by Application 2020 & 2033
- Table 43: South Korea PET Bottles Made from Recycled Materials Revenue (billion) Forecast, by Application 2020 & 2033
- Table 44: ASEAN PET Bottles Made from Recycled Materials Revenue (billion) Forecast, by Application 2020 & 2033
- Table 45: Oceania PET Bottles Made from Recycled Materials Revenue (billion) Forecast, by Application 2020 & 2033
- Table 46: Rest of Asia Pacific PET Bottles Made from Recycled Materials Revenue (billion) Forecast, by Application 2020 & 2033
Frequently Asked Questions
1. What is the projected Compound Annual Growth Rate (CAGR) of the PET Bottles Made from Recycled Materials?
The projected CAGR is approximately 9.74%.
2. Which companies are prominent players in the PET Bottles Made from Recycled Materials?
Key companies in the market include The Coca-Cola Company, Water To Go, Bottle Promotions, Berry Global, Suntory, Eurobottle, Bottle Up, Raepak, Kaufman Container, VeganBottle, Pretium Packaging, Fortis X, IDEALPAK, Urtekram.
3. What are the main segments of the PET Bottles Made from Recycled Materials?
The market segments include Application, Types.
4. Can you provide details about the market size?
The market size is estimated to be USD 2.67 billion as of 2022.
5. What are some drivers contributing to market growth?
N/A
6. What are the notable trends driving market growth?
N/A
7. Are there any restraints impacting market growth?
N/A
8. Can you provide examples of recent developments in the market?
N/A
9. What pricing options are available for accessing the report?
Pricing options include single-user, multi-user, and enterprise licenses priced at USD 2900.00, USD 4350.00, and USD 5800.00 respectively.
10. Is the market size provided in terms of value or volume?
The market size is provided in terms of value, measured in billion.
11. Are there any specific market keywords associated with the report?
Yes, the market keyword associated with the report is "PET Bottles Made from Recycled Materials," which aids in identifying and referencing the specific market segment covered.
12. How do I determine which pricing option suits my needs best?
The pricing options vary based on user requirements and access needs. Individual users may opt for single-user licenses, while businesses requiring broader access may choose multi-user or enterprise licenses for cost-effective access to the report.
13. Are there any additional resources or data provided in the PET Bottles Made from Recycled Materials report?
While the report offers comprehensive insights, it's advisable to review the specific contents or supplementary materials provided to ascertain if additional resources or data are available.
14. How can I stay updated on further developments or reports in the PET Bottles Made from Recycled Materials?
To stay informed about further developments, trends, and reports in the PET Bottles Made from Recycled Materials, consider subscribing to industry newsletters, following relevant companies and organizations, or regularly checking reputable industry news sources and publications.
Methodology
Step 1 - Identification of Relevant Samples Size from Population Database


Step 2 - Approaches for Defining Global Market Size (Value, Volume* & Price*)

Note*: In applicable scenarios
Step 3 - Data Sources
Primary Research
- Web Analytics
- Survey Reports
- Research Institute
- Latest Research Reports
- Opinion Leaders
Secondary Research
- Annual Reports
- White Paper
- Latest Press Release
- Industry Association
- Paid Database
- Investor Presentations

Step 4 - Data Triangulation
Involves using different sources of information in order to increase the validity of a study
These sources are likely to be stakeholders in a program - participants, other researchers, program staff, other community members, and so on.
Then we put all data in single framework & apply various statistical tools to find out the dynamic on the market.
During the analysis stage, feedback from the stakeholder groups would be compared to determine areas of agreement as well as areas of divergence