
Key Insights
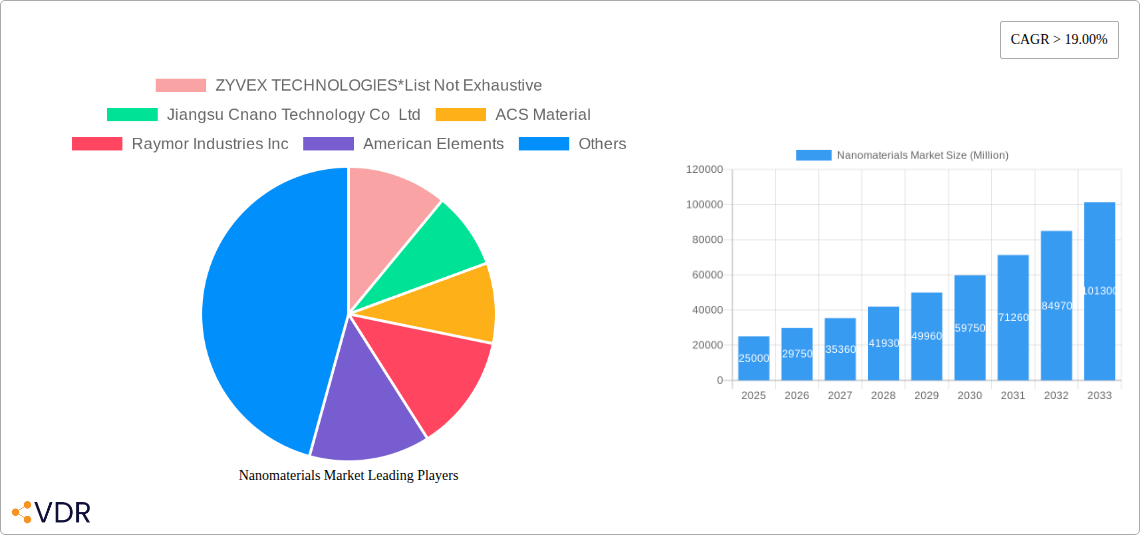
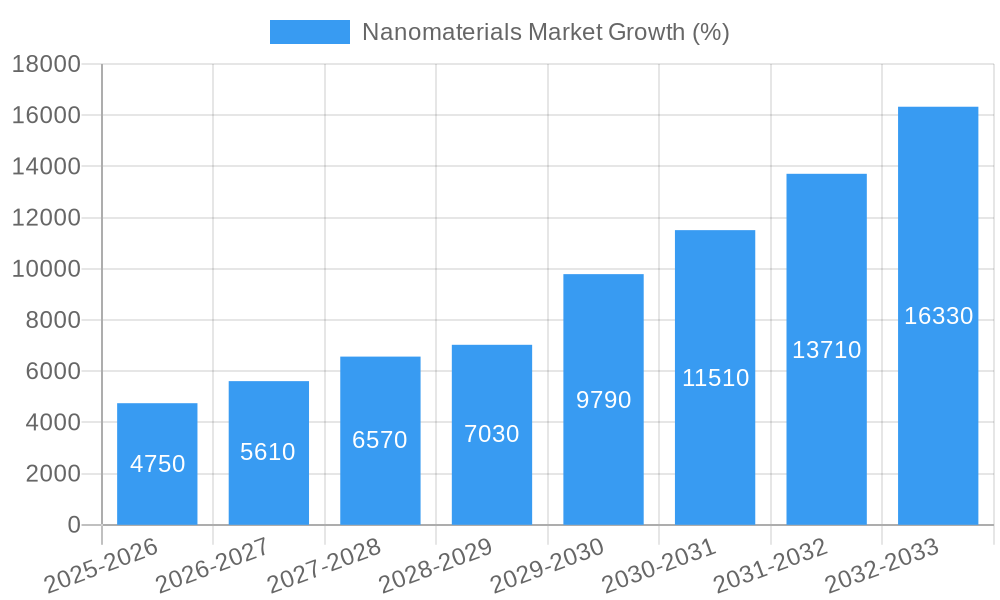
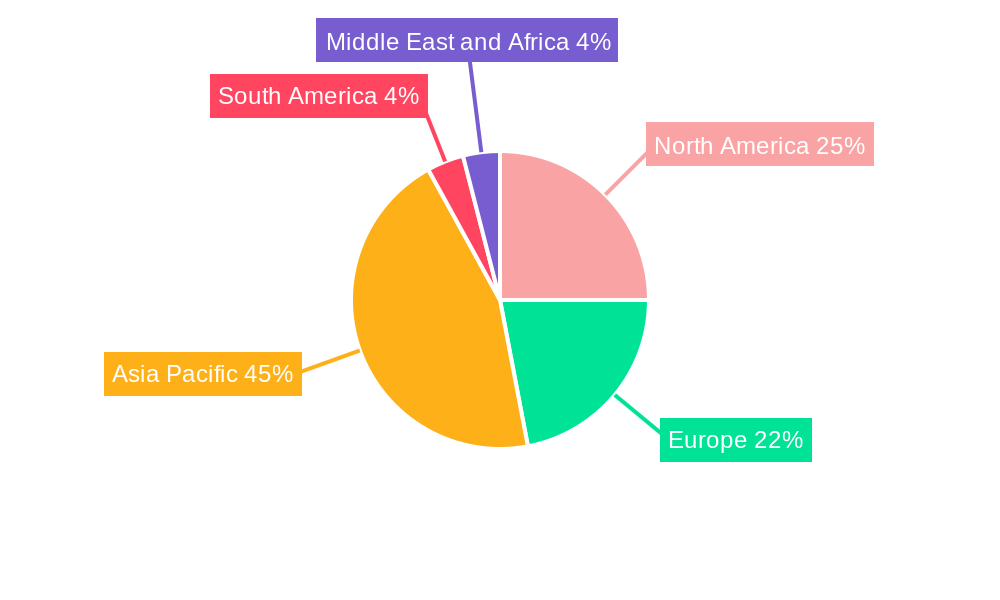
The nanomaterials market is experiencing robust growth, projected to maintain a Compound Annual Growth Rate (CAGR) exceeding 19% from 2025 to 2033. This expansion is driven by increasing demand across diverse sectors, including construction (for enhanced materials), electronics (for miniaturization and improved performance), energy (in battery technology and solar cells), healthcare (in drug delivery and diagnostics), and personal care (in cosmetics and sunscreens). Technological advancements leading to the development of novel nanomaterials with superior properties—like increased strength, conductivity, and biocompatibility—further fuel market growth. The market segmentation reveals significant potential within various product types, such as nanoparticles (metals and non-metal oxides), nanofibers, nanotubes, and nanoclays, each catering to specific applications. Significant regional variations exist, with Asia Pacific, particularly China and India, expected to dominate due to their substantial manufacturing bases and burgeoning technological advancements. The North American and European markets also contribute significantly, driven by robust research and development activities and high adoption rates in advanced technologies.
Market restraints include the relatively high cost of nanomaterial production and processing, along with concerns regarding their potential environmental and health impacts. However, ongoing research into cost-effective manufacturing techniques and rigorous safety protocols are actively mitigating these challenges. The competitive landscape is characterized by a mix of established chemical companies, specialized nanomaterial producers, and emerging startups. This dynamic environment fosters innovation and competition, ultimately benefiting consumers and driving further market expansion. The forecast period (2025-2033) presents significant opportunities for industry players to capitalize on the growing demand for innovative nanomaterials, particularly those catering to the burgeoning needs of high-growth sectors. Strategic partnerships, investments in research and development, and focused expansion into emerging markets are expected to be key drivers of success within the nanomaterials sector.
Nanomaterials Market: A Comprehensive Report (2019-2033)
This comprehensive report provides a detailed analysis of the global nanomaterials market, encompassing its dynamics, growth trends, dominant segments, product landscape, key players, and future outlook. The study period covers 2019-2033, with 2025 as the base and estimated year. The report offers valuable insights for industry professionals, investors, and researchers seeking to understand and capitalize on the growth opportunities within this rapidly evolving market. Market values are presented in million units.
Nanomaterials Market Dynamics & Structure
The nanomaterials market is characterized by a moderately concentrated structure, with several key players holding significant market share. Technological innovation is a primary driver, pushing the boundaries of material science and enabling novel applications across diverse sectors. Stringent regulatory frameworks governing the production and use of nanomaterials are shaping industry practices and demanding compliance. The market also faces competition from alternative materials, although the unique properties of nanomaterials frequently provide a competitive edge. End-user demographics are diverse, ranging from large multinational corporations to smaller specialized firms. Mergers and acquisitions (M&A) activity is moderate, reflecting a dynamic landscape of consolidation and strategic partnerships.
- Market Concentration: Moderately concentrated, with top 5 players holding approximately xx% market share in 2025.
- Technological Innovation: Significant investments in R&D driving the development of advanced nanomaterials with improved performance and functionalities.
- Regulatory Framework: Stringent regulations regarding safety and environmental impact are increasing, influencing production and application.
- Competitive Substitutes: Traditional materials pose competition, but nanomaterials offer unique properties often outweighing the cost differential.
- M&A Activity: An estimated xx M&A deals in the nanomaterials sector between 2019-2024, indicating moderate consolidation.
Nanomaterials Market Growth Trends & Insights
The global nanomaterials market exhibits robust growth, driven by increasing demand across various end-use sectors. Market size is projected to reach xx million units by 2033, exhibiting a CAGR of xx% during the forecast period (2025-2033). Technological disruptions are accelerating adoption rates, particularly in electronics and healthcare, while shifting consumer preferences towards sustainable and high-performance products are fostering market expansion. This expansion is further fuelled by increasing investments in R&D and collaborations across the value chain. Specific application segments like advanced batteries and high-performance composites are witnessing exponential growth.
- Market Size (2025): xx million units
- Market Size (2033): xx million units
- CAGR (2025-2033): xx%
- Market Penetration: Increasing penetration in various sectors, with electronics and healthcare showing the highest adoption rates.
Dominant Regions, Countries, or Segments in Nanomaterials Market
North America and Asia-Pacific currently dominate the nanomaterials market, driven by strong technological advancements, robust industrial infrastructure, and significant investments in research and development. Within end-user industries, the electronics sector holds a significant share, primarily due to the widespread use of nanomaterials in semiconductors, displays, and flexible electronics. The healthcare segment is also a major growth driver, driven by the application of nanomaterials in drug delivery, diagnostics, and medical implants. Amongst product types, Nanoparticles and Carbon Nanotubes demonstrate strong market presence due to their diverse applications.
- Leading Region: North America and Asia-Pacific
- Leading End-user Industry: Electronics and Healthcare
- Leading Product Type: Nanoparticles and Carbon Nanotubes
- Key Drivers: Strong technological advancements, government support, and expanding applications across diverse industries.
Nanomaterials Market Product Landscape
The nanomaterials market offers a diverse range of products, including nanoparticles, nanofibers, nanotubes, nanoclays, and nanowires. These materials are engineered with specific properties for different applications, such as enhanced strength, conductivity, and biocompatibility. Continuous innovation is resulting in the development of new materials with improved performance metrics, tailored functionalities, and cost-effectiveness. The unique selling propositions of these materials include their superior strength-to-weight ratio, enhanced thermal and electrical conductivity, and targeted drug delivery capabilities.
Key Drivers, Barriers & Challenges in Nanomaterials Market
Key Drivers: Technological advancements are pushing the boundaries of material science, enabling the development of novel nanomaterials with enhanced performance. Increased demand from various sectors like electronics, healthcare, and energy is fueling market growth. Supportive government policies and initiatives promoting innovation are further accelerating the market.
Key Challenges: High production costs, stringent regulations related to safety and environmental concerns, and the potential for toxicity pose significant challenges. The lack of standardization and consistent quality control across the industry can also hinder market growth. Supply chain disruptions and volatility in raw material prices further complicate the market dynamics.
Emerging Opportunities in Nanomaterials Market
The nanomaterials market presents several emerging opportunities. Untapped markets in developing economies offer significant growth potential. Innovative applications are emerging in areas like flexible electronics, biomedicine, and sustainable energy solutions. The growing demand for eco-friendly and sustainable materials is opening new avenues for the development and application of bio-based nanomaterials.
Growth Accelerators in the Nanomaterials Market Industry
Technological breakthroughs in synthesis techniques, characterization methods, and application development are accelerating market growth. Strategic partnerships between material scientists, manufacturers, and end-users are fostering innovation and streamlining the commercialization process. Government support and funding of R&D initiatives are encouraging the development and adoption of advanced nanomaterials. Expansion into new markets, diversification of product offerings, and focusing on customer needs will further propel the market.
Key Players Shaping the Nanomaterials Market Market
- ZYVEX TECHNOLOGIES
- Jiangsu Cnano Technology Co Ltd
- ACS Material
- Raymor Industries Inc
- American Elements
- Cabot Corporation
- Nanophase Technologies Corporation
- BASF SE
- Nanocyl SA
- Arkema Group
- LG Chem
- Nano-C
- Chengdu Organic Chemicals Co Ltd (Timesnano)
- CHASM Advanced Materials Inc
- SHOWA DENKO K K
- OCSiAl
Notable Milestones in Nanomaterials Market Sector
- November 2022: American Elements launched a novel nanoscale electrolyte material for lithium-ion batteries.
- March 2021: Cabot Corporation announced the launch of its ENERMAX 6 carbon nanotube series.
In-Depth Nanomaterials Market Market Outlook
The nanomaterials market is poised for significant growth, driven by ongoing technological advancements, increasing demand from various sectors, and supportive government policies. The market is expected to experience a period of robust expansion, presenting considerable opportunities for innovation, strategic partnerships, and market penetration. Strategic investments in R&D, focus on sustainable practices, and the exploration of novel applications will define the success of players in this dynamic landscape.
Nanomaterials Market Segmentation
-
1. Product Type
-
1.1. Nanoparticles
-
1.1.1. Nanometals
- 1.1.1.1. Gold
- 1.1.1.2. Silver
- 1.1.1.3. Platinum
- 1.1.1.4. Titanium
- 1.1.1.5. Aluminium
-
1.1.2. Nonmetal Oxides
- 1.1.2.1. Alumina
- 1.1.2.2. Iron Oxide
- 1.1.2.3. Titanium Oxide
- 1.1.2.4. Silica
- 1.1.2.5. Zinc Oxide
-
1.1.3. Complex Oxides
- 1.1.3.1. Calcium Phosphate
- 1.1.3.2. Rare Earth Metal Oxides
- 1.1.3.3. Lithium Titanate
- 1.1.3.4. Silica Hydride
-
1.1.1. Nanometals
- 1.2. Nanofibers
- 1.3. Nanotubes
- 1.4. Nanoclays
- 1.5. Nanowires
-
1.1. Nanoparticles
-
2. Structure Type
-
2.1. Non-polymer Organic Nanomaterials
- 2.1.1. Carbon Black
- 2.1.2. Carbon Nanotubes
- 2.1.3. Aptamers
- 2.1.4. Small Molecule OLED
- 2.1.5. Activated Carbon
- 2.1.6. Carbon Nanotubes Composites
-
2.2. Polymeric Nanomaterials
- 2.2.1. Coatings and Adhesives
- 2.2.2. Transfection Reagents
- 2.2.3. Diagnostics Reagents
- 2.2.4. Drug Delivery Vehicle
- 2.2.5. Fabric Treatments
- 2.2.6. Optical Coatings
- 2.2.7. Nano-porous Filtration Membrane
- 2.2.8. Di-electric Films
- 2.2.9. OLED Films
-
2.1. Non-polymer Organic Nanomaterials
-
3. End-user Industry
- 3.1. Construction
- 3.2. Electronics
- 3.3. Energy
- 3.4. Healthcare
- 3.5. Personal Care
- 3.6. Rubber
- 3.7. Other End-user Industries
Nanomaterials Market Segmentation By Geography
-
1. Asia Pacific
- 1.1. China
- 1.2. India
- 1.3. Japan
- 1.4. South Korea
- 1.5. ASEAN Countries
- 1.6. Rest of Asia Pacific
-
2. North America
- 2.1. United States
- 2.2. Canada
- 2.3. Mexico
-
3. Europe
- 3.1. Germany
- 3.2. United Kingdom
- 3.3. Italy
- 3.4. France
- 3.5. Rest of Europe
-
4. South America
- 4.1. Brazil
- 4.2. Argentina
- 4.3. Rest of South America
-
5. Middle East and Africa
- 5.1. Saudi Arabia
- 5.2. South Africa
- 5.3. Rest of Middle East and Africa
Nanomaterials Market REPORT HIGHLIGHTS
| Aspects | Details |
|---|---|
| Study Period | 2019-2033 |
| Base Year | 2024 |
| Estimated Year | 2025 |
| Forecast Period | 2025-2033 |
| Historical Period | 2019-2024 |
| Growth Rate | CAGR of > 19.00% from 2019-2033 |
| Segmentation |
|
Table of Contents
- 1. Introduction
- 1.1. Research Scope
- 1.2. Market Segmentation
- 1.3. Research Methodology
- 1.4. Definitions and Assumptions
- 2. Executive Summary
- 2.1. Introduction
- 3. Market Dynamics
- 3.1. Introduction
- 3.2. Market Drivers
- 3.2.1. Growing Usage of Nanomedicines in the Healthcare Industry; Increasing Usage of Nanomaterials in Water Treatment Applications
- 3.3. Market Restrains
- 3.3.1. Higher Costs of Technology
- 3.4. Market Trends
- 3.4.1. The Electrical and Electronics Segment to Dominate the Market
- 4. Market Factor Analysis
- 4.1. Porters Five Forces
- 4.2. Supply/Value Chain
- 4.3. PESTEL analysis
- 4.4. Market Entropy
- 4.5. Patent/Trademark Analysis
- 5. Global Nanomaterials Market Analysis, Insights and Forecast, 2019-2031
- 5.1. Market Analysis, Insights and Forecast - by Product Type
- 5.1.1. Nanoparticles
- 5.1.1.1. Nanometals
- 5.1.1.1.1. Gold
- 5.1.1.1.2. Silver
- 5.1.1.1.3. Platinum
- 5.1.1.1.4. Titanium
- 5.1.1.1.5. Aluminium
- 5.1.1.2. Nonmetal Oxides
- 5.1.1.2.1. Alumina
- 5.1.1.2.2. Iron Oxide
- 5.1.1.2.3. Titanium Oxide
- 5.1.1.2.4. Silica
- 5.1.1.2.5. Zinc Oxide
- 5.1.1.3. Complex Oxides
- 5.1.1.3.1. Calcium Phosphate
- 5.1.1.3.2. Rare Earth Metal Oxides
- 5.1.1.3.3. Lithium Titanate
- 5.1.1.3.4. Silica Hydride
- 5.1.1.1. Nanometals
- 5.1.2. Nanofibers
- 5.1.3. Nanotubes
- 5.1.4. Nanoclays
- 5.1.5. Nanowires
- 5.1.1. Nanoparticles
- 5.2. Market Analysis, Insights and Forecast - by Structure Type
- 5.2.1. Non-polymer Organic Nanomaterials
- 5.2.1.1. Carbon Black
- 5.2.1.2. Carbon Nanotubes
- 5.2.1.3. Aptamers
- 5.2.1.4. Small Molecule OLED
- 5.2.1.5. Activated Carbon
- 5.2.1.6. Carbon Nanotubes Composites
- 5.2.2. Polymeric Nanomaterials
- 5.2.2.1. Coatings and Adhesives
- 5.2.2.2. Transfection Reagents
- 5.2.2.3. Diagnostics Reagents
- 5.2.2.4. Drug Delivery Vehicle
- 5.2.2.5. Fabric Treatments
- 5.2.2.6. Optical Coatings
- 5.2.2.7. Nano-porous Filtration Membrane
- 5.2.2.8. Di-electric Films
- 5.2.2.9. OLED Films
- 5.2.1. Non-polymer Organic Nanomaterials
- 5.3. Market Analysis, Insights and Forecast - by End-user Industry
- 5.3.1. Construction
- 5.3.2. Electronics
- 5.3.3. Energy
- 5.3.4. Healthcare
- 5.3.5. Personal Care
- 5.3.6. Rubber
- 5.3.7. Other End-user Industries
- 5.4. Market Analysis, Insights and Forecast - by Region
- 5.4.1. Asia Pacific
- 5.4.2. North America
- 5.4.3. Europe
- 5.4.4. South America
- 5.4.5. Middle East and Africa
- 5.1. Market Analysis, Insights and Forecast - by Product Type
- 6. Asia Pacific Nanomaterials Market Analysis, Insights and Forecast, 2019-2031
- 6.1. Market Analysis, Insights and Forecast - by Product Type
- 6.1.1. Nanoparticles
- 6.1.1.1. Nanometals
- 6.1.1.1.1. Gold
- 6.1.1.1.2. Silver
- 6.1.1.1.3. Platinum
- 6.1.1.1.4. Titanium
- 6.1.1.1.5. Aluminium
- 6.1.1.2. Nonmetal Oxides
- 6.1.1.2.1. Alumina
- 6.1.1.2.2. Iron Oxide
- 6.1.1.2.3. Titanium Oxide
- 6.1.1.2.4. Silica
- 6.1.1.2.5. Zinc Oxide
- 6.1.1.3. Complex Oxides
- 6.1.1.3.1. Calcium Phosphate
- 6.1.1.3.2. Rare Earth Metal Oxides
- 6.1.1.3.3. Lithium Titanate
- 6.1.1.3.4. Silica Hydride
- 6.1.1.1. Nanometals
- 6.1.2. Nanofibers
- 6.1.3. Nanotubes
- 6.1.4. Nanoclays
- 6.1.5. Nanowires
- 6.1.1. Nanoparticles
- 6.2. Market Analysis, Insights and Forecast - by Structure Type
- 6.2.1. Non-polymer Organic Nanomaterials
- 6.2.1.1. Carbon Black
- 6.2.1.2. Carbon Nanotubes
- 6.2.1.3. Aptamers
- 6.2.1.4. Small Molecule OLED
- 6.2.1.5. Activated Carbon
- 6.2.1.6. Carbon Nanotubes Composites
- 6.2.2. Polymeric Nanomaterials
- 6.2.2.1. Coatings and Adhesives
- 6.2.2.2. Transfection Reagents
- 6.2.2.3. Diagnostics Reagents
- 6.2.2.4. Drug Delivery Vehicle
- 6.2.2.5. Fabric Treatments
- 6.2.2.6. Optical Coatings
- 6.2.2.7. Nano-porous Filtration Membrane
- 6.2.2.8. Di-electric Films
- 6.2.2.9. OLED Films
- 6.2.1. Non-polymer Organic Nanomaterials
- 6.3. Market Analysis, Insights and Forecast - by End-user Industry
- 6.3.1. Construction
- 6.3.2. Electronics
- 6.3.3. Energy
- 6.3.4. Healthcare
- 6.3.5. Personal Care
- 6.3.6. Rubber
- 6.3.7. Other End-user Industries
- 6.1. Market Analysis, Insights and Forecast - by Product Type
- 7. North America Nanomaterials Market Analysis, Insights and Forecast, 2019-2031
- 7.1. Market Analysis, Insights and Forecast - by Product Type
- 7.1.1. Nanoparticles
- 7.1.1.1. Nanometals
- 7.1.1.1.1. Gold
- 7.1.1.1.2. Silver
- 7.1.1.1.3. Platinum
- 7.1.1.1.4. Titanium
- 7.1.1.1.5. Aluminium
- 7.1.1.2. Nonmetal Oxides
- 7.1.1.2.1. Alumina
- 7.1.1.2.2. Iron Oxide
- 7.1.1.2.3. Titanium Oxide
- 7.1.1.2.4. Silica
- 7.1.1.2.5. Zinc Oxide
- 7.1.1.3. Complex Oxides
- 7.1.1.3.1. Calcium Phosphate
- 7.1.1.3.2. Rare Earth Metal Oxides
- 7.1.1.3.3. Lithium Titanate
- 7.1.1.3.4. Silica Hydride
- 7.1.1.1. Nanometals
- 7.1.2. Nanofibers
- 7.1.3. Nanotubes
- 7.1.4. Nanoclays
- 7.1.5. Nanowires
- 7.1.1. Nanoparticles
- 7.2. Market Analysis, Insights and Forecast - by Structure Type
- 7.2.1. Non-polymer Organic Nanomaterials
- 7.2.1.1. Carbon Black
- 7.2.1.2. Carbon Nanotubes
- 7.2.1.3. Aptamers
- 7.2.1.4. Small Molecule OLED
- 7.2.1.5. Activated Carbon
- 7.2.1.6. Carbon Nanotubes Composites
- 7.2.2. Polymeric Nanomaterials
- 7.2.2.1. Coatings and Adhesives
- 7.2.2.2. Transfection Reagents
- 7.2.2.3. Diagnostics Reagents
- 7.2.2.4. Drug Delivery Vehicle
- 7.2.2.5. Fabric Treatments
- 7.2.2.6. Optical Coatings
- 7.2.2.7. Nano-porous Filtration Membrane
- 7.2.2.8. Di-electric Films
- 7.2.2.9. OLED Films
- 7.2.1. Non-polymer Organic Nanomaterials
- 7.3. Market Analysis, Insights and Forecast - by End-user Industry
- 7.3.1. Construction
- 7.3.2. Electronics
- 7.3.3. Energy
- 7.3.4. Healthcare
- 7.3.5. Personal Care
- 7.3.6. Rubber
- 7.3.7. Other End-user Industries
- 7.1. Market Analysis, Insights and Forecast - by Product Type
- 8. Europe Nanomaterials Market Analysis, Insights and Forecast, 2019-2031
- 8.1. Market Analysis, Insights and Forecast - by Product Type
- 8.1.1. Nanoparticles
- 8.1.1.1. Nanometals
- 8.1.1.1.1. Gold
- 8.1.1.1.2. Silver
- 8.1.1.1.3. Platinum
- 8.1.1.1.4. Titanium
- 8.1.1.1.5. Aluminium
- 8.1.1.2. Nonmetal Oxides
- 8.1.1.2.1. Alumina
- 8.1.1.2.2. Iron Oxide
- 8.1.1.2.3. Titanium Oxide
- 8.1.1.2.4. Silica
- 8.1.1.2.5. Zinc Oxide
- 8.1.1.3. Complex Oxides
- 8.1.1.3.1. Calcium Phosphate
- 8.1.1.3.2. Rare Earth Metal Oxides
- 8.1.1.3.3. Lithium Titanate
- 8.1.1.3.4. Silica Hydride
- 8.1.1.1. Nanometals
- 8.1.2. Nanofibers
- 8.1.3. Nanotubes
- 8.1.4. Nanoclays
- 8.1.5. Nanowires
- 8.1.1. Nanoparticles
- 8.2. Market Analysis, Insights and Forecast - by Structure Type
- 8.2.1. Non-polymer Organic Nanomaterials
- 8.2.1.1. Carbon Black
- 8.2.1.2. Carbon Nanotubes
- 8.2.1.3. Aptamers
- 8.2.1.4. Small Molecule OLED
- 8.2.1.5. Activated Carbon
- 8.2.1.6. Carbon Nanotubes Composites
- 8.2.2. Polymeric Nanomaterials
- 8.2.2.1. Coatings and Adhesives
- 8.2.2.2. Transfection Reagents
- 8.2.2.3. Diagnostics Reagents
- 8.2.2.4. Drug Delivery Vehicle
- 8.2.2.5. Fabric Treatments
- 8.2.2.6. Optical Coatings
- 8.2.2.7. Nano-porous Filtration Membrane
- 8.2.2.8. Di-electric Films
- 8.2.2.9. OLED Films
- 8.2.1. Non-polymer Organic Nanomaterials
- 8.3. Market Analysis, Insights and Forecast - by End-user Industry
- 8.3.1. Construction
- 8.3.2. Electronics
- 8.3.3. Energy
- 8.3.4. Healthcare
- 8.3.5. Personal Care
- 8.3.6. Rubber
- 8.3.7. Other End-user Industries
- 8.1. Market Analysis, Insights and Forecast - by Product Type
- 9. South America Nanomaterials Market Analysis, Insights and Forecast, 2019-2031
- 9.1. Market Analysis, Insights and Forecast - by Product Type
- 9.1.1. Nanoparticles
- 9.1.1.1. Nanometals
- 9.1.1.1.1. Gold
- 9.1.1.1.2. Silver
- 9.1.1.1.3. Platinum
- 9.1.1.1.4. Titanium
- 9.1.1.1.5. Aluminium
- 9.1.1.2. Nonmetal Oxides
- 9.1.1.2.1. Alumina
- 9.1.1.2.2. Iron Oxide
- 9.1.1.2.3. Titanium Oxide
- 9.1.1.2.4. Silica
- 9.1.1.2.5. Zinc Oxide
- 9.1.1.3. Complex Oxides
- 9.1.1.3.1. Calcium Phosphate
- 9.1.1.3.2. Rare Earth Metal Oxides
- 9.1.1.3.3. Lithium Titanate
- 9.1.1.3.4. Silica Hydride
- 9.1.1.1. Nanometals
- 9.1.2. Nanofibers
- 9.1.3. Nanotubes
- 9.1.4. Nanoclays
- 9.1.5. Nanowires
- 9.1.1. Nanoparticles
- 9.2. Market Analysis, Insights and Forecast - by Structure Type
- 9.2.1. Non-polymer Organic Nanomaterials
- 9.2.1.1. Carbon Black
- 9.2.1.2. Carbon Nanotubes
- 9.2.1.3. Aptamers
- 9.2.1.4. Small Molecule OLED
- 9.2.1.5. Activated Carbon
- 9.2.1.6. Carbon Nanotubes Composites
- 9.2.2. Polymeric Nanomaterials
- 9.2.2.1. Coatings and Adhesives
- 9.2.2.2. Transfection Reagents
- 9.2.2.3. Diagnostics Reagents
- 9.2.2.4. Drug Delivery Vehicle
- 9.2.2.5. Fabric Treatments
- 9.2.2.6. Optical Coatings
- 9.2.2.7. Nano-porous Filtration Membrane
- 9.2.2.8. Di-electric Films
- 9.2.2.9. OLED Films
- 9.2.1. Non-polymer Organic Nanomaterials
- 9.3. Market Analysis, Insights and Forecast - by End-user Industry
- 9.3.1. Construction
- 9.3.2. Electronics
- 9.3.3. Energy
- 9.3.4. Healthcare
- 9.3.5. Personal Care
- 9.3.6. Rubber
- 9.3.7. Other End-user Industries
- 9.1. Market Analysis, Insights and Forecast - by Product Type
- 10. Middle East and Africa Nanomaterials Market Analysis, Insights and Forecast, 2019-2031
- 10.1. Market Analysis, Insights and Forecast - by Product Type
- 10.1.1. Nanoparticles
- 10.1.1.1. Nanometals
- 10.1.1.1.1. Gold
- 10.1.1.1.2. Silver
- 10.1.1.1.3. Platinum
- 10.1.1.1.4. Titanium
- 10.1.1.1.5. Aluminium
- 10.1.1.2. Nonmetal Oxides
- 10.1.1.2.1. Alumina
- 10.1.1.2.2. Iron Oxide
- 10.1.1.2.3. Titanium Oxide
- 10.1.1.2.4. Silica
- 10.1.1.2.5. Zinc Oxide
- 10.1.1.3. Complex Oxides
- 10.1.1.3.1. Calcium Phosphate
- 10.1.1.3.2. Rare Earth Metal Oxides
- 10.1.1.3.3. Lithium Titanate
- 10.1.1.3.4. Silica Hydride
- 10.1.1.1. Nanometals
- 10.1.2. Nanofibers
- 10.1.3. Nanotubes
- 10.1.4. Nanoclays
- 10.1.5. Nanowires
- 10.1.1. Nanoparticles
- 10.2. Market Analysis, Insights and Forecast - by Structure Type
- 10.2.1. Non-polymer Organic Nanomaterials
- 10.2.1.1. Carbon Black
- 10.2.1.2. Carbon Nanotubes
- 10.2.1.3. Aptamers
- 10.2.1.4. Small Molecule OLED
- 10.2.1.5. Activated Carbon
- 10.2.1.6. Carbon Nanotubes Composites
- 10.2.2. Polymeric Nanomaterials
- 10.2.2.1. Coatings and Adhesives
- 10.2.2.2. Transfection Reagents
- 10.2.2.3. Diagnostics Reagents
- 10.2.2.4. Drug Delivery Vehicle
- 10.2.2.5. Fabric Treatments
- 10.2.2.6. Optical Coatings
- 10.2.2.7. Nano-porous Filtration Membrane
- 10.2.2.8. Di-electric Films
- 10.2.2.9. OLED Films
- 10.2.1. Non-polymer Organic Nanomaterials
- 10.3. Market Analysis, Insights and Forecast - by End-user Industry
- 10.3.1. Construction
- 10.3.2. Electronics
- 10.3.3. Energy
- 10.3.4. Healthcare
- 10.3.5. Personal Care
- 10.3.6. Rubber
- 10.3.7. Other End-user Industries
- 10.1. Market Analysis, Insights and Forecast - by Product Type
- 11. Asia Pacific Nanomaterials Market Analysis, Insights and Forecast, 2019-2031
- 11.1. Market Analysis, Insights and Forecast - By Country/Sub-region
- 11.1.1 China
- 11.1.2 India
- 11.1.3 Japan
- 11.1.4 South Korea
- 11.1.5 ASEAN Countries
- 11.1.6 Rest of Asia Pacific
- 12. North America Nanomaterials Market Analysis, Insights and Forecast, 2019-2031
- 12.1. Market Analysis, Insights and Forecast - By Country/Sub-region
- 12.1.1 United States
- 12.1.2 Canada
- 12.1.3 Mexico
- 13. Europe Nanomaterials Market Analysis, Insights and Forecast, 2019-2031
- 13.1. Market Analysis, Insights and Forecast - By Country/Sub-region
- 13.1.1 Germany
- 13.1.2 United Kingdom
- 13.1.3 Italy
- 13.1.4 France
- 13.1.5 Rest of Europe
- 14. South America Nanomaterials Market Analysis, Insights and Forecast, 2019-2031
- 14.1. Market Analysis, Insights and Forecast - By Country/Sub-region
- 14.1.1 Brazil
- 14.1.2 Argentina
- 14.1.3 Rest of South America
- 15. Middle East and Africa Nanomaterials Market Analysis, Insights and Forecast, 2019-2031
- 15.1. Market Analysis, Insights and Forecast - By Country/Sub-region
- 15.1.1 Saudi Arabia
- 15.1.2 South Africa
- 15.1.3 Rest of Middle East and Africa
- 16. Competitive Analysis
- 16.1. Global Market Share Analysis 2024
- 16.2. Company Profiles
- 16.2.1 ZYVEX TECHNOLOGIES*List Not Exhaustive
- 16.2.1.1. Overview
- 16.2.1.2. Products
- 16.2.1.3. SWOT Analysis
- 16.2.1.4. Recent Developments
- 16.2.1.5. Financials (Based on Availability)
- 16.2.2 Jiangsu Cnano Technology Co Ltd
- 16.2.2.1. Overview
- 16.2.2.2. Products
- 16.2.2.3. SWOT Analysis
- 16.2.2.4. Recent Developments
- 16.2.2.5. Financials (Based on Availability)
- 16.2.3 ACS Material
- 16.2.3.1. Overview
- 16.2.3.2. Products
- 16.2.3.3. SWOT Analysis
- 16.2.3.4. Recent Developments
- 16.2.3.5. Financials (Based on Availability)
- 16.2.4 Raymor Industries Inc
- 16.2.4.1. Overview
- 16.2.4.2. Products
- 16.2.4.3. SWOT Analysis
- 16.2.4.4. Recent Developments
- 16.2.4.5. Financials (Based on Availability)
- 16.2.5 American Elements
- 16.2.5.1. Overview
- 16.2.5.2. Products
- 16.2.5.3. SWOT Analysis
- 16.2.5.4. Recent Developments
- 16.2.5.5. Financials (Based on Availability)
- 16.2.6 Cabot Corporation
- 16.2.6.1. Overview
- 16.2.6.2. Products
- 16.2.6.3. SWOT Analysis
- 16.2.6.4. Recent Developments
- 16.2.6.5. Financials (Based on Availability)
- 16.2.7 Nanophase Technologies Corporation
- 16.2.7.1. Overview
- 16.2.7.2. Products
- 16.2.7.3. SWOT Analysis
- 16.2.7.4. Recent Developments
- 16.2.7.5. Financials (Based on Availability)
- 16.2.8 BASF SE
- 16.2.8.1. Overview
- 16.2.8.2. Products
- 16.2.8.3. SWOT Analysis
- 16.2.8.4. Recent Developments
- 16.2.8.5. Financials (Based on Availability)
- 16.2.9 Nanocyl SA
- 16.2.9.1. Overview
- 16.2.9.2. Products
- 16.2.9.3. SWOT Analysis
- 16.2.9.4. Recent Developments
- 16.2.9.5. Financials (Based on Availability)
- 16.2.10 Arkema Group
- 16.2.10.1. Overview
- 16.2.10.2. Products
- 16.2.10.3. SWOT Analysis
- 16.2.10.4. Recent Developments
- 16.2.10.5. Financials (Based on Availability)
- 16.2.11 LG Chem
- 16.2.11.1. Overview
- 16.2.11.2. Products
- 16.2.11.3. SWOT Analysis
- 16.2.11.4. Recent Developments
- 16.2.11.5. Financials (Based on Availability)
- 16.2.12 Nano-C
- 16.2.12.1. Overview
- 16.2.12.2. Products
- 16.2.12.3. SWOT Analysis
- 16.2.12.4. Recent Developments
- 16.2.12.5. Financials (Based on Availability)
- 16.2.13 Chengdu Organic Chemicals Co Ltd (Timesnano)
- 16.2.13.1. Overview
- 16.2.13.2. Products
- 16.2.13.3. SWOT Analysis
- 16.2.13.4. Recent Developments
- 16.2.13.5. Financials (Based on Availability)
- 16.2.14 CHASM Advanced Materials Inc
- 16.2.14.1. Overview
- 16.2.14.2. Products
- 16.2.14.3. SWOT Analysis
- 16.2.14.4. Recent Developments
- 16.2.14.5. Financials (Based on Availability)
- 16.2.15 SHOWA DENKO K K
- 16.2.15.1. Overview
- 16.2.15.2. Products
- 16.2.15.3. SWOT Analysis
- 16.2.15.4. Recent Developments
- 16.2.15.5. Financials (Based on Availability)
- 16.2.16 OCSiAl
- 16.2.16.1. Overview
- 16.2.16.2. Products
- 16.2.16.3. SWOT Analysis
- 16.2.16.4. Recent Developments
- 16.2.16.5. Financials (Based on Availability)
- 16.2.1 ZYVEX TECHNOLOGIES*List Not Exhaustive
List of Figures
- Figure 1: Global Nanomaterials Market Revenue Breakdown (Million, %) by Region 2024 & 2032
- Figure 2: Asia Pacific Nanomaterials Market Revenue (Million), by Country 2024 & 2032
- Figure 3: Asia Pacific Nanomaterials Market Revenue Share (%), by Country 2024 & 2032
- Figure 4: North America Nanomaterials Market Revenue (Million), by Country 2024 & 2032
- Figure 5: North America Nanomaterials Market Revenue Share (%), by Country 2024 & 2032
- Figure 6: Europe Nanomaterials Market Revenue (Million), by Country 2024 & 2032
- Figure 7: Europe Nanomaterials Market Revenue Share (%), by Country 2024 & 2032
- Figure 8: South America Nanomaterials Market Revenue (Million), by Country 2024 & 2032
- Figure 9: South America Nanomaterials Market Revenue Share (%), by Country 2024 & 2032
- Figure 10: Middle East and Africa Nanomaterials Market Revenue (Million), by Country 2024 & 2032
- Figure 11: Middle East and Africa Nanomaterials Market Revenue Share (%), by Country 2024 & 2032
- Figure 12: Asia Pacific Nanomaterials Market Revenue (Million), by Product Type 2024 & 2032
- Figure 13: Asia Pacific Nanomaterials Market Revenue Share (%), by Product Type 2024 & 2032
- Figure 14: Asia Pacific Nanomaterials Market Revenue (Million), by Structure Type 2024 & 2032
- Figure 15: Asia Pacific Nanomaterials Market Revenue Share (%), by Structure Type 2024 & 2032
- Figure 16: Asia Pacific Nanomaterials Market Revenue (Million), by End-user Industry 2024 & 2032
- Figure 17: Asia Pacific Nanomaterials Market Revenue Share (%), by End-user Industry 2024 & 2032
- Figure 18: Asia Pacific Nanomaterials Market Revenue (Million), by Country 2024 & 2032
- Figure 19: Asia Pacific Nanomaterials Market Revenue Share (%), by Country 2024 & 2032
- Figure 20: North America Nanomaterials Market Revenue (Million), by Product Type 2024 & 2032
- Figure 21: North America Nanomaterials Market Revenue Share (%), by Product Type 2024 & 2032
- Figure 22: North America Nanomaterials Market Revenue (Million), by Structure Type 2024 & 2032
- Figure 23: North America Nanomaterials Market Revenue Share (%), by Structure Type 2024 & 2032
- Figure 24: North America Nanomaterials Market Revenue (Million), by End-user Industry 2024 & 2032
- Figure 25: North America Nanomaterials Market Revenue Share (%), by End-user Industry 2024 & 2032
- Figure 26: North America Nanomaterials Market Revenue (Million), by Country 2024 & 2032
- Figure 27: North America Nanomaterials Market Revenue Share (%), by Country 2024 & 2032
- Figure 28: Europe Nanomaterials Market Revenue (Million), by Product Type 2024 & 2032
- Figure 29: Europe Nanomaterials Market Revenue Share (%), by Product Type 2024 & 2032
- Figure 30: Europe Nanomaterials Market Revenue (Million), by Structure Type 2024 & 2032
- Figure 31: Europe Nanomaterials Market Revenue Share (%), by Structure Type 2024 & 2032
- Figure 32: Europe Nanomaterials Market Revenue (Million), by End-user Industry 2024 & 2032
- Figure 33: Europe Nanomaterials Market Revenue Share (%), by End-user Industry 2024 & 2032
- Figure 34: Europe Nanomaterials Market Revenue (Million), by Country 2024 & 2032
- Figure 35: Europe Nanomaterials Market Revenue Share (%), by Country 2024 & 2032
- Figure 36: South America Nanomaterials Market Revenue (Million), by Product Type 2024 & 2032
- Figure 37: South America Nanomaterials Market Revenue Share (%), by Product Type 2024 & 2032
- Figure 38: South America Nanomaterials Market Revenue (Million), by Structure Type 2024 & 2032
- Figure 39: South America Nanomaterials Market Revenue Share (%), by Structure Type 2024 & 2032
- Figure 40: South America Nanomaterials Market Revenue (Million), by End-user Industry 2024 & 2032
- Figure 41: South America Nanomaterials Market Revenue Share (%), by End-user Industry 2024 & 2032
- Figure 42: South America Nanomaterials Market Revenue (Million), by Country 2024 & 2032
- Figure 43: South America Nanomaterials Market Revenue Share (%), by Country 2024 & 2032
- Figure 44: Middle East and Africa Nanomaterials Market Revenue (Million), by Product Type 2024 & 2032
- Figure 45: Middle East and Africa Nanomaterials Market Revenue Share (%), by Product Type 2024 & 2032
- Figure 46: Middle East and Africa Nanomaterials Market Revenue (Million), by Structure Type 2024 & 2032
- Figure 47: Middle East and Africa Nanomaterials Market Revenue Share (%), by Structure Type 2024 & 2032
- Figure 48: Middle East and Africa Nanomaterials Market Revenue (Million), by End-user Industry 2024 & 2032
- Figure 49: Middle East and Africa Nanomaterials Market Revenue Share (%), by End-user Industry 2024 & 2032
- Figure 50: Middle East and Africa Nanomaterials Market Revenue (Million), by Country 2024 & 2032
- Figure 51: Middle East and Africa Nanomaterials Market Revenue Share (%), by Country 2024 & 2032
List of Tables
- Table 1: Global Nanomaterials Market Revenue Million Forecast, by Region 2019 & 2032
- Table 2: Global Nanomaterials Market Revenue Million Forecast, by Product Type 2019 & 2032
- Table 3: Global Nanomaterials Market Revenue Million Forecast, by Structure Type 2019 & 2032
- Table 4: Global Nanomaterials Market Revenue Million Forecast, by End-user Industry 2019 & 2032
- Table 5: Global Nanomaterials Market Revenue Million Forecast, by Region 2019 & 2032
- Table 6: Global Nanomaterials Market Revenue Million Forecast, by Country 2019 & 2032
- Table 7: China Nanomaterials Market Revenue (Million) Forecast, by Application 2019 & 2032
- Table 8: India Nanomaterials Market Revenue (Million) Forecast, by Application 2019 & 2032
- Table 9: Japan Nanomaterials Market Revenue (Million) Forecast, by Application 2019 & 2032
- Table 10: South Korea Nanomaterials Market Revenue (Million) Forecast, by Application 2019 & 2032
- Table 11: ASEAN Countries Nanomaterials Market Revenue (Million) Forecast, by Application 2019 & 2032
- Table 12: Rest of Asia Pacific Nanomaterials Market Revenue (Million) Forecast, by Application 2019 & 2032
- Table 13: Global Nanomaterials Market Revenue Million Forecast, by Country 2019 & 2032
- Table 14: United States Nanomaterials Market Revenue (Million) Forecast, by Application 2019 & 2032
- Table 15: Canada Nanomaterials Market Revenue (Million) Forecast, by Application 2019 & 2032
- Table 16: Mexico Nanomaterials Market Revenue (Million) Forecast, by Application 2019 & 2032
- Table 17: Global Nanomaterials Market Revenue Million Forecast, by Country 2019 & 2032
- Table 18: Germany Nanomaterials Market Revenue (Million) Forecast, by Application 2019 & 2032
- Table 19: United Kingdom Nanomaterials Market Revenue (Million) Forecast, by Application 2019 & 2032
- Table 20: Italy Nanomaterials Market Revenue (Million) Forecast, by Application 2019 & 2032
- Table 21: France Nanomaterials Market Revenue (Million) Forecast, by Application 2019 & 2032
- Table 22: Rest of Europe Nanomaterials Market Revenue (Million) Forecast, by Application 2019 & 2032
- Table 23: Global Nanomaterials Market Revenue Million Forecast, by Country 2019 & 2032
- Table 24: Brazil Nanomaterials Market Revenue (Million) Forecast, by Application 2019 & 2032
- Table 25: Argentina Nanomaterials Market Revenue (Million) Forecast, by Application 2019 & 2032
- Table 26: Rest of South America Nanomaterials Market Revenue (Million) Forecast, by Application 2019 & 2032
- Table 27: Global Nanomaterials Market Revenue Million Forecast, by Country 2019 & 2032
- Table 28: Saudi Arabia Nanomaterials Market Revenue (Million) Forecast, by Application 2019 & 2032
- Table 29: South Africa Nanomaterials Market Revenue (Million) Forecast, by Application 2019 & 2032
- Table 30: Rest of Middle East and Africa Nanomaterials Market Revenue (Million) Forecast, by Application 2019 & 2032
- Table 31: Global Nanomaterials Market Revenue Million Forecast, by Product Type 2019 & 2032
- Table 32: Global Nanomaterials Market Revenue Million Forecast, by Structure Type 2019 & 2032
- Table 33: Global Nanomaterials Market Revenue Million Forecast, by End-user Industry 2019 & 2032
- Table 34: Global Nanomaterials Market Revenue Million Forecast, by Country 2019 & 2032
- Table 35: China Nanomaterials Market Revenue (Million) Forecast, by Application 2019 & 2032
- Table 36: India Nanomaterials Market Revenue (Million) Forecast, by Application 2019 & 2032
- Table 37: Japan Nanomaterials Market Revenue (Million) Forecast, by Application 2019 & 2032
- Table 38: South Korea Nanomaterials Market Revenue (Million) Forecast, by Application 2019 & 2032
- Table 39: ASEAN Countries Nanomaterials Market Revenue (Million) Forecast, by Application 2019 & 2032
- Table 40: Rest of Asia Pacific Nanomaterials Market Revenue (Million) Forecast, by Application 2019 & 2032
- Table 41: Global Nanomaterials Market Revenue Million Forecast, by Product Type 2019 & 2032
- Table 42: Global Nanomaterials Market Revenue Million Forecast, by Structure Type 2019 & 2032
- Table 43: Global Nanomaterials Market Revenue Million Forecast, by End-user Industry 2019 & 2032
- Table 44: Global Nanomaterials Market Revenue Million Forecast, by Country 2019 & 2032
- Table 45: United States Nanomaterials Market Revenue (Million) Forecast, by Application 2019 & 2032
- Table 46: Canada Nanomaterials Market Revenue (Million) Forecast, by Application 2019 & 2032
- Table 47: Mexico Nanomaterials Market Revenue (Million) Forecast, by Application 2019 & 2032
- Table 48: Global Nanomaterials Market Revenue Million Forecast, by Product Type 2019 & 2032
- Table 49: Global Nanomaterials Market Revenue Million Forecast, by Structure Type 2019 & 2032
- Table 50: Global Nanomaterials Market Revenue Million Forecast, by End-user Industry 2019 & 2032
- Table 51: Global Nanomaterials Market Revenue Million Forecast, by Country 2019 & 2032
- Table 52: Germany Nanomaterials Market Revenue (Million) Forecast, by Application 2019 & 2032
- Table 53: United Kingdom Nanomaterials Market Revenue (Million) Forecast, by Application 2019 & 2032
- Table 54: Italy Nanomaterials Market Revenue (Million) Forecast, by Application 2019 & 2032
- Table 55: France Nanomaterials Market Revenue (Million) Forecast, by Application 2019 & 2032
- Table 56: Rest of Europe Nanomaterials Market Revenue (Million) Forecast, by Application 2019 & 2032
- Table 57: Global Nanomaterials Market Revenue Million Forecast, by Product Type 2019 & 2032
- Table 58: Global Nanomaterials Market Revenue Million Forecast, by Structure Type 2019 & 2032
- Table 59: Global Nanomaterials Market Revenue Million Forecast, by End-user Industry 2019 & 2032
- Table 60: Global Nanomaterials Market Revenue Million Forecast, by Country 2019 & 2032
- Table 61: Brazil Nanomaterials Market Revenue (Million) Forecast, by Application 2019 & 2032
- Table 62: Argentina Nanomaterials Market Revenue (Million) Forecast, by Application 2019 & 2032
- Table 63: Rest of South America Nanomaterials Market Revenue (Million) Forecast, by Application 2019 & 2032
- Table 64: Global Nanomaterials Market Revenue Million Forecast, by Product Type 2019 & 2032
- Table 65: Global Nanomaterials Market Revenue Million Forecast, by Structure Type 2019 & 2032
- Table 66: Global Nanomaterials Market Revenue Million Forecast, by End-user Industry 2019 & 2032
- Table 67: Global Nanomaterials Market Revenue Million Forecast, by Country 2019 & 2032
- Table 68: Saudi Arabia Nanomaterials Market Revenue (Million) Forecast, by Application 2019 & 2032
- Table 69: South Africa Nanomaterials Market Revenue (Million) Forecast, by Application 2019 & 2032
- Table 70: Rest of Middle East and Africa Nanomaterials Market Revenue (Million) Forecast, by Application 2019 & 2032
Frequently Asked Questions
1. What is the projected Compound Annual Growth Rate (CAGR) of the Nanomaterials Market?
The projected CAGR is approximately > 19.00%.
2. Which companies are prominent players in the Nanomaterials Market?
Key companies in the market include ZYVEX TECHNOLOGIES*List Not Exhaustive, Jiangsu Cnano Technology Co Ltd, ACS Material, Raymor Industries Inc, American Elements, Cabot Corporation, Nanophase Technologies Corporation, BASF SE, Nanocyl SA, Arkema Group, LG Chem, Nano-C, Chengdu Organic Chemicals Co Ltd (Timesnano), CHASM Advanced Materials Inc, SHOWA DENKO K K, OCSiAl.
3. What are the main segments of the Nanomaterials Market?
The market segments include Product Type, Structure Type, End-user Industry.
4. Can you provide details about the market size?
The market size is estimated to be USD XX Million as of 2022.
5. What are some drivers contributing to market growth?
Growing Usage of Nanomedicines in the Healthcare Industry; Increasing Usage of Nanomaterials in Water Treatment Applications.
6. What are the notable trends driving market growth?
The Electrical and Electronics Segment to Dominate the Market.
7. Are there any restraints impacting market growth?
Higher Costs of Technology.
8. Can you provide examples of recent developments in the market?
In November 2022, American Elements launched a novel nanoscale electrolyte material that will be used in lithium-ion batteries. The electrolyte is an energy-dense and ceramic compound of lithium, lanthanum, and zirconium oxide nanoparticles.
9. What pricing options are available for accessing the report?
Pricing options include single-user, multi-user, and enterprise licenses priced at USD 4750, USD 5250, and USD 8750 respectively.
10. Is the market size provided in terms of value or volume?
The market size is provided in terms of value, measured in Million.
11. Are there any specific market keywords associated with the report?
Yes, the market keyword associated with the report is "Nanomaterials Market," which aids in identifying and referencing the specific market segment covered.
12. How do I determine which pricing option suits my needs best?
The pricing options vary based on user requirements and access needs. Individual users may opt for single-user licenses, while businesses requiring broader access may choose multi-user or enterprise licenses for cost-effective access to the report.
13. Are there any additional resources or data provided in the Nanomaterials Market report?
While the report offers comprehensive insights, it's advisable to review the specific contents or supplementary materials provided to ascertain if additional resources or data are available.
14. How can I stay updated on further developments or reports in the Nanomaterials Market?
To stay informed about further developments, trends, and reports in the Nanomaterials Market, consider subscribing to industry newsletters, following relevant companies and organizations, or regularly checking reputable industry news sources and publications.
Methodology
Step 1 - Identification of Relevant Samples Size from Population Database


Step 2 - Approaches for Defining Global Market Size (Value, Volume* & Price*)

Note*: In applicable scenarios
Step 3 - Data Sources
Primary Research
- Web Analytics
- Survey Reports
- Research Institute
- Latest Research Reports
- Opinion Leaders
Secondary Research
- Annual Reports
- White Paper
- Latest Press Release
- Industry Association
- Paid Database
- Investor Presentations

Step 4 - Data Triangulation
Involves using different sources of information in order to increase the validity of a study
These sources are likely to be stakeholders in a program - participants, other researchers, program staff, other community members, and so on.
Then we put all data in single framework & apply various statistical tools to find out the dynamic on the market.
During the analysis stage, feedback from the stakeholder groups would be compared to determine areas of agreement as well as areas of divergence


