

Key Insights
The ASEAN Dry Mix Mortar market is projected for significant expansion, expected to reach approximately $2.68 billion by 2024, with a Compound Annual Growth Rate (CAGR) of 7% through 2033. This growth is driven by the increasing demand for high-performance, durable, and easy-to-apply construction materials across the region's developing economies. Key growth factors include rapid urbanization, substantial infrastructure investments, and a burgeoning residential construction sector supported by a growing middle class and the need for modern housing. The adoption of pre-mixed mortars signals a shift towards efficient and sustainable construction, reducing on-site labor and waste. Demand for specialized applications like tile adhesives, grouts, waterproofing, and concrete repair solutions is also contributing to market diversification.
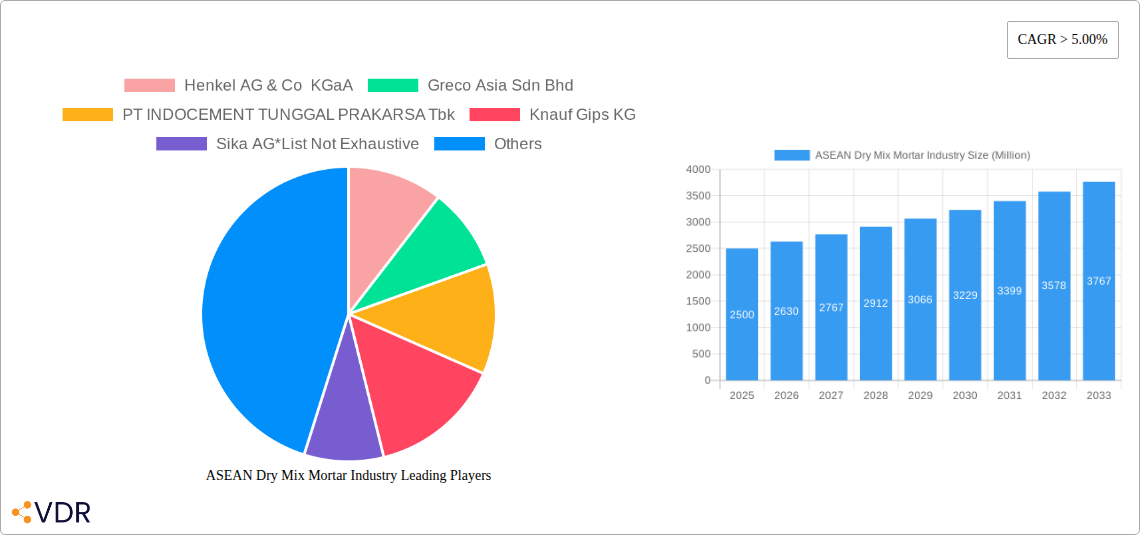
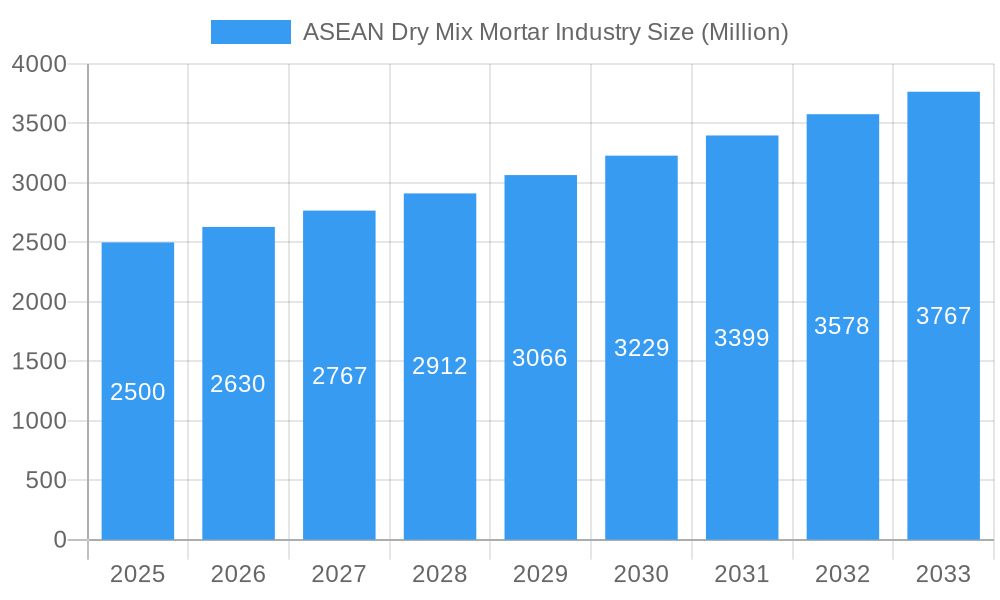
ASEAN Dry Mix Mortar Industry Market Size (In Billion)
The market is influenced by trends such as the development of eco-friendly mortar formulations and the integration of advanced manufacturing technologies. The non-residential sector, including commercial, infrastructure, and industrial applications, offers considerable growth potential due to large-scale development projects. However, market challenges include fluctuating raw material prices and distribution complexities in the diverse ASEAN region. Despite these, the modernization of construction techniques and sustained economic development in countries like Malaysia, Indonesia, Thailand, Singapore, Philippines, and Vietnam are expected to drive the ASEAN Dry Mix Mortar industry.
ASEAN Dry Mix Mortar Industry Company Market Share
This report offers an in-depth analysis of the ASEAN Dry Mix Mortar Industry, providing critical insights into market dynamics, growth trends, regional performance, product offerings, and key players. It is an essential resource for construction professionals, manufacturers, investors, and policymakers, offering a detailed examination of market segments, applications, and emerging opportunities for strategic decision-making.
ASEAN Dry Mix Mortar Industry Market Dynamics & Structure
The ASEAN dry mix mortar market is characterized by a moderately concentrated landscape, with a growing emphasis on technological innovation and product differentiation. Key drivers include advancements in formulation, leading to improved performance characteristics like faster setting times, enhanced adhesion, and superior workability. Regulatory frameworks, while varying across member states, are increasingly prioritizing sustainable building practices and the use of eco-friendly construction materials, indirectly boosting the demand for dry mix mortars over traditional site-mixed alternatives. Competitive product substitutes, primarily site-mixed concrete and traditional mortar, face challenges due to their inherent inconsistencies in quality and labor intensity. End-user demographics are shifting towards a greater demand for faster construction timelines and higher quality finishes, particularly in the residential and commercial sectors. Mergers and acquisitions (M&A) are becoming a significant trend as larger players seek to expand their geographical reach and product portfolios, consolidating market share. For instance, recent M&A activities indicate a strategic push towards acquiring regional distributors and manufacturers to solidify market presence. Innovation barriers are primarily related to the cost of raw material procurement and the need for specialized manufacturing equipment.
- Market Concentration: Moderately concentrated with a few key global and regional players dominating market share.
- Technological Innovation: Focus on high-performance formulations, sustainability, and ease of application.
- Regulatory Frameworks: Growing emphasis on environmental standards and building codes promoting pre-mixed solutions.
- Competitive Substitutes: Traditional site-mixed mortar and concrete are facing declining preference due to quality and efficiency issues.
- End-User Demographics: Increasing demand for speed, quality, and specialized mortar solutions in urban and developing areas.
- M&A Trends: Strategic acquisitions to enhance market penetration, product diversification, and economies of scale.
- Innovation Barriers: Raw material cost fluctuations and investment in advanced manufacturing technology.
ASEAN Dry Mix Mortar Industry Growth Trends & Insights
The ASEAN dry mix mortar market is poised for robust expansion, driven by a confluence of factors that are reshaping the construction landscape. The market size has witnessed consistent growth from approximately $1,500 million in 2019 to an estimated $2,800 million in 2024, reflecting a Compound Annual Growth Rate (CAGR) of around 13.1%. This upward trajectory is projected to continue, with the market expected to reach an estimated $5,500 million by 2033. Adoption rates for dry mix mortars are accelerating as builders and contractors recognize the inherent benefits of consistency, reduced waste, and improved labor productivity compared to traditional site-mixed methods. Technological disruptions are playing a pivotal role, with advancements in polymer-modified binders, self-healing mortars, and rapid-setting formulations catering to diverse construction needs, from high-rise buildings to infrastructure projects. Consumer behavior is evolving towards a greater appreciation for durable, aesthetically pleasing, and low-maintenance construction solutions, directly influencing the demand for specialized dry mix mortars like tile adhesives and waterproofing slurries. The increasing urbanization across ASEAN nations, coupled with significant government investments in infrastructure development and housing projects, further fuels this demand. The shift towards pre-fabricated construction and modular building techniques also complements the use of dry mix mortars, streamlining on-site operations. Furthermore, growing environmental consciousness among consumers and developers is pushing the industry towards more sustainable and less resource-intensive building materials, a niche where dry mix mortars excel due to reduced water usage and controlled waste. The proliferation of specialized applications, such as thermal insulation systems and concrete repair mortars, is also contributing significantly to market penetration.
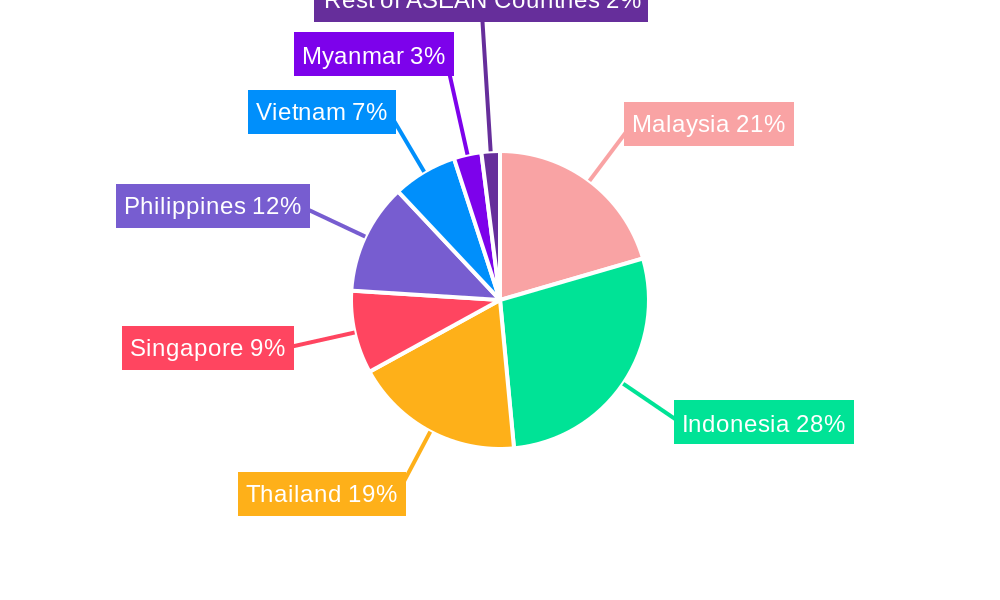
Dominant Regions, Countries, or Segments in ASEAN Dry Mix Mortar Industry
The Indonesian market stands out as a dominant force within the ASEAN dry mix mortar industry, driven by its sheer economic scale, rapid urbanization, and substantial infrastructure development initiatives. With an estimated market share of 28% in 2025, Indonesia's growth is propelled by its vast population and ongoing construction boom. The non-residential segment, encompassing commercial, infrastructure, and industrial applications, is a significant contributor to market dominance. Large-scale infrastructure projects, including new transportation networks, power plants, and industrial facilities, demand high-performance dry mix mortars for critical applications like concrete repair, protection, and specialized grouting. For instance, the country's commitment to developing its manufacturing sector and expanding its logistics infrastructure necessitates the use of advanced construction materials, directly benefiting the dry mix mortar market.
Key drivers for Indonesia's dominance include:
- Massive Infrastructure Projects: Government-led initiatives for toll roads, airports, and ports create substantial demand for construction materials.
- Growing Urbanization: Rapid expansion of cities leads to increased construction of residential and commercial buildings.
- Industrial Growth: Expansion of manufacturing and industrial zones requires specialized mortars for protection and repair.
- Favorable Economic Policies: Government support for the construction sector encourages investment and development.
- Increasing Awareness of Benefits: Builders and developers are increasingly recognizing the efficiency and quality advantages of dry mix mortars.
Within applications, Plaster and Render continue to hold significant market share due to their widespread use in conventional construction. However, the fastest growth is observed in specialized applications like Tile Adhesive and Concrete Protection and Renovation, driven by demand for enhanced aesthetics and longevity in both residential and commercial projects. The residential end-user industry remains a strong performer, fueled by the demand for affordable housing and modern living spaces.
ASEAN Dry Mix Mortar Industry Product Landscape
The ASEAN dry mix mortar industry is characterized by a dynamic product landscape driven by continuous innovation and a focus on enhanced performance. Key product categories include plasters, renders, tile adhesives, grouts, waterproofing slurries, concrete protection and renovation solutions, and insulation and finishing systems. Manufacturers are increasingly developing specialized formulations, such as polymer-modified tile adhesives offering superior flexibility and adhesion, rapid-setting grouts for faster project completion, and high-strength concrete repair mortars for infrastructure maintenance. The emphasis is on improving workability, durability, water resistance, and thermal insulation properties. Unique selling propositions often revolve around ease of application, reduced water consumption, minimal waste generation, and compliance with international quality and environmental standards. Technological advancements are leading to the development of self-leveling compounds, self-healing concretes with integrated repair capabilities, and advanced façade finishing systems that enhance aesthetic appeal and weather resistance.
Key Drivers, Barriers & Challenges in ASEAN Dry Mix Mortar Industry
Key Drivers:
The ASEAN dry mix mortar industry is propelled by a strong demand stemming from rapid urbanization and significant infrastructure development across the region. Growing awareness of the benefits of dry mix mortars, including improved quality control, reduced labor costs, and enhanced workability, drives adoption rates. Technological advancements in formulations, offering superior performance characteristics like faster setting times and increased durability, also act as significant growth accelerators. Government initiatives supporting sustainable construction practices and the increasing demand for aesthetically pleasing and long-lasting building finishes further bolster the market.
Barriers & Challenges:
Despite the positive growth trajectory, the industry faces certain barriers and challenges. The fluctuating prices of raw materials, such as cement and aggregates, can impact profit margins. A lack of skilled labor to efficiently apply specialized dry mix mortar products in some developing regions can hinder widespread adoption. Intense competition from established traditional mortar manufacturers and the initial cost perception of dry mix mortars compared to site-mixed alternatives can also pose challenges. Furthermore, navigating the diverse regulatory landscapes across different ASEAN countries and ensuring consistent product quality and supply chain efficiency across vast geographical areas require strategic planning and robust operational capabilities.
Emerging Opportunities in ASEAN Dry Mix Mortar Industry
Emerging opportunities in the ASEAN dry mix mortar industry lie in the growing demand for specialized and sustainable building solutions. The increasing focus on energy-efficient buildings presents a significant opportunity for insulation and finishing systems, including dry mix mortar-based thermal insulation boards and plasters. The rehabilitation and renovation of aging infrastructure across the region create a substantial market for high-performance concrete protection and repair mortars. Furthermore, the burgeoning interest in prefabricated and modular construction methods favors the use of precisely formulated dry mix mortars that ensure consistency and speed on-site. Untapped rural markets with increasing construction activities also represent potential growth areas. The development of eco-friendly and low-VOC (Volatile Organic Compound) dry mix mortar formulations will cater to the growing environmental consciousness among consumers and developers.
Growth Accelerators in the ASEAN Dry Mix Mortar Industry Industry
Several factors are accelerating the long-term growth of the ASEAN dry mix mortar industry. Technological breakthroughs in developing advanced admixtures and binders that enhance the performance and sustainability of mortars are key catalysts. Strategic partnerships between raw material suppliers, manufacturers, and construction firms are streamlining the supply chain and fostering innovation. Market expansion strategies, including the penetration into underserved geographical areas within ASEAN and the development of product lines tailored to specific local construction needs, are crucial growth drivers. The increasing adoption of digital technologies in construction, such as BIM (Building Information Modeling), will further facilitate the precise application and specification of dry mix mortars, driving their demand. Investments in research and development to create novel applications and improve existing products will continue to fuel market expansion.
Key Players Shaping the ASEAN Dry Mix Mortar Industry Market
- Henkel AG & Co KGaA
- Greco Asia Sdn Bhd
- PT INDOCEMENT TUNGGAL PRAKARSA Tbk
- Knauf Gips KG
- Sika AG
- Ardex Group
- MAPEI S p A
- LATICRETE International Inc
- HOLCIM
- Saint Gobain
- 3M
- Siam City Cement Group
- BASF SE
Notable Milestones in ASEAN Dry Mix Mortar Industry Sector
- 2021/2022: Significant investments by major players in expanding manufacturing capacities in Indonesia and Vietnam to meet growing regional demand.
- 2022/2023: Launch of new product lines focusing on sustainable and eco-friendly dry mix mortars with reduced carbon footprints by leading global manufacturers.
- 2023: Increased M&A activity, with regional players acquiring smaller manufacturers to consolidate market share and expand distribution networks across ASEAN.
- 2024: Introduction of advanced polymer-modified tile adhesives offering enhanced flexibility and rapid curing properties in the Philippine market.
- 2024: Key companies focusing on the development and promotion of dry mix mortar solutions for façade insulation systems in response to growing demand for energy-efficient buildings in Thailand and Singapore.
In-Depth ASEAN Dry Mix Mortar Industry Market Outlook
The ASEAN dry mix mortar industry is projected to experience sustained and robust growth, driven by the region's dynamic economic development and escalating construction activities. Future market potential is significantly influenced by increasing urbanization, ongoing large-scale infrastructure projects, and a rising preference for high-quality, sustainable building materials. Strategic opportunities lie in further developing specialized product segments such as advanced waterproofing solutions, high-performance repair mortars, and innovative insulation systems. The industry's ability to adapt to evolving building codes, embrace digital transformation in construction, and consistently deliver products that meet stringent environmental and performance standards will be crucial for unlocking future growth. The focus will remain on technological innovation, supply chain optimization, and strategic market penetration to capitalize on the burgeoning demand for modern construction materials across Southeast Asia.
ASEAN Dry Mix Mortar Industry Segmentation
-
1. End-user Industry
- 1.1. Residential
-
1.2. Non-residential
- 1.2.1. Commercial
- 1.2.2. Infrastructure
- 1.2.3. Industrial
-
2. Application
- 2.1. Plaster
- 2.2. Render
- 2.3. Tile Adhesive
- 2.4. Grout
- 2.5. Water Proofing Slurry
- 2.6. Concrete Protection and Renovation
- 2.7. Insulation and Finishing Systems
- 2.8. Other Ap
-
3. Geography
- 3.1. Malaysia
- 3.2. Indonesia
- 3.3. Thailand
- 3.4. Singapore
- 3.5. Philippines
- 3.6. Vietnam
- 3.7. Myanmar
- 3.8. Rest of ASEAN Countries
ASEAN Dry Mix Mortar Industry Segmentation By Geography
- 1. Malaysia
- 2. Indonesia
- 3. Thailand
- 4. Singapore
- 5. Philippines
- 6. Vietnam
- 7. Myanmar
- 8. Rest of ASEAN Countries
ASEAN Dry Mix Mortar Industry Regional Market Share
Geographic Coverage of ASEAN Dry Mix Mortar Industry
ASEAN Dry Mix Mortar Industry REPORT HIGHLIGHTS
| Aspects | Details |
|---|---|
| Study Period | 2020-2034 |
| Base Year | 2025 |
| Estimated Year | 2026 |
| Forecast Period | 2026-2034 |
| Historical Period | 2020-2025 |
| Growth Rate | CAGR of 7% from 2020-2034 |
| Segmentation |
|
Table of Contents
- 1. Introduction
- 1.1. Research Scope
- 1.2. Market Segmentation
- 1.3. Research Objective
- 1.4. Definitions and Assumptions
- 2. Executive Summary
- 2.1. Market Snapshot
- 3. Market Dynamics
- 3.1. Market Drivers
- 3.2. Market Restrains
- 3.3. Market Trends
- 3.4. Market Opportunities
- 4. Market Factor Analysis
- 4.1. Porters Five Forces
- 4.1.1. Bargaining Power of Suppliers
- 4.1.2. Bargaining Power of Buyers
- 4.1.3. Threat of New Entrants
- 4.1.4. Threat of Substitutes
- 4.1.5. Competitive Rivalry
- 4.2. PESTEL analysis
- 4.3. BCG Analysis
- 4.3.1. Stars (High Growth, High Market Share)
- 4.3.2. Cash Cows (Low Growth, High Market Share)
- 4.3.3. Question Mark (High Growth, Low Market Share)
- 4.3.4. Dogs (Low Growth, Low Market Share)
- 4.4. Ansoff Matrix Analysis
- 4.5. Supply Chain Analysis
- 4.6. Regulatory Landscape
- 4.7. Current Market Potential and Opportunity Assessment (TAM–SAM–SOM Framework)
- 4.8. VDR Analyst Note
- 4.1. Porters Five Forces
- 5. Market Analysis, Insights and Forecast 2021-2033
- 5.1. Market Analysis, Insights and Forecast - by End-user Industry
- 5.1.1. Residential
- 5.1.2. Non-residential
- 5.1.2.1. Commercial
- 5.1.2.2. Infrastructure
- 5.1.2.3. Industrial
- 5.2. Market Analysis, Insights and Forecast - by Application
- 5.2.1. Plaster
- 5.2.2. Render
- 5.2.3. Tile Adhesive
- 5.2.4. Grout
- 5.2.5. Water Proofing Slurry
- 5.2.6. Concrete Protection and Renovation
- 5.2.7. Insulation and Finishing Systems
- 5.2.8. Other Ap
- 5.3. Market Analysis, Insights and Forecast - by Geography
- 5.3.1. Malaysia
- 5.3.2. Indonesia
- 5.3.3. Thailand
- 5.3.4. Singapore
- 5.3.5. Philippines
- 5.3.6. Vietnam
- 5.3.7. Myanmar
- 5.3.8. Rest of ASEAN Countries
- 5.4. Market Analysis, Insights and Forecast - by Region
- 5.4.1. Malaysia
- 5.4.2. Indonesia
- 5.4.3. Thailand
- 5.4.4. Singapore
- 5.4.5. Philippines
- 5.4.6. Vietnam
- 5.4.7. Myanmar
- 5.4.8. Rest of ASEAN Countries
- 5.1. Market Analysis, Insights and Forecast - by End-user Industry
- 6. ASEAN Dry Mix Mortar Industry Analysis, Insights and Forecast, 2021-2033
- 6.1. Market Analysis, Insights and Forecast - by End-user Industry
- 6.1.1. Residential
- 6.1.2. Non-residential
- 6.1.2.1. Commercial
- 6.1.2.2. Infrastructure
- 6.1.2.3. Industrial
- 6.2. Market Analysis, Insights and Forecast - by Application
- 6.2.1. Plaster
- 6.2.2. Render
- 6.2.3. Tile Adhesive
- 6.2.4. Grout
- 6.2.5. Water Proofing Slurry
- 6.2.6. Concrete Protection and Renovation
- 6.2.7. Insulation and Finishing Systems
- 6.2.8. Other Ap
- 6.3. Market Analysis, Insights and Forecast - by Geography
- 6.3.1. Malaysia
- 6.3.2. Indonesia
- 6.3.3. Thailand
- 6.3.4. Singapore
- 6.3.5. Philippines
- 6.3.6. Vietnam
- 6.3.7. Myanmar
- 6.3.8. Rest of ASEAN Countries
- 6.1. Market Analysis, Insights and Forecast - by End-user Industry
- 7. Malaysia ASEAN Dry Mix Mortar Industry Analysis, Insights and Forecast, 2021-2033
- 7.1. Market Analysis, Insights and Forecast - by End-user Industry
- 7.1.1. Residential
- 7.1.2. Non-residential
- 7.1.2.1. Commercial
- 7.1.2.2. Infrastructure
- 7.1.2.3. Industrial
- 7.2. Market Analysis, Insights and Forecast - by Application
- 7.2.1. Plaster
- 7.2.2. Render
- 7.2.3. Tile Adhesive
- 7.2.4. Grout
- 7.2.5. Water Proofing Slurry
- 7.2.6. Concrete Protection and Renovation
- 7.2.7. Insulation and Finishing Systems
- 7.2.8. Other Ap
- 7.3. Market Analysis, Insights and Forecast - by Geography
- 7.3.1. Malaysia
- 7.3.2. Indonesia
- 7.3.3. Thailand
- 7.3.4. Singapore
- 7.3.5. Philippines
- 7.3.6. Vietnam
- 7.3.7. Myanmar
- 7.3.8. Rest of ASEAN Countries
- 7.1. Market Analysis, Insights and Forecast - by End-user Industry
- 8. Indonesia ASEAN Dry Mix Mortar Industry Analysis, Insights and Forecast, 2021-2033
- 8.1. Market Analysis, Insights and Forecast - by End-user Industry
- 8.1.1. Residential
- 8.1.2. Non-residential
- 8.1.2.1. Commercial
- 8.1.2.2. Infrastructure
- 8.1.2.3. Industrial
- 8.2. Market Analysis, Insights and Forecast - by Application
- 8.2.1. Plaster
- 8.2.2. Render
- 8.2.3. Tile Adhesive
- 8.2.4. Grout
- 8.2.5. Water Proofing Slurry
- 8.2.6. Concrete Protection and Renovation
- 8.2.7. Insulation and Finishing Systems
- 8.2.8. Other Ap
- 8.3. Market Analysis, Insights and Forecast - by Geography
- 8.3.1. Malaysia
- 8.3.2. Indonesia
- 8.3.3. Thailand
- 8.3.4. Singapore
- 8.3.5. Philippines
- 8.3.6. Vietnam
- 8.3.7. Myanmar
- 8.3.8. Rest of ASEAN Countries
- 8.1. Market Analysis, Insights and Forecast - by End-user Industry
- 9. Thailand ASEAN Dry Mix Mortar Industry Analysis, Insights and Forecast, 2021-2033
- 9.1. Market Analysis, Insights and Forecast - by End-user Industry
- 9.1.1. Residential
- 9.1.2. Non-residential
- 9.1.2.1. Commercial
- 9.1.2.2. Infrastructure
- 9.1.2.3. Industrial
- 9.2. Market Analysis, Insights and Forecast - by Application
- 9.2.1. Plaster
- 9.2.2. Render
- 9.2.3. Tile Adhesive
- 9.2.4. Grout
- 9.2.5. Water Proofing Slurry
- 9.2.6. Concrete Protection and Renovation
- 9.2.7. Insulation and Finishing Systems
- 9.2.8. Other Ap
- 9.3. Market Analysis, Insights and Forecast - by Geography
- 9.3.1. Malaysia
- 9.3.2. Indonesia
- 9.3.3. Thailand
- 9.3.4. Singapore
- 9.3.5. Philippines
- 9.3.6. Vietnam
- 9.3.7. Myanmar
- 9.3.8. Rest of ASEAN Countries
- 9.1. Market Analysis, Insights and Forecast - by End-user Industry
- 10. Singapore ASEAN Dry Mix Mortar Industry Analysis, Insights and Forecast, 2021-2033
- 10.1. Market Analysis, Insights and Forecast - by End-user Industry
- 10.1.1. Residential
- 10.1.2. Non-residential
- 10.1.2.1. Commercial
- 10.1.2.2. Infrastructure
- 10.1.2.3. Industrial
- 10.2. Market Analysis, Insights and Forecast - by Application
- 10.2.1. Plaster
- 10.2.2. Render
- 10.2.3. Tile Adhesive
- 10.2.4. Grout
- 10.2.5. Water Proofing Slurry
- 10.2.6. Concrete Protection and Renovation
- 10.2.7. Insulation and Finishing Systems
- 10.2.8. Other Ap
- 10.3. Market Analysis, Insights and Forecast - by Geography
- 10.3.1. Malaysia
- 10.3.2. Indonesia
- 10.3.3. Thailand
- 10.3.4. Singapore
- 10.3.5. Philippines
- 10.3.6. Vietnam
- 10.3.7. Myanmar
- 10.3.8. Rest of ASEAN Countries
- 10.1. Market Analysis, Insights and Forecast - by End-user Industry
- 11. Philippines ASEAN Dry Mix Mortar Industry Analysis, Insights and Forecast, 2021-2033
- 11.1. Market Analysis, Insights and Forecast - by End-user Industry
- 11.1.1. Residential
- 11.1.2. Non-residential
- 11.1.2.1. Commercial
- 11.1.2.2. Infrastructure
- 11.1.2.3. Industrial
- 11.2. Market Analysis, Insights and Forecast - by Application
- 11.2.1. Plaster
- 11.2.2. Render
- 11.2.3. Tile Adhesive
- 11.2.4. Grout
- 11.2.5. Water Proofing Slurry
- 11.2.6. Concrete Protection and Renovation
- 11.2.7. Insulation and Finishing Systems
- 11.2.8. Other Ap
- 11.3. Market Analysis, Insights and Forecast - by Geography
- 11.3.1. Malaysia
- 11.3.2. Indonesia
- 11.3.3. Thailand
- 11.3.4. Singapore
- 11.3.5. Philippines
- 11.3.6. Vietnam
- 11.3.7. Myanmar
- 11.3.8. Rest of ASEAN Countries
- 11.1. Market Analysis, Insights and Forecast - by End-user Industry
- 12. Vietnam ASEAN Dry Mix Mortar Industry Analysis, Insights and Forecast, 2021-2033
- 12.1. Market Analysis, Insights and Forecast - by End-user Industry
- 12.1.1. Residential
- 12.1.2. Non-residential
- 12.1.2.1. Commercial
- 12.1.2.2. Infrastructure
- 12.1.2.3. Industrial
- 12.2. Market Analysis, Insights and Forecast - by Application
- 12.2.1. Plaster
- 12.2.2. Render
- 12.2.3. Tile Adhesive
- 12.2.4. Grout
- 12.2.5. Water Proofing Slurry
- 12.2.6. Concrete Protection and Renovation
- 12.2.7. Insulation and Finishing Systems
- 12.2.8. Other Ap
- 12.3. Market Analysis, Insights and Forecast - by Geography
- 12.3.1. Malaysia
- 12.3.2. Indonesia
- 12.3.3. Thailand
- 12.3.4. Singapore
- 12.3.5. Philippines
- 12.3.6. Vietnam
- 12.3.7. Myanmar
- 12.3.8. Rest of ASEAN Countries
- 12.1. Market Analysis, Insights and Forecast - by End-user Industry
- 13. Myanmar ASEAN Dry Mix Mortar Industry Analysis, Insights and Forecast, 2021-2033
- 13.1. Market Analysis, Insights and Forecast - by End-user Industry
- 13.1.1. Residential
- 13.1.2. Non-residential
- 13.1.2.1. Commercial
- 13.1.2.2. Infrastructure
- 13.1.2.3. Industrial
- 13.2. Market Analysis, Insights and Forecast - by Application
- 13.2.1. Plaster
- 13.2.2. Render
- 13.2.3. Tile Adhesive
- 13.2.4. Grout
- 13.2.5. Water Proofing Slurry
- 13.2.6. Concrete Protection and Renovation
- 13.2.7. Insulation and Finishing Systems
- 13.2.8. Other Ap
- 13.3. Market Analysis, Insights and Forecast - by Geography
- 13.3.1. Malaysia
- 13.3.2. Indonesia
- 13.3.3. Thailand
- 13.3.4. Singapore
- 13.3.5. Philippines
- 13.3.6. Vietnam
- 13.3.7. Myanmar
- 13.3.8. Rest of ASEAN Countries
- 13.1. Market Analysis, Insights and Forecast - by End-user Industry
- 14. Rest of ASEAN Countries ASEAN Dry Mix Mortar Industry Analysis, Insights and Forecast, 2021-2033
- 14.1. Market Analysis, Insights and Forecast - by End-user Industry
- 14.1.1. Residential
- 14.1.2. Non-residential
- 14.1.2.1. Commercial
- 14.1.2.2. Infrastructure
- 14.1.2.3. Industrial
- 14.2. Market Analysis, Insights and Forecast - by Application
- 14.2.1. Plaster
- 14.2.2. Render
- 14.2.3. Tile Adhesive
- 14.2.4. Grout
- 14.2.5. Water Proofing Slurry
- 14.2.6. Concrete Protection and Renovation
- 14.2.7. Insulation and Finishing Systems
- 14.2.8. Other Ap
- 14.3. Market Analysis, Insights and Forecast - by Geography
- 14.3.1. Malaysia
- 14.3.2. Indonesia
- 14.3.3. Thailand
- 14.3.4. Singapore
- 14.3.5. Philippines
- 14.3.6. Vietnam
- 14.3.7. Myanmar
- 14.3.8. Rest of ASEAN Countries
- 14.1. Market Analysis, Insights and Forecast - by End-user Industry
- 15. Competitive Analysis
- 15.1. Company Profiles
- 15.1.1 Henkel AG & Co KGaA
- 15.1.1.1. Company Overview
- 15.1.1.2. Products
- 15.1.1.3. Company Financials
- 15.1.1.4. SWOT Analysis
- 15.1.2 Greco Asia Sdn Bhd
- 15.1.2.1. Company Overview
- 15.1.2.2. Products
- 15.1.2.3. Company Financials
- 15.1.2.4. SWOT Analysis
- 15.1.3 PT INDOCEMENT TUNGGAL PRAKARSA Tbk
- 15.1.3.1. Company Overview
- 15.1.3.2. Products
- 15.1.3.3. Company Financials
- 15.1.3.4. SWOT Analysis
- 15.1.4 Knauf Gips KG
- 15.1.4.1. Company Overview
- 15.1.4.2. Products
- 15.1.4.3. Company Financials
- 15.1.4.4. SWOT Analysis
- 15.1.5 Sika AG*List Not Exhaustive
- 15.1.5.1. Company Overview
- 15.1.5.2. Products
- 15.1.5.3. Company Financials
- 15.1.5.4. SWOT Analysis
- 15.1.6 Ardex Group
- 15.1.6.1. Company Overview
- 15.1.6.2. Products
- 15.1.6.3. Company Financials
- 15.1.6.4. SWOT Analysis
- 15.1.7 MAPEI S p A
- 15.1.7.1. Company Overview
- 15.1.7.2. Products
- 15.1.7.3. Company Financials
- 15.1.7.4. SWOT Analysis
- 15.1.8 LATICRETE International Inc
- 15.1.8.1. Company Overview
- 15.1.8.2. Products
- 15.1.8.3. Company Financials
- 15.1.8.4. SWOT Analysis
- 15.1.9 HOLCIM
- 15.1.9.1. Company Overview
- 15.1.9.2. Products
- 15.1.9.3. Company Financials
- 15.1.9.4. SWOT Analysis
- 15.1.10 Saint Gobain
- 15.1.10.1. Company Overview
- 15.1.10.2. Products
- 15.1.10.3. Company Financials
- 15.1.10.4. SWOT Analysis
- 15.1.11 3M
- 15.1.11.1. Company Overview
- 15.1.11.2. Products
- 15.1.11.3. Company Financials
- 15.1.11.4. SWOT Analysis
- 15.1.12 Siam City Cement Group
- 15.1.12.1. Company Overview
- 15.1.12.2. Products
- 15.1.12.3. Company Financials
- 15.1.12.4. SWOT Analysis
- 15.1.13 BASF SE
- 15.1.13.1. Company Overview
- 15.1.13.2. Products
- 15.1.13.3. Company Financials
- 15.1.13.4. SWOT Analysis
- 15.1.1 Henkel AG & Co KGaA
- 15.2. Market Entropy
- 15.2.1 Company's Key Areas Served
- 15.2.2 Recent Developments
- 15.3. Company Market Share Analysis 2025
- 15.3.1 Top 5 Companies Market Share Analysis
- 15.3.2 Top 3 Companies Market Share Analysis
- 15.4. List of Potential Customers
- 16. Research Methodology
List of Figures
- Figure 1: ASEAN Dry Mix Mortar Industry Revenue Breakdown (billion, %) by Product 2025 & 2033
- Figure 2: ASEAN Dry Mix Mortar Industry Share (%) by Company 2025
List of Tables
- Table 1: ASEAN Dry Mix Mortar Industry Revenue billion Forecast, by End-user Industry 2020 & 2033
- Table 2: ASEAN Dry Mix Mortar Industry Volume Million Forecast, by End-user Industry 2020 & 2033
- Table 3: ASEAN Dry Mix Mortar Industry Revenue billion Forecast, by Application 2020 & 2033
- Table 4: ASEAN Dry Mix Mortar Industry Volume Million Forecast, by Application 2020 & 2033
- Table 5: ASEAN Dry Mix Mortar Industry Revenue billion Forecast, by Geography 2020 & 2033
- Table 6: ASEAN Dry Mix Mortar Industry Volume Million Forecast, by Geography 2020 & 2033
- Table 7: ASEAN Dry Mix Mortar Industry Revenue billion Forecast, by Region 2020 & 2033
- Table 8: ASEAN Dry Mix Mortar Industry Volume Million Forecast, by Region 2020 & 2033
- Table 9: ASEAN Dry Mix Mortar Industry Revenue billion Forecast, by End-user Industry 2020 & 2033
- Table 10: ASEAN Dry Mix Mortar Industry Volume Million Forecast, by End-user Industry 2020 & 2033
- Table 11: ASEAN Dry Mix Mortar Industry Revenue billion Forecast, by Application 2020 & 2033
- Table 12: ASEAN Dry Mix Mortar Industry Volume Million Forecast, by Application 2020 & 2033
- Table 13: ASEAN Dry Mix Mortar Industry Revenue billion Forecast, by Geography 2020 & 2033
- Table 14: ASEAN Dry Mix Mortar Industry Volume Million Forecast, by Geography 2020 & 2033
- Table 15: ASEAN Dry Mix Mortar Industry Revenue billion Forecast, by Country 2020 & 2033
- Table 16: ASEAN Dry Mix Mortar Industry Volume Million Forecast, by Country 2020 & 2033
- Table 17: ASEAN Dry Mix Mortar Industry Revenue billion Forecast, by End-user Industry 2020 & 2033
- Table 18: ASEAN Dry Mix Mortar Industry Volume Million Forecast, by End-user Industry 2020 & 2033
- Table 19: ASEAN Dry Mix Mortar Industry Revenue billion Forecast, by Application 2020 & 2033
- Table 20: ASEAN Dry Mix Mortar Industry Volume Million Forecast, by Application 2020 & 2033
- Table 21: ASEAN Dry Mix Mortar Industry Revenue billion Forecast, by Geography 2020 & 2033
- Table 22: ASEAN Dry Mix Mortar Industry Volume Million Forecast, by Geography 2020 & 2033
- Table 23: ASEAN Dry Mix Mortar Industry Revenue billion Forecast, by Country 2020 & 2033
- Table 24: ASEAN Dry Mix Mortar Industry Volume Million Forecast, by Country 2020 & 2033
- Table 25: ASEAN Dry Mix Mortar Industry Revenue billion Forecast, by End-user Industry 2020 & 2033
- Table 26: ASEAN Dry Mix Mortar Industry Volume Million Forecast, by End-user Industry 2020 & 2033
- Table 27: ASEAN Dry Mix Mortar Industry Revenue billion Forecast, by Application 2020 & 2033
- Table 28: ASEAN Dry Mix Mortar Industry Volume Million Forecast, by Application 2020 & 2033
- Table 29: ASEAN Dry Mix Mortar Industry Revenue billion Forecast, by Geography 2020 & 2033
- Table 30: ASEAN Dry Mix Mortar Industry Volume Million Forecast, by Geography 2020 & 2033
- Table 31: ASEAN Dry Mix Mortar Industry Revenue billion Forecast, by Country 2020 & 2033
- Table 32: ASEAN Dry Mix Mortar Industry Volume Million Forecast, by Country 2020 & 2033
- Table 33: ASEAN Dry Mix Mortar Industry Revenue billion Forecast, by End-user Industry 2020 & 2033
- Table 34: ASEAN Dry Mix Mortar Industry Volume Million Forecast, by End-user Industry 2020 & 2033
- Table 35: ASEAN Dry Mix Mortar Industry Revenue billion Forecast, by Application 2020 & 2033
- Table 36: ASEAN Dry Mix Mortar Industry Volume Million Forecast, by Application 2020 & 2033
- Table 37: ASEAN Dry Mix Mortar Industry Revenue billion Forecast, by Geography 2020 & 2033
- Table 38: ASEAN Dry Mix Mortar Industry Volume Million Forecast, by Geography 2020 & 2033
- Table 39: ASEAN Dry Mix Mortar Industry Revenue billion Forecast, by Country 2020 & 2033
- Table 40: ASEAN Dry Mix Mortar Industry Volume Million Forecast, by Country 2020 & 2033
- Table 41: ASEAN Dry Mix Mortar Industry Revenue billion Forecast, by End-user Industry 2020 & 2033
- Table 42: ASEAN Dry Mix Mortar Industry Volume Million Forecast, by End-user Industry 2020 & 2033
- Table 43: ASEAN Dry Mix Mortar Industry Revenue billion Forecast, by Application 2020 & 2033
- Table 44: ASEAN Dry Mix Mortar Industry Volume Million Forecast, by Application 2020 & 2033
- Table 45: ASEAN Dry Mix Mortar Industry Revenue billion Forecast, by Geography 2020 & 2033
- Table 46: ASEAN Dry Mix Mortar Industry Volume Million Forecast, by Geography 2020 & 2033
- Table 47: ASEAN Dry Mix Mortar Industry Revenue billion Forecast, by Country 2020 & 2033
- Table 48: ASEAN Dry Mix Mortar Industry Volume Million Forecast, by Country 2020 & 2033
- Table 49: ASEAN Dry Mix Mortar Industry Revenue billion Forecast, by End-user Industry 2020 & 2033
- Table 50: ASEAN Dry Mix Mortar Industry Volume Million Forecast, by End-user Industry 2020 & 2033
- Table 51: ASEAN Dry Mix Mortar Industry Revenue billion Forecast, by Application 2020 & 2033
- Table 52: ASEAN Dry Mix Mortar Industry Volume Million Forecast, by Application 2020 & 2033
- Table 53: ASEAN Dry Mix Mortar Industry Revenue billion Forecast, by Geography 2020 & 2033
- Table 54: ASEAN Dry Mix Mortar Industry Volume Million Forecast, by Geography 2020 & 2033
- Table 55: ASEAN Dry Mix Mortar Industry Revenue billion Forecast, by Country 2020 & 2033
- Table 56: ASEAN Dry Mix Mortar Industry Volume Million Forecast, by Country 2020 & 2033
- Table 57: ASEAN Dry Mix Mortar Industry Revenue billion Forecast, by End-user Industry 2020 & 2033
- Table 58: ASEAN Dry Mix Mortar Industry Volume Million Forecast, by End-user Industry 2020 & 2033
- Table 59: ASEAN Dry Mix Mortar Industry Revenue billion Forecast, by Application 2020 & 2033
- Table 60: ASEAN Dry Mix Mortar Industry Volume Million Forecast, by Application 2020 & 2033
- Table 61: ASEAN Dry Mix Mortar Industry Revenue billion Forecast, by Geography 2020 & 2033
- Table 62: ASEAN Dry Mix Mortar Industry Volume Million Forecast, by Geography 2020 & 2033
- Table 63: ASEAN Dry Mix Mortar Industry Revenue billion Forecast, by Country 2020 & 2033
- Table 64: ASEAN Dry Mix Mortar Industry Volume Million Forecast, by Country 2020 & 2033
- Table 65: ASEAN Dry Mix Mortar Industry Revenue billion Forecast, by End-user Industry 2020 & 2033
- Table 66: ASEAN Dry Mix Mortar Industry Volume Million Forecast, by End-user Industry 2020 & 2033
- Table 67: ASEAN Dry Mix Mortar Industry Revenue billion Forecast, by Application 2020 & 2033
- Table 68: ASEAN Dry Mix Mortar Industry Volume Million Forecast, by Application 2020 & 2033
- Table 69: ASEAN Dry Mix Mortar Industry Revenue billion Forecast, by Geography 2020 & 2033
- Table 70: ASEAN Dry Mix Mortar Industry Volume Million Forecast, by Geography 2020 & 2033
- Table 71: ASEAN Dry Mix Mortar Industry Revenue billion Forecast, by Country 2020 & 2033
- Table 72: ASEAN Dry Mix Mortar Industry Volume Million Forecast, by Country 2020 & 2033
Frequently Asked Questions
1. What is the projected Compound Annual Growth Rate (CAGR) of the ASEAN Dry Mix Mortar Industry?
The projected CAGR is approximately 7%.
2. Which companies are prominent players in the ASEAN Dry Mix Mortar Industry?
Key companies in the market include Henkel AG & Co KGaA, Greco Asia Sdn Bhd, PT INDOCEMENT TUNGGAL PRAKARSA Tbk, Knauf Gips KG, Sika AG*List Not Exhaustive, Ardex Group, MAPEI S p A, LATICRETE International Inc, HOLCIM, Saint Gobain, 3M, Siam City Cement Group, BASF SE.
3. What are the main segments of the ASEAN Dry Mix Mortar Industry?
The market segments include End-user Industry, Application, Geography.
4. Can you provide details about the market size?
The market size is estimated to be USD 2.68 billion as of 2022.
5. What are some drivers contributing to market growth?
Long-term Cost-effectiveness in the Construction Industry; Increasing Construction Activities in ASEAN Countries; Other Drivers.
6. What are the notable trends driving market growth?
Non-residential End-user segment to Dominate the Market.
7. Are there any restraints impacting market growth?
Laying Cost of Dry Mix Mortar. in Comparison to Conventional Mortar; Other Restraints.
8. Can you provide examples of recent developments in the market?
The recent developments pertaining to the major players in the market are being covered in the complete study.
9. What pricing options are available for accessing the report?
Pricing options include single-user, multi-user, and enterprise licenses priced at USD 3800, USD 4500, and USD 5800 respectively.
10. Is the market size provided in terms of value or volume?
The market size is provided in terms of value, measured in billion and volume, measured in Million.
11. Are there any specific market keywords associated with the report?
Yes, the market keyword associated with the report is "ASEAN Dry Mix Mortar Industry," which aids in identifying and referencing the specific market segment covered.
12. How do I determine which pricing option suits my needs best?
The pricing options vary based on user requirements and access needs. Individual users may opt for single-user licenses, while businesses requiring broader access may choose multi-user or enterprise licenses for cost-effective access to the report.
13. Are there any additional resources or data provided in the ASEAN Dry Mix Mortar Industry report?
While the report offers comprehensive insights, it's advisable to review the specific contents or supplementary materials provided to ascertain if additional resources or data are available.
14. How can I stay updated on further developments or reports in the ASEAN Dry Mix Mortar Industry?
To stay informed about further developments, trends, and reports in the ASEAN Dry Mix Mortar Industry, consider subscribing to industry newsletters, following relevant companies and organizations, or regularly checking reputable industry news sources and publications.
Methodology
Step 1 - Identification of Relevant Samples Size from Population Database


Step 2 - Approaches for Defining Global Market Size (Value, Volume* & Price*)

Note*: In applicable scenarios
Step 3 - Data Sources
Primary Research
- Web Analytics
- Survey Reports
- Research Institute
- Latest Research Reports
- Opinion Leaders
Secondary Research
- Annual Reports
- White Paper
- Latest Press Release
- Industry Association
- Paid Database
- Investor Presentations

Step 4 - Data Triangulation
Involves using different sources of information in order to increase the validity of a study
These sources are likely to be stakeholders in a program - participants, other researchers, program staff, other community members, and so on.
Then we put all data in single framework & apply various statistical tools to find out the dynamic on the market.
During the analysis stage, feedback from the stakeholder groups would be compared to determine areas of agreement as well as areas of divergence