

Key Insights
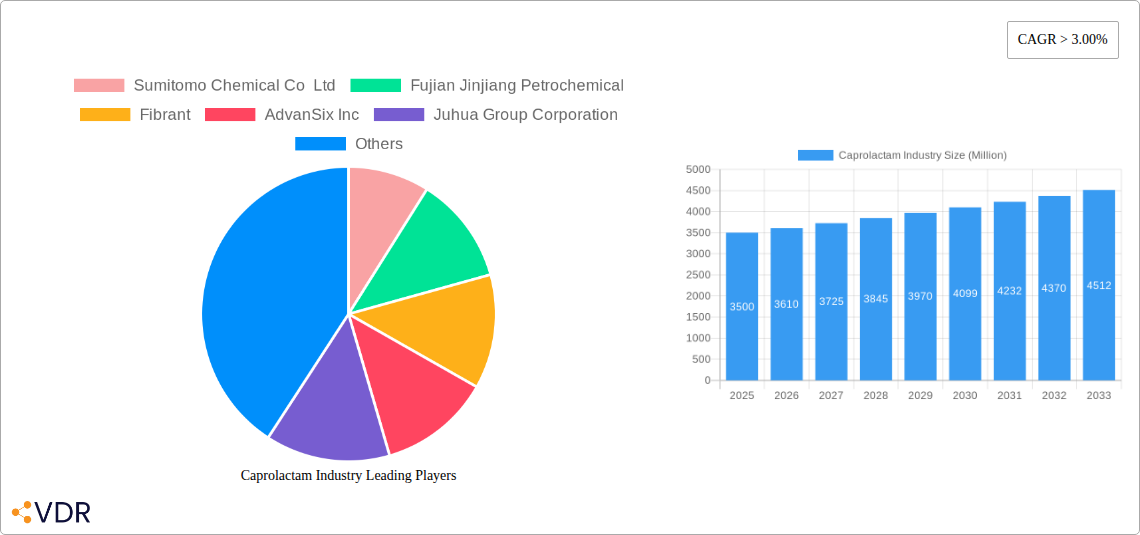
The Caprolactam industry is poised for steady growth, projected to expand at a Compound Annual Growth Rate (CAGR) exceeding 3.00% over the forecast period of 2025-2033. This expansion is fueled by robust demand from key end-user industries, primarily automotive, textiles, and carpeting. The market's value, currently estimated to be substantial and in the hundreds of millions of US dollars, is significantly driven by the increasing consumption of Nylon 6 resins and fibers, which are integral to these sectors. Innovations in polymer science and material engineering continue to enhance the properties of Nylon 6, making it a preferred choice for various high-performance applications, from lightweight automotive components to durable industrial yarns. The accessibility and cost-effectiveness of raw materials like Phenol and Cyclohexane also play a crucial role in sustaining this growth trajectory, ensuring a consistent supply chain for manufacturers.
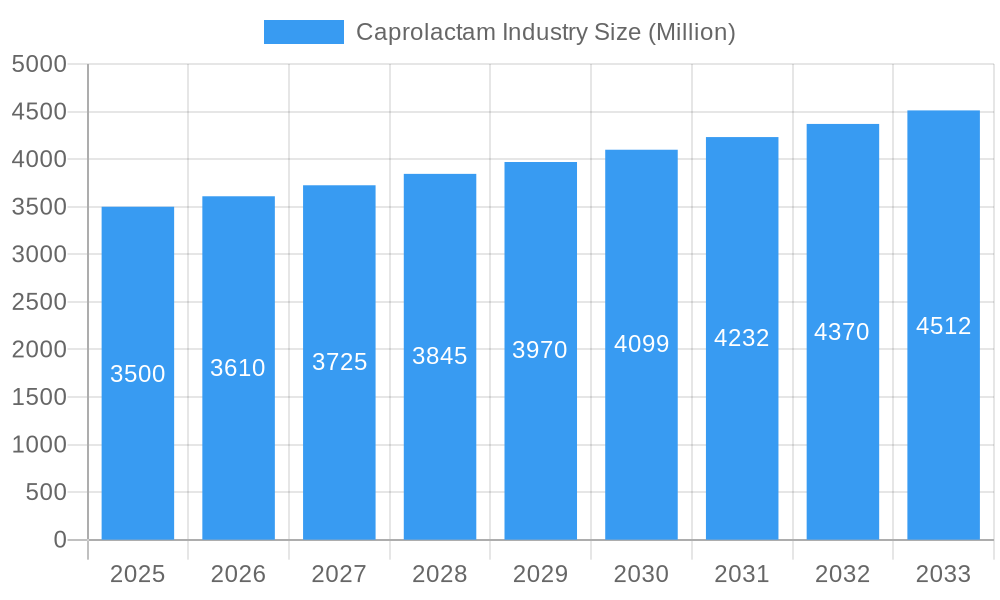
Caprolactam Industry Market Size (In Billion)
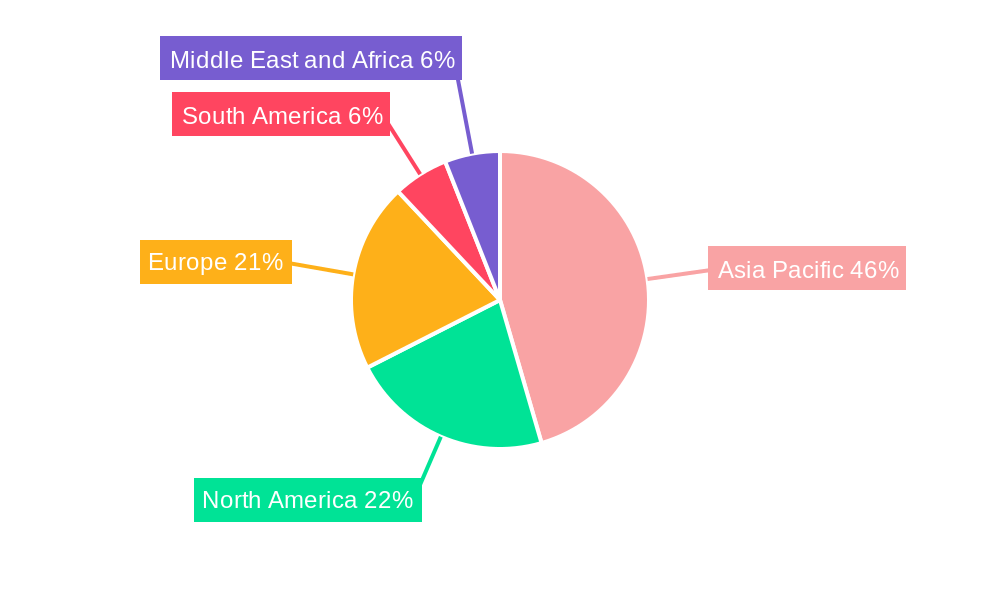
The global Caprolactam market is characterized by dynamic regional contributions, with Asia Pacific leading in both production and consumption, driven by the burgeoning manufacturing sectors in China and other developing economies. North America and Europe remain significant markets, with a strong focus on high-value applications and sustainability initiatives. Restraints, such as fluctuations in raw material prices and increasing environmental regulations, are being addressed through technological advancements and a growing emphasis on circular economy principles. Companies are actively investing in research and development to optimize production processes, reduce environmental impact, and develop novel caprolactam derivatives. The competitive landscape features established global players and emerging regional manufacturers, all vying for market share by focusing on product quality, innovation, and strategic partnerships. The outlook for the caprolactam industry remains positive, driven by its indispensable role in numerous essential products and its adaptability to evolving market demands.
Caprolactam Industry Company Market Share
This in-depth report offers a detailed examination of the global caprolactam market, covering its intricate dynamics, growth trajectories, and future potential from 2019 to 2033. With a base year of 2025, the analysis encompasses historical performance, current market conditions, and projected trends through 2033. We provide critical insights into market segmentation, key player strategies, and emerging opportunities, making this an essential resource for industry professionals, investors, and stakeholders seeking to navigate the evolving caprolactam landscape. The report highlights the parent market of Nylon 6 and its extensive derivative markets, ensuring a holistic understanding of the value chain. All quantitative values are presented in Million units.
Caprolactam Industry Market Dynamics & Structure
The global caprolactam market is characterized by a moderate concentration, with a few key players dominating production capacity. Technological innovation remains a significant driver, particularly in process efficiency and sustainability, though high capital investment can act as a barrier to entry for new entrants. Robust regulatory frameworks, especially concerning environmental compliance and safety standards, shape market operations. While competitive product substitutes exist, the unique properties of Nylon 6 resins and fibers maintain strong demand. End-user demographics show a growing reliance on the automotive and textile sectors, influencing market demand patterns. Mergers and acquisitions (M&A) activity, though sporadic, can significantly alter market share and competitive dynamics.
- Market Concentration: Dominated by a mix of large integrated petrochemical companies and specialized caprolactam producers.
- Technological Innovation: Focus on enhancing yield, reducing energy consumption, and developing bio-based alternatives.
- Regulatory Frameworks: Stringent environmental regulations in developed regions and evolving standards in emerging economies.
- Competitive Product Substitutes: While Nylon 6 holds its ground, competition from other polymers like PET and PP exists in certain applications.
- End-User Demographics: Shifting consumer preferences towards sustainable and durable materials impacting demand in textiles and automotive interiors.
- M&A Trends: Strategic acquisitions aimed at securing raw material supply, expanding geographical reach, or consolidating market position. For example, a recent undisclosed acquisition saw a mid-sized player integrate into a larger chemical conglomerate, adding approximately 150,000 tons/year of capacity to the parent company's portfolio.
Caprolactam Industry Growth Trends & Insights
The caprolactam industry is poised for steady growth, driven by expanding applications in engineering plastics and textiles, coupled with increasing demand from the automotive sector for lightweight and durable components. The market size is projected to witness a Compound Annual Growth Rate (CAGR) of approximately 4.5% during the forecast period (2025-2033), expanding from an estimated XX Million units in 2025 to XX Million units by 2033. Adoption rates for Nylon 6 in high-performance applications are steadily rising, fueled by its superior mechanical strength, thermal resistance, and chemical inertness. Technological disruptions, such as advancements in catalyst technology and process optimization, are enhancing production efficiency and reducing costs, further stimulating market penetration. Consumer behavior shifts towards sustainability are indirectly benefiting caprolactam as Nylon 6 offers durability and recyclability potential. The parent market, Nylon 6, is witnessing sustained demand due to its versatility, with key applications including automotive parts, textiles, carpets, and industrial yarns. The evolving landscape of the automotive industry, with its increasing focus on electric vehicles and lightweighting, presents significant opportunities for Nylon 6-based components. Furthermore, the burgeoning textile and apparel industry, particularly in emerging economies, continues to be a major consumer of Nylon 6 fibers, driving global demand. The engineering resins segment, crucial for applications requiring high strength and performance, is also demonstrating robust growth, reflecting the increasing sophistication of manufacturing processes across various end-user industries. The overall market evolution is indicative of a mature yet expanding industry, with innovation and application diversification playing pivotal roles in sustained growth.
Dominant Regions, Countries, or Segments in Caprolactam Industry
Asia Pacific currently stands as the dominant region in the global caprolactam market, driven by robust industrial growth, significant manufacturing capabilities, and a burgeoning consumer base across its key economies, particularly China. Within this region, China accounts for a substantial portion of both production and consumption, fueled by its extensive chemical industry infrastructure and its role as a global manufacturing hub for textiles, automotive parts, and electronics. The raw material segment, particularly Phenol and Cyclohexane, sees strong demand originating from this region, supporting its vast downstream Nylon 6 production. The End Product segment of Nylon 6 Resins is witnessing exceptional growth, driven by the automotive industry's demand for lightweight and high-performance components, essential for improving fuel efficiency and enabling electric vehicle advancements. The Application segment of Engineering Resins and Films is another major growth propeller, as these materials are increasingly adopted in demanding applications across electronics, packaging, and industrial machinery due to their superior mechanical properties, thermal stability, and chemical resistance. The End-user Industry of Automotive is a primary driver, with caprolactam-derived Nylon 6 being integral to manufacturing vehicle interiors, exteriors, and under-the-hood components. The Carpet segment also contributes significantly, as Nylon 6 fibers offer excellent durability, resilience, and stain resistance, making them a preferred choice for high-traffic areas. The Textile industry globally, and especially within Asia, remains a cornerstone for caprolactam consumption, with Nylon 6 fibers used in a wide array of apparel, activewear, and industrial textiles due to their strength, elasticity, and quick-drying properties.
- Dominant Region: Asia Pacific, with China leading in production and consumption.
- Key Drivers: Strong manufacturing base, rapid industrialization, supportive government policies, and substantial domestic demand from key end-user industries.
- Market Share: Estimated to hold over 60% of the global caprolactam market.
- Dominant End-User Industry: Automotive.
- Key Drivers: Increasing demand for lightweight materials to improve fuel efficiency, growing adoption of electric vehicles, and advancements in interior and exterior component design.
- Growth Potential: Significant, driven by global automotive production trends and the increasing use of advanced plastics.
- Dominant End Product: Nylon 6 Resins.
- Key Drivers: Versatility, excellent mechanical and thermal properties, and widespread use in engineering applications.
- Market Share: Accounts for a significant portion of the caprolactam derivatives market.
- Dominant Application: Engineering Resins and Films.
- Key Drivers: High performance requirements in sectors like electronics, automotive, and industrial equipment.
- Growth Potential: Continuous innovation and new application development.
Caprolactam Industry Product Landscape
The caprolactam product landscape is dominated by its primary derivative, Nylon 6, which is further processed into various forms. Innovations in caprolactam production are focused on enhancing purity and efficiency, leading to superior quality Nylon 6. Key product categories include Nylon 6 resins, known for their excellent mechanical strength, toughness, and heat resistance, making them ideal for automotive parts, electrical connectors, and consumer goods. Nylon 6 fibers exhibit high tensile strength, abrasion resistance, and elasticity, finding extensive use in textiles, carpets, and industrial yarns. Other end products encompass films and specialized compounds tailored for specific performance requirements. Technological advancements are enabling the development of bio-based caprolactam, aligning with the growing demand for sustainable materials, and enhanced grades of Nylon 6 with improved flame retardancy, UV resistance, and dimensional stability.
Key Drivers, Barriers & Challenges in Caprolactam Industry
Key Drivers: The caprolactam industry is propelled by several factors, including the ever-increasing demand for Nylon 6 in the automotive sector for lightweighting and component durability, substantial growth in the textile and carpet industries, especially in emerging economies, and the expanding applications of Nylon 6 in engineering plastics for electronics and industrial machinery. Technological advancements in production processes, leading to improved efficiency and reduced costs, also act as significant drivers.
Barriers & Challenges: Despite the growth prospects, the industry faces challenges such as price volatility of raw materials like benzene and cyclohexane, stringent environmental regulations and compliance costs associated with production, and the high capital expenditure required for establishing new production facilities. Competition from alternative polymers in certain applications and the cyclical nature of end-user industries like automotive and construction also pose significant restraints. Supply chain disruptions and geopolitical factors can further impact production and market stability.
Emerging Opportunities in Caprolactam Industry
Emerging opportunities within the caprolactam industry lie in the development and adoption of bio-based caprolactam, driven by increasing consumer and regulatory demand for sustainable materials. The expanding use of Nylon 6 in advanced composites for aerospace and renewable energy sectors, such as wind turbine blades, presents a significant growth avenue. Furthermore, the development of specialized Nylon 6 grades with enhanced properties like improved chemical resistance and flame retardancy opens up new application niches in demanding industrial environments. The circular economy model, focusing on chemical recycling of Nylon 6 waste back into caprolactam, offers a substantial opportunity to reduce environmental impact and secure feedstock.
Growth Accelerators in the Caprolactam Industry Industry
Long-term growth in the caprolactam industry will be significantly accelerated by ongoing technological breakthroughs in catalytic processes, leading to more energy-efficient and environmentally friendly production. Strategic partnerships and collaborations between caprolactam producers, downstream manufacturers, and end-users will foster innovation and market penetration of new applications. Market expansion into untapped geographical regions with growing industrial bases, particularly in Southeast Asia and Africa, presents considerable growth potential. The continuous development of high-performance Nylon 6 grades tailored for specific, demanding applications in sectors like electric vehicles and advanced electronics will also act as a major growth catalyst.
Key Players Shaping the Caprolactam Industry Market
- Sumitomo Chemical Co Ltd
- Fujian Jinjiang Petrochemical
- Fibrant
- AdvanSix Inc
- Juhua Group Corporation
- UBE Corporation
- Fertilisers And Chemicals Travancore Limited (FACT)
- Alpek S A B de CV
- Toray Industries Inc
- Domo Chemicals
- Capro Co
- China Petrochemical Development Corporation
- BASF SE
- Shandong Haili Chemical Industry Co Ltd
- Lanxess
- PJSC Kuibyshevazot
- Xuyang Group
- China Petroleum & Chemical Corporation (Sinopec)
Notable Milestones in Caprolactam Industry Sector
- September 2022: Xuyang Group commenced caprolactam production at its Cangzhou Park site following the completion of its second phase expansion, boosting its total capacity to 750,000 tons per year.
- April 2022: Sumitomo Chemical announced the closure of its caprolactam production facilities at its Ehime Works in Japan, marking its exit from the caprolactam business.
- March 2022: Domo Chemicals significantly expanded its caprolactam production capacity at its German site, increasing it from 176,000 tons/year to 500,000 tons/year.
In-Depth Caprolactam Industry Market Outlook
The outlook for the caprolactam industry remains robust, fueled by continuous innovation and expanding applications. The increasing focus on sustainability and circular economy principles presents a significant opportunity for bio-based caprolactam and advanced recycling technologies. The automotive sector's transition towards electric vehicles and lightweighting will continue to drive demand for high-performance Nylon 6 components. Strategic investments in emerging markets and the development of specialized product grades will be crucial for sustained growth. The industry is well-positioned to capitalize on evolving consumer preferences for durable, sustainable, and high-performance materials across diverse end-user segments.
Caprolactam Industry Segmentation
-
1. Raw Material
- 1.1. Phenol
- 1.2. Cyclohexane
-
2. End Product
- 2.1. Nylon 6 Resins
- 2.2. Nylon 6 Fibers
- 2.3. Other End Products
-
3. Application
- 3.1. Engineering Resins and Films
- 3.2. Industrial Yarns
- 3.3. Textiles and Carpets
- 3.4. Other Applications
-
4. End-user Industry
- 4.1. Automotive
- 4.2. Carpet
- 4.3. Textile
- 4.4. Other End-user Industries
Caprolactam Industry Segmentation By Geography
-
1. Asia Pacific
- 1.1. China
- 1.2. Japan
- 1.3. South Korea
- 1.4. Rest of Asia Pacific
-
2. North America
- 2.1. United States
- 2.2. Canada
- 2.3. Mexico
-
3. Europe
- 3.1. Germany
- 3.2. United Kingdom
- 3.3. France
- 3.4. Italy
- 3.5. Rest of Europe
-
4. South America
- 4.1. Brazil
- 4.2. Argentina
- 4.3. Rest of South America
-
5. Middle East and Africa
- 5.1. Saudi Arabia
- 5.2. South Africa
- 5.3. Rest of Middle East and Africa
Caprolactam Industry Regional Market Share
Geographic Coverage of Caprolactam Industry
Caprolactam Industry REPORT HIGHLIGHTS
| Aspects | Details |
|---|---|
| Study Period | 2020-2034 |
| Base Year | 2025 |
| Estimated Year | 2026 |
| Forecast Period | 2026-2034 |
| Historical Period | 2020-2025 |
| Growth Rate | CAGR of > 3.00% from 2020-2034 |
| Segmentation |
|
Table of Contents
- 1. Introduction
- 1.1. Research Scope
- 1.2. Market Segmentation
- 1.3. Research Objective
- 1.4. Definitions and Assumptions
- 2. Executive Summary
- 2.1. Market Snapshot
- 3. Market Dynamics
- 3.1. Market Drivers
- 3.2. Market Restrains
- 3.3. Market Trends
- 3.4. Market Opportunities
- 4. Market Factor Analysis
- 4.1. Porters Five Forces
- 4.1.1. Bargaining Power of Suppliers
- 4.1.2. Bargaining Power of Buyers
- 4.1.3. Threat of New Entrants
- 4.1.4. Threat of Substitutes
- 4.1.5. Competitive Rivalry
- 4.2. PESTEL analysis
- 4.3. BCG Analysis
- 4.3.1. Stars (High Growth, High Market Share)
- 4.3.2. Cash Cows (Low Growth, High Market Share)
- 4.3.3. Question Mark (High Growth, Low Market Share)
- 4.3.4. Dogs (Low Growth, Low Market Share)
- 4.4. Ansoff Matrix Analysis
- 4.5. Supply Chain Analysis
- 4.6. Regulatory Landscape
- 4.7. Current Market Potential and Opportunity Assessment (TAM–SAM–SOM Framework)
- 4.8. VDR Analyst Note
- 4.1. Porters Five Forces
- 5. Market Analysis, Insights and Forecast 2021-2033
- 5.1. Market Analysis, Insights and Forecast - by Raw Material
- 5.1.1. Phenol
- 5.1.2. Cyclohexane
- 5.2. Market Analysis, Insights and Forecast - by End Product
- 5.2.1. Nylon 6 Resins
- 5.2.2. Nylon 6 Fibers
- 5.2.3. Other End Products
- 5.3. Market Analysis, Insights and Forecast - by Application
- 5.3.1. Engineering Resins and Films
- 5.3.2. Industrial Yarns
- 5.3.3. Textiles and Carpets
- 5.3.4. Other Applications
- 5.4. Market Analysis, Insights and Forecast - by End-user Industry
- 5.4.1. Automotive
- 5.4.2. Carpet
- 5.4.3. Textile
- 5.4.4. Other End-user Industries
- 5.5. Market Analysis, Insights and Forecast - by Region
- 5.5.1. Asia Pacific
- 5.5.2. North America
- 5.5.3. Europe
- 5.5.4. South America
- 5.5.5. Middle East and Africa
- 5.1. Market Analysis, Insights and Forecast - by Raw Material
- 6. Global Caprolactam Industry Analysis, Insights and Forecast, 2021-2033
- 6.1. Market Analysis, Insights and Forecast - by Raw Material
- 6.1.1. Phenol
- 6.1.2. Cyclohexane
- 6.2. Market Analysis, Insights and Forecast - by End Product
- 6.2.1. Nylon 6 Resins
- 6.2.2. Nylon 6 Fibers
- 6.2.3. Other End Products
- 6.3. Market Analysis, Insights and Forecast - by Application
- 6.3.1. Engineering Resins and Films
- 6.3.2. Industrial Yarns
- 6.3.3. Textiles and Carpets
- 6.3.4. Other Applications
- 6.4. Market Analysis, Insights and Forecast - by End-user Industry
- 6.4.1. Automotive
- 6.4.2. Carpet
- 6.4.3. Textile
- 6.4.4. Other End-user Industries
- 6.1. Market Analysis, Insights and Forecast - by Raw Material
- 7. Asia Pacific Caprolactam Industry Analysis, Insights and Forecast, 2021-2033
- 7.1. Market Analysis, Insights and Forecast - by Raw Material
- 7.1.1. Phenol
- 7.1.2. Cyclohexane
- 7.2. Market Analysis, Insights and Forecast - by End Product
- 7.2.1. Nylon 6 Resins
- 7.2.2. Nylon 6 Fibers
- 7.2.3. Other End Products
- 7.3. Market Analysis, Insights and Forecast - by Application
- 7.3.1. Engineering Resins and Films
- 7.3.2. Industrial Yarns
- 7.3.3. Textiles and Carpets
- 7.3.4. Other Applications
- 7.4. Market Analysis, Insights and Forecast - by End-user Industry
- 7.4.1. Automotive
- 7.4.2. Carpet
- 7.4.3. Textile
- 7.4.4. Other End-user Industries
- 7.1. Market Analysis, Insights and Forecast - by Raw Material
- 8. North America Caprolactam Industry Analysis, Insights and Forecast, 2021-2033
- 8.1. Market Analysis, Insights and Forecast - by Raw Material
- 8.1.1. Phenol
- 8.1.2. Cyclohexane
- 8.2. Market Analysis, Insights and Forecast - by End Product
- 8.2.1. Nylon 6 Resins
- 8.2.2. Nylon 6 Fibers
- 8.2.3. Other End Products
- 8.3. Market Analysis, Insights and Forecast - by Application
- 8.3.1. Engineering Resins and Films
- 8.3.2. Industrial Yarns
- 8.3.3. Textiles and Carpets
- 8.3.4. Other Applications
- 8.4. Market Analysis, Insights and Forecast - by End-user Industry
- 8.4.1. Automotive
- 8.4.2. Carpet
- 8.4.3. Textile
- 8.4.4. Other End-user Industries
- 8.1. Market Analysis, Insights and Forecast - by Raw Material
- 9. Europe Caprolactam Industry Analysis, Insights and Forecast, 2021-2033
- 9.1. Market Analysis, Insights and Forecast - by Raw Material
- 9.1.1. Phenol
- 9.1.2. Cyclohexane
- 9.2. Market Analysis, Insights and Forecast - by End Product
- 9.2.1. Nylon 6 Resins
- 9.2.2. Nylon 6 Fibers
- 9.2.3. Other End Products
- 9.3. Market Analysis, Insights and Forecast - by Application
- 9.3.1. Engineering Resins and Films
- 9.3.2. Industrial Yarns
- 9.3.3. Textiles and Carpets
- 9.3.4. Other Applications
- 9.4. Market Analysis, Insights and Forecast - by End-user Industry
- 9.4.1. Automotive
- 9.4.2. Carpet
- 9.4.3. Textile
- 9.4.4. Other End-user Industries
- 9.1. Market Analysis, Insights and Forecast - by Raw Material
- 10. South America Caprolactam Industry Analysis, Insights and Forecast, 2021-2033
- 10.1. Market Analysis, Insights and Forecast - by Raw Material
- 10.1.1. Phenol
- 10.1.2. Cyclohexane
- 10.2. Market Analysis, Insights and Forecast - by End Product
- 10.2.1. Nylon 6 Resins
- 10.2.2. Nylon 6 Fibers
- 10.2.3. Other End Products
- 10.3. Market Analysis, Insights and Forecast - by Application
- 10.3.1. Engineering Resins and Films
- 10.3.2. Industrial Yarns
- 10.3.3. Textiles and Carpets
- 10.3.4. Other Applications
- 10.4. Market Analysis, Insights and Forecast - by End-user Industry
- 10.4.1. Automotive
- 10.4.2. Carpet
- 10.4.3. Textile
- 10.4.4. Other End-user Industries
- 10.1. Market Analysis, Insights and Forecast - by Raw Material
- 11. Middle East and Africa Caprolactam Industry Analysis, Insights and Forecast, 2021-2033
- 11.1. Market Analysis, Insights and Forecast - by Raw Material
- 11.1.1. Phenol
- 11.1.2. Cyclohexane
- 11.2. Market Analysis, Insights and Forecast - by End Product
- 11.2.1. Nylon 6 Resins
- 11.2.2. Nylon 6 Fibers
- 11.2.3. Other End Products
- 11.3. Market Analysis, Insights and Forecast - by Application
- 11.3.1. Engineering Resins and Films
- 11.3.2. Industrial Yarns
- 11.3.3. Textiles and Carpets
- 11.3.4. Other Applications
- 11.4. Market Analysis, Insights and Forecast - by End-user Industry
- 11.4.1. Automotive
- 11.4.2. Carpet
- 11.4.3. Textile
- 11.4.4. Other End-user Industries
- 11.1. Market Analysis, Insights and Forecast - by Raw Material
- 12. Competitive Analysis
- 12.1. Company Profiles
- 12.1.1 Sumitomo Chemical Co Ltd
- 12.1.1.1. Company Overview
- 12.1.1.2. Products
- 12.1.1.3. Company Financials
- 12.1.1.4. SWOT Analysis
- 12.1.2 Fujian Jinjiang Petrochemical
- 12.1.2.1. Company Overview
- 12.1.2.2. Products
- 12.1.2.3. Company Financials
- 12.1.2.4. SWOT Analysis
- 12.1.3 Fibrant
- 12.1.3.1. Company Overview
- 12.1.3.2. Products
- 12.1.3.3. Company Financials
- 12.1.3.4. SWOT Analysis
- 12.1.4 AdvanSix Inc
- 12.1.4.1. Company Overview
- 12.1.4.2. Products
- 12.1.4.3. Company Financials
- 12.1.4.4. SWOT Analysis
- 12.1.5 Juhua Group Corporation
- 12.1.5.1. Company Overview
- 12.1.5.2. Products
- 12.1.5.3. Company Financials
- 12.1.5.4. SWOT Analysis
- 12.1.6 UBE Corporation
- 12.1.6.1. Company Overview
- 12.1.6.2. Products
- 12.1.6.3. Company Financials
- 12.1.6.4. SWOT Analysis
- 12.1.7 Fertilisers And Chemicals Travancore Limited (FACT)
- 12.1.7.1. Company Overview
- 12.1.7.2. Products
- 12.1.7.3. Company Financials
- 12.1.7.4. SWOT Analysis
- 12.1.8 Alpek S A B de CV
- 12.1.8.1. Company Overview
- 12.1.8.2. Products
- 12.1.8.3. Company Financials
- 12.1.8.4. SWOT Analysis
- 12.1.9 Toray Industries Inc
- 12.1.9.1. Company Overview
- 12.1.9.2. Products
- 12.1.9.3. Company Financials
- 12.1.9.4. SWOT Analysis
- 12.1.10 Domo Chemicals
- 12.1.10.1. Company Overview
- 12.1.10.2. Products
- 12.1.10.3. Company Financials
- 12.1.10.4. SWOT Analysis
- 12.1.11 Capro Co
- 12.1.11.1. Company Overview
- 12.1.11.2. Products
- 12.1.11.3. Company Financials
- 12.1.11.4. SWOT Analysis
- 12.1.12 China Petrochemical Development Corporation
- 12.1.12.1. Company Overview
- 12.1.12.2. Products
- 12.1.12.3. Company Financials
- 12.1.12.4. SWOT Analysis
- 12.1.13 BASF SE
- 12.1.13.1. Company Overview
- 12.1.13.2. Products
- 12.1.13.3. Company Financials
- 12.1.13.4. SWOT Analysis
- 12.1.14 Shandong Haili Chemical Industry Co Ltd
- 12.1.14.1. Company Overview
- 12.1.14.2. Products
- 12.1.14.3. Company Financials
- 12.1.14.4. SWOT Analysis
- 12.1.15 Lanxess
- 12.1.15.1. Company Overview
- 12.1.15.2. Products
- 12.1.15.3. Company Financials
- 12.1.15.4. SWOT Analysis
- 12.1.16 PJSC Kuibyshevazot
- 12.1.16.1. Company Overview
- 12.1.16.2. Products
- 12.1.16.3. Company Financials
- 12.1.16.4. SWOT Analysis
- 12.1.17 Xuyang Group*List Not Exhaustive
- 12.1.17.1. Company Overview
- 12.1.17.2. Products
- 12.1.17.3. Company Financials
- 12.1.17.4. SWOT Analysis
- 12.1.18 China Petroleum & Chemical Corporation (Sinopec)
- 12.1.18.1. Company Overview
- 12.1.18.2. Products
- 12.1.18.3. Company Financials
- 12.1.18.4. SWOT Analysis
- 12.1.1 Sumitomo Chemical Co Ltd
- 12.2. Market Entropy
- 12.2.1 Company's Key Areas Served
- 12.2.2 Recent Developments
- 12.3. Company Market Share Analysis 2025
- 12.3.1 Top 5 Companies Market Share Analysis
- 12.3.2 Top 3 Companies Market Share Analysis
- 12.4. List of Potential Customers
- 13. Research Methodology
List of Figures
- Figure 1: Global Caprolactam Industry Revenue Breakdown (Million, %) by Region 2025 & 2033
- Figure 2: Asia Pacific Caprolactam Industry Revenue (Million), by Raw Material 2025 & 2033
- Figure 3: Asia Pacific Caprolactam Industry Revenue Share (%), by Raw Material 2025 & 2033
- Figure 4: Asia Pacific Caprolactam Industry Revenue (Million), by End Product 2025 & 2033
- Figure 5: Asia Pacific Caprolactam Industry Revenue Share (%), by End Product 2025 & 2033
- Figure 6: Asia Pacific Caprolactam Industry Revenue (Million), by Application 2025 & 2033
- Figure 7: Asia Pacific Caprolactam Industry Revenue Share (%), by Application 2025 & 2033
- Figure 8: Asia Pacific Caprolactam Industry Revenue (Million), by End-user Industry 2025 & 2033
- Figure 9: Asia Pacific Caprolactam Industry Revenue Share (%), by End-user Industry 2025 & 2033
- Figure 10: Asia Pacific Caprolactam Industry Revenue (Million), by Country 2025 & 2033
- Figure 11: Asia Pacific Caprolactam Industry Revenue Share (%), by Country 2025 & 2033
- Figure 12: North America Caprolactam Industry Revenue (Million), by Raw Material 2025 & 2033
- Figure 13: North America Caprolactam Industry Revenue Share (%), by Raw Material 2025 & 2033
- Figure 14: North America Caprolactam Industry Revenue (Million), by End Product 2025 & 2033
- Figure 15: North America Caprolactam Industry Revenue Share (%), by End Product 2025 & 2033
- Figure 16: North America Caprolactam Industry Revenue (Million), by Application 2025 & 2033
- Figure 17: North America Caprolactam Industry Revenue Share (%), by Application 2025 & 2033
- Figure 18: North America Caprolactam Industry Revenue (Million), by End-user Industry 2025 & 2033
- Figure 19: North America Caprolactam Industry Revenue Share (%), by End-user Industry 2025 & 2033
- Figure 20: North America Caprolactam Industry Revenue (Million), by Country 2025 & 2033
- Figure 21: North America Caprolactam Industry Revenue Share (%), by Country 2025 & 2033
- Figure 22: Europe Caprolactam Industry Revenue (Million), by Raw Material 2025 & 2033
- Figure 23: Europe Caprolactam Industry Revenue Share (%), by Raw Material 2025 & 2033
- Figure 24: Europe Caprolactam Industry Revenue (Million), by End Product 2025 & 2033
- Figure 25: Europe Caprolactam Industry Revenue Share (%), by End Product 2025 & 2033
- Figure 26: Europe Caprolactam Industry Revenue (Million), by Application 2025 & 2033
- Figure 27: Europe Caprolactam Industry Revenue Share (%), by Application 2025 & 2033
- Figure 28: Europe Caprolactam Industry Revenue (Million), by End-user Industry 2025 & 2033
- Figure 29: Europe Caprolactam Industry Revenue Share (%), by End-user Industry 2025 & 2033
- Figure 30: Europe Caprolactam Industry Revenue (Million), by Country 2025 & 2033
- Figure 31: Europe Caprolactam Industry Revenue Share (%), by Country 2025 & 2033
- Figure 32: South America Caprolactam Industry Revenue (Million), by Raw Material 2025 & 2033
- Figure 33: South America Caprolactam Industry Revenue Share (%), by Raw Material 2025 & 2033
- Figure 34: South America Caprolactam Industry Revenue (Million), by End Product 2025 & 2033
- Figure 35: South America Caprolactam Industry Revenue Share (%), by End Product 2025 & 2033
- Figure 36: South America Caprolactam Industry Revenue (Million), by Application 2025 & 2033
- Figure 37: South America Caprolactam Industry Revenue Share (%), by Application 2025 & 2033
- Figure 38: South America Caprolactam Industry Revenue (Million), by End-user Industry 2025 & 2033
- Figure 39: South America Caprolactam Industry Revenue Share (%), by End-user Industry 2025 & 2033
- Figure 40: South America Caprolactam Industry Revenue (Million), by Country 2025 & 2033
- Figure 41: South America Caprolactam Industry Revenue Share (%), by Country 2025 & 2033
- Figure 42: Middle East and Africa Caprolactam Industry Revenue (Million), by Raw Material 2025 & 2033
- Figure 43: Middle East and Africa Caprolactam Industry Revenue Share (%), by Raw Material 2025 & 2033
- Figure 44: Middle East and Africa Caprolactam Industry Revenue (Million), by End Product 2025 & 2033
- Figure 45: Middle East and Africa Caprolactam Industry Revenue Share (%), by End Product 2025 & 2033
- Figure 46: Middle East and Africa Caprolactam Industry Revenue (Million), by Application 2025 & 2033
- Figure 47: Middle East and Africa Caprolactam Industry Revenue Share (%), by Application 2025 & 2033
- Figure 48: Middle East and Africa Caprolactam Industry Revenue (Million), by End-user Industry 2025 & 2033
- Figure 49: Middle East and Africa Caprolactam Industry Revenue Share (%), by End-user Industry 2025 & 2033
- Figure 50: Middle East and Africa Caprolactam Industry Revenue (Million), by Country 2025 & 2033
- Figure 51: Middle East and Africa Caprolactam Industry Revenue Share (%), by Country 2025 & 2033
List of Tables
- Table 1: Global Caprolactam Industry Revenue Million Forecast, by Raw Material 2020 & 2033
- Table 2: Global Caprolactam Industry Revenue Million Forecast, by End Product 2020 & 2033
- Table 3: Global Caprolactam Industry Revenue Million Forecast, by Application 2020 & 2033
- Table 4: Global Caprolactam Industry Revenue Million Forecast, by End-user Industry 2020 & 2033
- Table 5: Global Caprolactam Industry Revenue Million Forecast, by Region 2020 & 2033
- Table 6: Global Caprolactam Industry Revenue Million Forecast, by Raw Material 2020 & 2033
- Table 7: Global Caprolactam Industry Revenue Million Forecast, by End Product 2020 & 2033
- Table 8: Global Caprolactam Industry Revenue Million Forecast, by Application 2020 & 2033
- Table 9: Global Caprolactam Industry Revenue Million Forecast, by End-user Industry 2020 & 2033
- Table 10: Global Caprolactam Industry Revenue Million Forecast, by Country 2020 & 2033
- Table 11: China Caprolactam Industry Revenue (Million) Forecast, by Application 2020 & 2033
- Table 12: Japan Caprolactam Industry Revenue (Million) Forecast, by Application 2020 & 2033
- Table 13: South Korea Caprolactam Industry Revenue (Million) Forecast, by Application 2020 & 2033
- Table 14: Rest of Asia Pacific Caprolactam Industry Revenue (Million) Forecast, by Application 2020 & 2033
- Table 15: Global Caprolactam Industry Revenue Million Forecast, by Raw Material 2020 & 2033
- Table 16: Global Caprolactam Industry Revenue Million Forecast, by End Product 2020 & 2033
- Table 17: Global Caprolactam Industry Revenue Million Forecast, by Application 2020 & 2033
- Table 18: Global Caprolactam Industry Revenue Million Forecast, by End-user Industry 2020 & 2033
- Table 19: Global Caprolactam Industry Revenue Million Forecast, by Country 2020 & 2033
- Table 20: United States Caprolactam Industry Revenue (Million) Forecast, by Application 2020 & 2033
- Table 21: Canada Caprolactam Industry Revenue (Million) Forecast, by Application 2020 & 2033
- Table 22: Mexico Caprolactam Industry Revenue (Million) Forecast, by Application 2020 & 2033
- Table 23: Global Caprolactam Industry Revenue Million Forecast, by Raw Material 2020 & 2033
- Table 24: Global Caprolactam Industry Revenue Million Forecast, by End Product 2020 & 2033
- Table 25: Global Caprolactam Industry Revenue Million Forecast, by Application 2020 & 2033
- Table 26: Global Caprolactam Industry Revenue Million Forecast, by End-user Industry 2020 & 2033
- Table 27: Global Caprolactam Industry Revenue Million Forecast, by Country 2020 & 2033
- Table 28: Germany Caprolactam Industry Revenue (Million) Forecast, by Application 2020 & 2033
- Table 29: United Kingdom Caprolactam Industry Revenue (Million) Forecast, by Application 2020 & 2033
- Table 30: France Caprolactam Industry Revenue (Million) Forecast, by Application 2020 & 2033
- Table 31: Italy Caprolactam Industry Revenue (Million) Forecast, by Application 2020 & 2033
- Table 32: Rest of Europe Caprolactam Industry Revenue (Million) Forecast, by Application 2020 & 2033
- Table 33: Global Caprolactam Industry Revenue Million Forecast, by Raw Material 2020 & 2033
- Table 34: Global Caprolactam Industry Revenue Million Forecast, by End Product 2020 & 2033
- Table 35: Global Caprolactam Industry Revenue Million Forecast, by Application 2020 & 2033
- Table 36: Global Caprolactam Industry Revenue Million Forecast, by End-user Industry 2020 & 2033
- Table 37: Global Caprolactam Industry Revenue Million Forecast, by Country 2020 & 2033
- Table 38: Brazil Caprolactam Industry Revenue (Million) Forecast, by Application 2020 & 2033
- Table 39: Argentina Caprolactam Industry Revenue (Million) Forecast, by Application 2020 & 2033
- Table 40: Rest of South America Caprolactam Industry Revenue (Million) Forecast, by Application 2020 & 2033
- Table 41: Global Caprolactam Industry Revenue Million Forecast, by Raw Material 2020 & 2033
- Table 42: Global Caprolactam Industry Revenue Million Forecast, by End Product 2020 & 2033
- Table 43: Global Caprolactam Industry Revenue Million Forecast, by Application 2020 & 2033
- Table 44: Global Caprolactam Industry Revenue Million Forecast, by End-user Industry 2020 & 2033
- Table 45: Global Caprolactam Industry Revenue Million Forecast, by Country 2020 & 2033
- Table 46: Saudi Arabia Caprolactam Industry Revenue (Million) Forecast, by Application 2020 & 2033
- Table 47: South Africa Caprolactam Industry Revenue (Million) Forecast, by Application 2020 & 2033
- Table 48: Rest of Middle East and Africa Caprolactam Industry Revenue (Million) Forecast, by Application 2020 & 2033
Frequently Asked Questions
1. What is the projected Compound Annual Growth Rate (CAGR) of the Caprolactam Industry?
The projected CAGR is approximately > 3.00%.
2. Which companies are prominent players in the Caprolactam Industry?
Key companies in the market include Sumitomo Chemical Co Ltd, Fujian Jinjiang Petrochemical, Fibrant, AdvanSix Inc, Juhua Group Corporation, UBE Corporation, Fertilisers And Chemicals Travancore Limited (FACT), Alpek S A B de CV, Toray Industries Inc, Domo Chemicals, Capro Co, China Petrochemical Development Corporation, BASF SE, Shandong Haili Chemical Industry Co Ltd, Lanxess, PJSC Kuibyshevazot, Xuyang Group*List Not Exhaustive, China Petroleum & Chemical Corporation (Sinopec).
3. What are the main segments of the Caprolactam Industry?
The market segments include Raw Material, End Product, Application, End-user Industry.
4. Can you provide details about the market size?
The market size is estimated to be USD XX Million as of 2022.
5. What are some drivers contributing to market growth?
Growing Production Capacity of Nylon 6.
6. What are the notable trends driving market growth?
Increasing Demand for Textile and Carpets.
7. Are there any restraints impacting market growth?
Toxicity of caprolactam; Presence of substitute products for Nylon-6.
8. Can you provide examples of recent developments in the market?
In September 2022, Xuyang Group at its Cangzhou Park site started the production of caprolactam post-completion of its second phase of the 300,000 tons per year caprolactam expansion project. With this expansion project, the company's total production capacity increased to 750,000 tons per year.
9. What pricing options are available for accessing the report?
Pricing options include single-user, multi-user, and enterprise licenses priced at USD 4750, USD 5250, and USD 8750 respectively.
10. Is the market size provided in terms of value or volume?
The market size is provided in terms of value, measured in Million.
11. Are there any specific market keywords associated with the report?
Yes, the market keyword associated with the report is "Caprolactam Industry," which aids in identifying and referencing the specific market segment covered.
12. How do I determine which pricing option suits my needs best?
The pricing options vary based on user requirements and access needs. Individual users may opt for single-user licenses, while businesses requiring broader access may choose multi-user or enterprise licenses for cost-effective access to the report.
13. Are there any additional resources or data provided in the Caprolactam Industry report?
While the report offers comprehensive insights, it's advisable to review the specific contents or supplementary materials provided to ascertain if additional resources or data are available.
14. How can I stay updated on further developments or reports in the Caprolactam Industry?
To stay informed about further developments, trends, and reports in the Caprolactam Industry, consider subscribing to industry newsletters, following relevant companies and organizations, or regularly checking reputable industry news sources and publications.
Methodology
Step 1 - Identification of Relevant Samples Size from Population Database


Step 2 - Approaches for Defining Global Market Size (Value, Volume* & Price*)

Note*: In applicable scenarios
Step 3 - Data Sources
Primary Research
- Web Analytics
- Survey Reports
- Research Institute
- Latest Research Reports
- Opinion Leaders
Secondary Research
- Annual Reports
- White Paper
- Latest Press Release
- Industry Association
- Paid Database
- Investor Presentations

Step 4 - Data Triangulation
Involves using different sources of information in order to increase the validity of a study
These sources are likely to be stakeholders in a program - participants, other researchers, program staff, other community members, and so on.
Then we put all data in single framework & apply various statistical tools to find out the dynamic on the market.
During the analysis stage, feedback from the stakeholder groups would be compared to determine areas of agreement as well as areas of divergence