

Key Insights
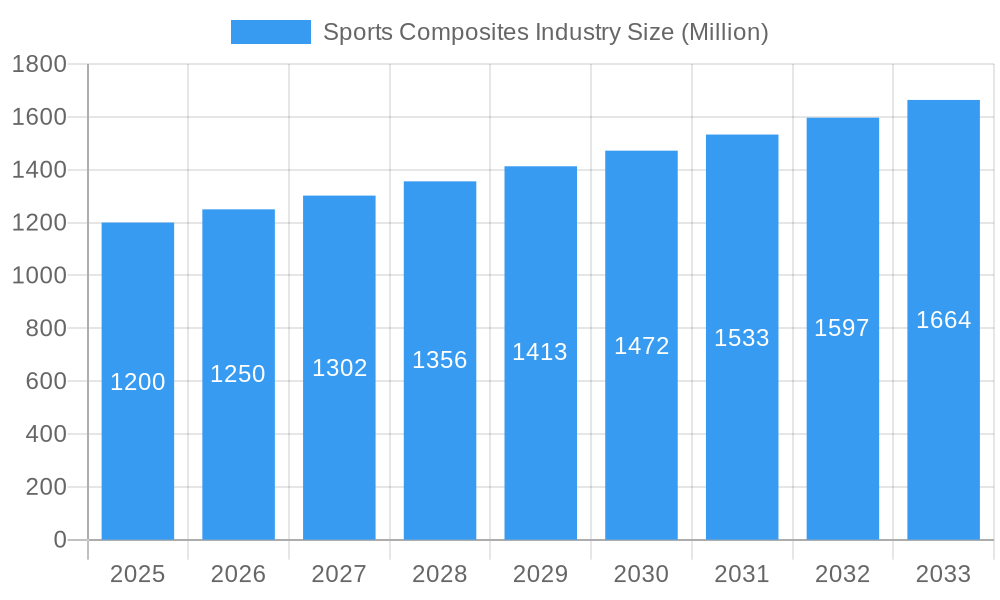
The global Sports Composites market is poised for robust expansion, projected to reach an estimated XX million by 2025 and grow at a Compound Annual Growth Rate (CAGR) of 4.11% throughout the forecast period of 2025-2033. This growth is fueled by the increasing demand for lightweight, durable, and high-performance materials across a wide spectrum of sporting goods. Glass-fibre reinforced composites dominate the market due to their cost-effectiveness and versatility, while carbon-fibre reinforced composites are gaining traction in high-performance applications like professional golf shafts and bicycles where strength-to-weight ratio is paramount. Epoxy resins are the preferred choice for their excellent mechanical properties and adhesion, though polyurethane and other resin types are finding niche applications. The application segments of golf shafts, hockey sticks, rackets, bicycles, and skis and snowboards represent key growth areas, driven by both amateur and professional athlete preferences for enhanced equipment performance.
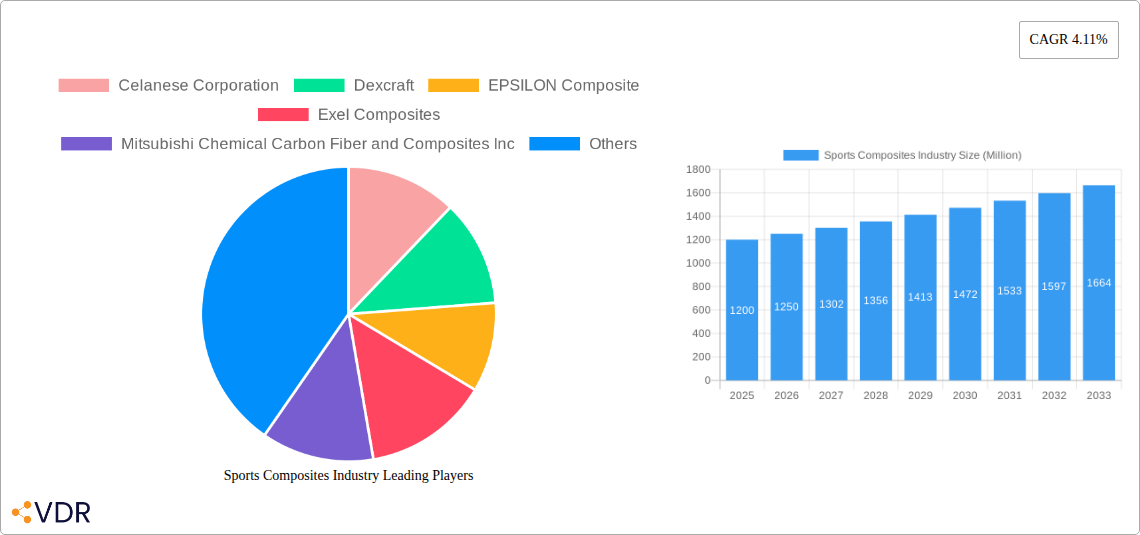
Sports Composites Industry Market Size (In Billion)
The market's trajectory is further shaped by significant trends such as advancements in composite manufacturing technologies, leading to improved performance and reduced costs. The growing awareness among athletes about the benefits of composite materials in improving their performance and reducing the risk of injuries is a crucial driver. Furthermore, the increasing participation in sports globally, coupled with rising disposable incomes, particularly in emerging economies, is contributing to a higher adoption rate of sports equipment made from composites. However, the market faces certain restraints, including the relatively high cost of certain advanced composite materials and the complexities associated with their recycling and disposal. Despite these challenges, the continuous innovation in material science and manufacturing processes, alongside the expanding application base, ensures a dynamic and promising future for the Sports Composites industry.
Sports Composites Industry Company Market Share
Global Sports Composites Market: In-depth Analysis and Forecast (2019-2033)
This comprehensive report provides an in-depth analysis of the global Sports Composites market, offering critical insights into market dynamics, growth trends, regional dominance, product landscape, and key strategic elements. Covering the historical period from 2019 to 2024, the base year of 2025, and an extensive forecast period up to 2033, this report is an indispensable resource for stakeholders seeking to capitalize on the burgeoning opportunities within this dynamic sector. The analysis includes a detailed examination of both the parent market and its child segments, providing a granular view of market evolution. All values are presented in Million units for clarity and ease of comparison.
Sports Composites Industry Market Dynamics & Structure
The Sports Composites industry is characterized by a moderately concentrated market structure, driven by significant technological innovation and ongoing consolidation through Mergers & Acquisitions (M&A). Key drivers of innovation include the relentless pursuit of enhanced performance, reduced weight, and improved durability in sporting equipment. Regulatory frameworks, while present, are largely focused on safety and environmental standards, creating a relatively permissive environment for product development. Competitive product substitutes, such as traditional materials like aluminum and wood, are steadily losing ground to advanced composites, particularly in high-performance applications. End-user demographics are shifting towards younger athletes and a growing global middle class with increased disposable income and a greater propensity for sports participation. M&A activity is a significant feature, with larger players acquiring smaller innovators to expand their technology portfolios and market reach. For instance, the acquisition of DuPont's Mobility & Materials business by Celanese Corporation for USD 11.0 billion underscores this trend, aiming to broaden product offerings and global presence.
- Market Concentration: Moderately concentrated, with a few key players holding significant market share.
- Technological Innovation Drivers:
- Demand for lightweight, high-strength materials.
- Advancements in resin systems and fiber technologies.
- Performance enhancement and athlete safety.
- Regulatory Frameworks: Primarily focused on product safety and environmental compliance.
- Competitive Product Substitutes: Traditional materials (aluminum, wood) are increasingly being displaced by composites.
- End-User Demographics: Growing participation in sports globally, particularly among younger demographics and in emerging economies.
- M&A Trends: Active consolidation to gain market share, acquire advanced technologies, and expand geographical footprint.
Sports Composites Industry Growth Trends & Insights
The global Sports Composites market is poised for robust growth, fueled by escalating demand for high-performance sporting goods and a broadening application spectrum. The market size evolution is projected to witness a significant upward trajectory, driven by increasing adoption rates across various sports disciplines. Technological disruptions, such as the development of novel composite materials and advanced manufacturing processes, are continually redefining product capabilities and pushing performance boundaries. Consumer behavior shifts are also playing a pivotal role; athletes at all levels are increasingly prioritizing equipment that offers a competitive edge, comfort, and longevity. This is particularly evident in sports like golf, tennis, cycling, and winter sports, where the performance gains from composite materials are substantial and tangible. The inherent advantages of composites, including their superior strength-to-weight ratio, corrosion resistance, and design flexibility, make them indispensable for modern sporting equipment. The report forecasts a Compound Annual Growth Rate (CAGR) of approximately XX% for the Sports Composites market during the forecast period. Market penetration is expected to deepen as the cost-effectiveness and accessibility of composite-based products improve, further democratizing their use beyond elite athletes. The increasing focus on sustainability and recyclable composite materials also presents an emerging trend that could further accelerate market adoption. The overall market penetration of composite materials in sporting goods is estimated to reach over XX% by 2033.
XXX reports indicate a substantial increase in the utilization of carbon fiber reinforced polymers (CFRP) and glass fiber reinforced polymers (GFRP) in the sports sector. These materials are instrumental in reducing the weight of equipment like bicycles and golf shafts, directly translating to improved athlete performance and reduced fatigue. The growing popularity of adventure sports and outdoor recreational activities worldwide also contributes to the sustained demand for durable and lightweight composite products such as skis, snowboards, and hockey sticks. Furthermore, the report highlights a growing trend of customization and personalized equipment design, facilitated by the inherent design flexibility of composite materials, allowing manufacturers to cater to specific athlete needs and preferences. The ongoing research and development in nanotechnology integration within composites promises to unlock even greater performance enhancements, such as improved impact resistance and vibration dampening, further solidifying the dominance of composites in the sports industry. The market is also witnessing a surge in the use of advanced resin systems, such as epoxy and polyurethane, which offer superior bonding strength and environmental resistance, thereby extending the lifespan and performance of sports equipment.
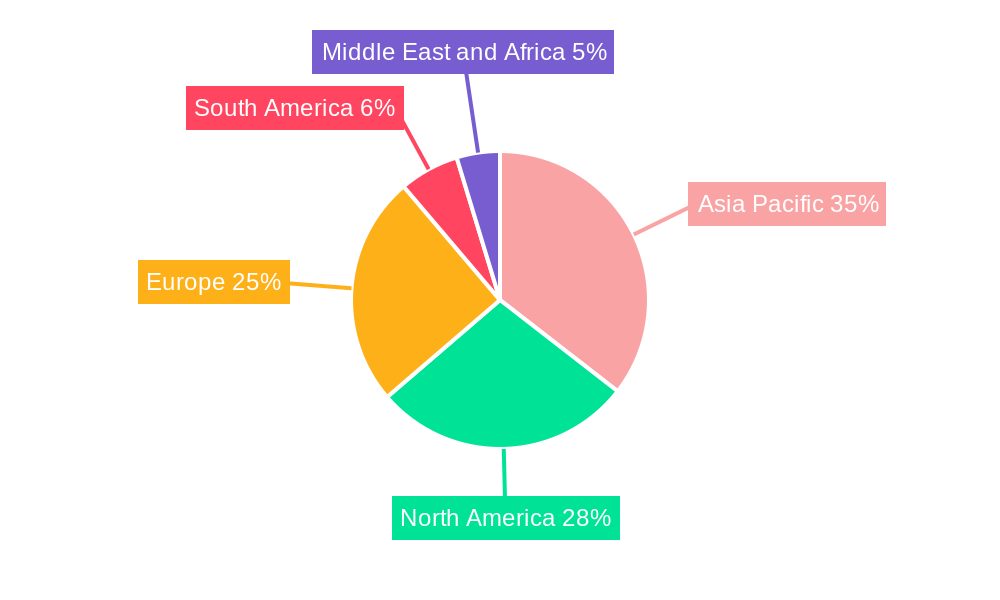
Dominant Regions, Countries, or Segments in Sports Composites Industry
North America and Europe currently dominate the global Sports Composites market, driven by mature sporting cultures, high disposable incomes, and a strong emphasis on athletic performance. Within these regions, countries like the United States, Germany, and the United Kingdom are key contributors, boasting a robust ecosystem of sports equipment manufacturers and a significant base of active participants across a wide array of sports. The dominance is further amplified by substantial investments in research and development and a proactive adoption of advanced materials.
- Leading Segment by Type: Carbon-Fibre Reinforced Composites: Carbon-fiber reinforced composites represent the leading segment due to their exceptional strength-to-weight ratio, stiffness, and performance characteristics, making them indispensable for high-performance applications like golf shafts, high-end bicycles, and professional tennis rackets.
- Market Share: Estimated to hold over XX% of the total Sports Composites market by volume.
- Growth Potential: High, driven by continuous advancements in carbon fiber production and a growing demand for premium sporting goods.
- Leading Segment by Resin Type: Epoxy Resins: Epoxy resins are the preferred choice for many sports composite applications owing to their superior mechanical properties, excellent adhesion, and resistance to environmental factors. They are widely used in conjunction with both glass and carbon fibers.
- Market Share: Estimated to account for approximately XX% of the resin market within sports composites.
- Growth Potential: Stable to moderate, benefiting from widespread application and ongoing formulation improvements.
- Leading Segment by Application: Bicycles: The bicycle segment is a significant driver of the Sports Composites market. The demand for lightweight, aerodynamic, and durable frames and components in road cycling, mountain biking, and e-bikes continues to fuel the adoption of composite materials.
- Market Share: Represents a substantial portion, estimated at over XX% of the total sports applications.
- Growth Potential: Very high, propelled by the booming cycling industry, increasing environmental consciousness, and the growing popularity of cycling as a recreational and competitive activity.
Asia Pacific is emerging as a significant growth region, propelled by rapid economic development, a burgeoning middle class, and increasing participation in sports. Countries like China and India are witnessing a surge in demand for sports equipment, creating substantial opportunities for composite material manufacturers. Government initiatives promoting sports and outdoor activities, coupled with expanding retail infrastructure, are further accelerating market penetration in this region. The adoption of advanced composite technologies in the region is also on the rise, as manufacturers strive to meet global quality standards and cater to a growing segment of performance-oriented consumers.
Sports Composites Industry Product Landscape
The product landscape of the Sports Composites industry is characterized by continuous innovation, focusing on enhancing performance metrics and expanding application versatility. Key advancements include the development of novel fiber architectures for improved impact resistance, the integration of smart functionalities for real-time performance monitoring, and the utilization of advanced resin systems for superior durability and lightweighting. For instance, next-generation golf shafts leverage precisely tailored carbon fiber layups to optimize energy transfer and swing speed, while high-performance bicycle frames benefit from advanced composite structures that offer exceptional stiffness and shock absorption. The unique selling proposition of sports composites lies in their ability to deliver customized performance characteristics that are not achievable with traditional materials, allowing athletes to push their limits.
Key Drivers, Barriers & Challenges in Sports Composites Industry
Key Drivers: The primary forces propelling the Sports Composites market include the unyielding demand for lightweight yet strong materials to enhance athletic performance, the increasing global participation in sports and recreational activities, and continuous technological advancements in composite material science and manufacturing processes. Government support for sports infrastructure development and promotional campaigns also acts as a significant catalyst. The growing consumer awareness of the benefits offered by composite materials in terms of durability and performance is further fueling market expansion.
Barriers & Challenges: Despite the positive outlook, the industry faces challenges such as the relatively high cost of raw materials, particularly for carbon fibers, which can limit adoption in price-sensitive segments. Supply chain disruptions and the need for specialized manufacturing expertise also pose hurdles. Additionally, the development of effective and widespread recycling solutions for composite materials remains a critical challenge to address environmental concerns and promote sustainability. Competition from alternative materials and the need for continuous innovation to stay ahead of emerging technologies also present ongoing pressures. The estimated impact of supply chain issues on the market is approximately XX% in terms of project delays and cost increases.
Emerging Opportunities in Sports Composites Industry
Emerging opportunities in the Sports Composites industry are abundant, driven by evolving consumer preferences and technological advancements. The untapped potential in emerging markets, particularly in Asia Pacific and Latin America, presents significant growth prospects as sports participation rises. Innovative applications beyond traditional equipment, such as wearable sports technology integrated with composite structures for enhanced biomechanical feedback, are gaining traction. Furthermore, the growing consumer demand for sustainable and eco-friendly sporting goods is opening doors for bio-composites and advanced recycling technologies within the industry. The development of personalized sports equipment tailored to individual biomechanics and preferences, enabled by the design flexibility of composites, is another promising avenue.
Growth Accelerators in the Sports Composites Industry Industry
Catalysts driving long-term growth in the Sports Composites industry include breakthrough technological innovations such as the development of self-healing composites and advanced additive manufacturing techniques for complex component geometries. Strategic partnerships between material suppliers, equipment manufacturers, and sports organizations are crucial for fostering innovation and market penetration. Market expansion strategies, including the penetration of emerging economies and the development of composite solutions for a wider range of sports, will also accelerate growth. The increasing focus on performance optimization and injury prevention in professional sports continues to drive the demand for cutting-edge composite materials.
Key Players Shaping the Sports Composites Industry Market
- Celanese Corporation
- Dexcraft
- EPSILON Composite
- Exel Composites
- Mitsubishi Chemical Carbon Fiber and Composites Inc
- Rockman
- Rock West Composites
- SGL Carbon
- Toray Industries Inc
- Topkey
Notable Milestones in Sports Composites Industry Sector
- February 2022: Celanese Corporation announced the acquisition of DuPont's Mobility & Materials (M&M) business for USD 11.0 billion. This acquisition will expand the company's product portfolio and extend its reach globally, signaling a significant consolidation trend and strategic expansion within the advanced materials sector impacting the sports composites landscape.
- 2021: Toray Industries Inc. launched a new generation of advanced carbon fiber with enhanced tensile strength and modulus, aiming to further reduce weight and improve performance in high-end sporting goods like golf shafts and bicycle frames.
- 2020: Exel Composites introduced a new range of pultruded composite profiles designed for lighter and more durable sports equipment, including hockey sticks and ski poles, emphasizing increased stiffness and impact resistance.
- 2019: SGL Carbon expanded its production capacity for carbon fibers, anticipating increased demand from the automotive and sports industries for lightweight structural components.
In-Depth Sports Composites Industry Market Outlook
The future outlook for the Sports Composites industry is exceptionally bright, characterized by sustained growth driven by innovation, increasing global sports participation, and a growing appreciation for high-performance materials. Strategic opportunities lie in capitalizing on the demand for sustainable composite solutions, exploring untapped applications in niche sports, and leveraging advancements in digital manufacturing and AI for personalized product development. The continuous evolution of materials science and engineering will undoubtedly unlock new frontiers for composites in sports, promising lighter, stronger, and more advanced equipment that will redefine athletic capabilities and elevate the overall sporting experience. The market is projected to see continued integration of advanced resin systems and intelligent composite structures, further cementing its dominant position.
Sports Composites Industry Segmentation
-
1. Type
- 1.1. Glass-Fibre Reinforced
- 1.2. Carbon-Fibre Reinforced
- 1.3. Other Types
-
2. Resin Type
- 2.1. Epoxy
- 2.2. Polyurethane
- 2.3. Other Resin Types
-
3. Applications
- 3.1. Golf Shafts
- 3.2. Hockey Sticks
- 3.3. Rackets
- 3.4. Bicycles
- 3.5. Skis and Snowboards
- 3.6. Other Applications
Sports Composites Industry Segmentation By Geography
-
1. Asia Pacific
- 1.1. China
- 1.2. India
- 1.3. Japan
- 1.4. South Korea
- 1.5. Rest of Asia Pacific
-
2. North America
- 2.1. United States
- 2.2. Canada
- 2.3. Mexico
-
3. Europe
- 3.1. Germany
- 3.2. United Kingdom
- 3.3. Italy
- 3.4. France
- 3.5. Rest of Europe
-
4. South America
- 4.1. Brazil
- 4.2. Argentina
- 4.3. Rest of South America
-
5. Middle East and Africa
- 5.1. Saudi Arabia
- 5.2. South Africa
- 5.3. Rest of Middle East and Africa
Sports Composites Industry Regional Market Share
Geographic Coverage of Sports Composites Industry
Sports Composites Industry REPORT HIGHLIGHTS
| Aspects | Details |
|---|---|
| Study Period | 2020-2034 |
| Base Year | 2025 |
| Estimated Year | 2026 |
| Forecast Period | 2026-2034 |
| Historical Period | 2020-2025 |
| Growth Rate | CAGR of 5% from 2020-2034 |
| Segmentation |
|
Table of Contents
- 1. Introduction
- 1.1. Research Scope
- 1.2. Market Segmentation
- 1.3. Research Objective
- 1.4. Definitions and Assumptions
- 2. Executive Summary
- 2.1. Market Snapshot
- 3. Market Dynamics
- 3.1. Market Drivers
- 3.2. Market Restrains
- 3.3. Market Trends
- 3.4. Market Opportunities
- 4. Market Factor Analysis
- 4.1. Porters Five Forces
- 4.1.1. Bargaining Power of Suppliers
- 4.1.2. Bargaining Power of Buyers
- 4.1.3. Threat of New Entrants
- 4.1.4. Threat of Substitutes
- 4.1.5. Competitive Rivalry
- 4.2. PESTEL analysis
- 4.3. BCG Analysis
- 4.3.1. Stars (High Growth, High Market Share)
- 4.3.2. Cash Cows (Low Growth, High Market Share)
- 4.3.3. Question Mark (High Growth, Low Market Share)
- 4.3.4. Dogs (Low Growth, Low Market Share)
- 4.4. Ansoff Matrix Analysis
- 4.5. Supply Chain Analysis
- 4.6. Regulatory Landscape
- 4.7. Current Market Potential and Opportunity Assessment (TAM–SAM–SOM Framework)
- 4.8. VDR Analyst Note
- 4.1. Porters Five Forces
- 5. Market Analysis, Insights and Forecast 2021-2033
- 5.1. Market Analysis, Insights and Forecast - by Type
- 5.1.1. Glass-Fibre Reinforced
- 5.1.2. Carbon-Fibre Reinforced
- 5.1.3. Other Types
- 5.2. Market Analysis, Insights and Forecast - by Resin Type
- 5.2.1. Epoxy
- 5.2.2. Polyurethane
- 5.2.3. Other Resin Types
- 5.3. Market Analysis, Insights and Forecast - by Applications
- 5.3.1. Golf Shafts
- 5.3.2. Hockey Sticks
- 5.3.3. Rackets
- 5.3.4. Bicycles
- 5.3.5. Skis and Snowboards
- 5.3.6. Other Applications
- 5.4. Market Analysis, Insights and Forecast - by Region
- 5.4.1. Asia Pacific
- 5.4.2. North America
- 5.4.3. Europe
- 5.4.4. South America
- 5.4.5. Middle East and Africa
- 5.1. Market Analysis, Insights and Forecast - by Type
- 6. Global Sports Composites Industry Analysis, Insights and Forecast, 2021-2033
- 6.1. Market Analysis, Insights and Forecast - by Type
- 6.1.1. Glass-Fibre Reinforced
- 6.1.2. Carbon-Fibre Reinforced
- 6.1.3. Other Types
- 6.2. Market Analysis, Insights and Forecast - by Resin Type
- 6.2.1. Epoxy
- 6.2.2. Polyurethane
- 6.2.3. Other Resin Types
- 6.3. Market Analysis, Insights and Forecast - by Applications
- 6.3.1. Golf Shafts
- 6.3.2. Hockey Sticks
- 6.3.3. Rackets
- 6.3.4. Bicycles
- 6.3.5. Skis and Snowboards
- 6.3.6. Other Applications
- 6.1. Market Analysis, Insights and Forecast - by Type
- 7. Asia Pacific Sports Composites Industry Analysis, Insights and Forecast, 2021-2033
- 7.1. Market Analysis, Insights and Forecast - by Type
- 7.1.1. Glass-Fibre Reinforced
- 7.1.2. Carbon-Fibre Reinforced
- 7.1.3. Other Types
- 7.2. Market Analysis, Insights and Forecast - by Resin Type
- 7.2.1. Epoxy
- 7.2.2. Polyurethane
- 7.2.3. Other Resin Types
- 7.3. Market Analysis, Insights and Forecast - by Applications
- 7.3.1. Golf Shafts
- 7.3.2. Hockey Sticks
- 7.3.3. Rackets
- 7.3.4. Bicycles
- 7.3.5. Skis and Snowboards
- 7.3.6. Other Applications
- 7.1. Market Analysis, Insights and Forecast - by Type
- 8. North America Sports Composites Industry Analysis, Insights and Forecast, 2021-2033
- 8.1. Market Analysis, Insights and Forecast - by Type
- 8.1.1. Glass-Fibre Reinforced
- 8.1.2. Carbon-Fibre Reinforced
- 8.1.3. Other Types
- 8.2. Market Analysis, Insights and Forecast - by Resin Type
- 8.2.1. Epoxy
- 8.2.2. Polyurethane
- 8.2.3. Other Resin Types
- 8.3. Market Analysis, Insights and Forecast - by Applications
- 8.3.1. Golf Shafts
- 8.3.2. Hockey Sticks
- 8.3.3. Rackets
- 8.3.4. Bicycles
- 8.3.5. Skis and Snowboards
- 8.3.6. Other Applications
- 8.1. Market Analysis, Insights and Forecast - by Type
- 9. Europe Sports Composites Industry Analysis, Insights and Forecast, 2021-2033
- 9.1. Market Analysis, Insights and Forecast - by Type
- 9.1.1. Glass-Fibre Reinforced
- 9.1.2. Carbon-Fibre Reinforced
- 9.1.3. Other Types
- 9.2. Market Analysis, Insights and Forecast - by Resin Type
- 9.2.1. Epoxy
- 9.2.2. Polyurethane
- 9.2.3. Other Resin Types
- 9.3. Market Analysis, Insights and Forecast - by Applications
- 9.3.1. Golf Shafts
- 9.3.2. Hockey Sticks
- 9.3.3. Rackets
- 9.3.4. Bicycles
- 9.3.5. Skis and Snowboards
- 9.3.6. Other Applications
- 9.1. Market Analysis, Insights and Forecast - by Type
- 10. South America Sports Composites Industry Analysis, Insights and Forecast, 2021-2033
- 10.1. Market Analysis, Insights and Forecast - by Type
- 10.1.1. Glass-Fibre Reinforced
- 10.1.2. Carbon-Fibre Reinforced
- 10.1.3. Other Types
- 10.2. Market Analysis, Insights and Forecast - by Resin Type
- 10.2.1. Epoxy
- 10.2.2. Polyurethane
- 10.2.3. Other Resin Types
- 10.3. Market Analysis, Insights and Forecast - by Applications
- 10.3.1. Golf Shafts
- 10.3.2. Hockey Sticks
- 10.3.3. Rackets
- 10.3.4. Bicycles
- 10.3.5. Skis and Snowboards
- 10.3.6. Other Applications
- 10.1. Market Analysis, Insights and Forecast - by Type
- 11. Middle East and Africa Sports Composites Industry Analysis, Insights and Forecast, 2021-2033
- 11.1. Market Analysis, Insights and Forecast - by Type
- 11.1.1. Glass-Fibre Reinforced
- 11.1.2. Carbon-Fibre Reinforced
- 11.1.3. Other Types
- 11.2. Market Analysis, Insights and Forecast - by Resin Type
- 11.2.1. Epoxy
- 11.2.2. Polyurethane
- 11.2.3. Other Resin Types
- 11.3. Market Analysis, Insights and Forecast - by Applications
- 11.3.1. Golf Shafts
- 11.3.2. Hockey Sticks
- 11.3.3. Rackets
- 11.3.4. Bicycles
- 11.3.5. Skis and Snowboards
- 11.3.6. Other Applications
- 11.1. Market Analysis, Insights and Forecast - by Type
- 12. Competitive Analysis
- 12.1. Company Profiles
- 12.1.1 Celanese Corporation
- 12.1.1.1. Company Overview
- 12.1.1.2. Products
- 12.1.1.3. Company Financials
- 12.1.1.4. SWOT Analysis
- 12.1.2 Dexcraft
- 12.1.2.1. Company Overview
- 12.1.2.2. Products
- 12.1.2.3. Company Financials
- 12.1.2.4. SWOT Analysis
- 12.1.3 EPSILON Composite
- 12.1.3.1. Company Overview
- 12.1.3.2. Products
- 12.1.3.3. Company Financials
- 12.1.3.4. SWOT Analysis
- 12.1.4 Exel Composites
- 12.1.4.1. Company Overview
- 12.1.4.2. Products
- 12.1.4.3. Company Financials
- 12.1.4.4. SWOT Analysis
- 12.1.5 Mitsubishi Chemical Carbon Fiber and Composites Inc
- 12.1.5.1. Company Overview
- 12.1.5.2. Products
- 12.1.5.3. Company Financials
- 12.1.5.4. SWOT Analysis
- 12.1.6 Rockman
- 12.1.6.1. Company Overview
- 12.1.6.2. Products
- 12.1.6.3. Company Financials
- 12.1.6.4. SWOT Analysis
- 12.1.7 Rock West Composites
- 12.1.7.1. Company Overview
- 12.1.7.2. Products
- 12.1.7.3. Company Financials
- 12.1.7.4. SWOT Analysis
- 12.1.8 SGL Carbon
- 12.1.8.1. Company Overview
- 12.1.8.2. Products
- 12.1.8.3. Company Financials
- 12.1.8.4. SWOT Analysis
- 12.1.9 Toray Industries Inc
- 12.1.9.1. Company Overview
- 12.1.9.2. Products
- 12.1.9.3. Company Financials
- 12.1.9.4. SWOT Analysis
- 12.1.10 Topkey*List Not Exhaustive
- 12.1.10.1. Company Overview
- 12.1.10.2. Products
- 12.1.10.3. Company Financials
- 12.1.10.4. SWOT Analysis
- 12.1.1 Celanese Corporation
- 12.2. Market Entropy
- 12.2.1 Company's Key Areas Served
- 12.2.2 Recent Developments
- 12.3. Company Market Share Analysis 2025
- 12.3.1 Top 5 Companies Market Share Analysis
- 12.3.2 Top 3 Companies Market Share Analysis
- 12.4. List of Potential Customers
- 13. Research Methodology
List of Figures
- Figure 1: Global Sports Composites Industry Revenue Breakdown (billion, %) by Region 2025 & 2033
- Figure 2: Asia Pacific Sports Composites Industry Revenue (billion), by Type 2025 & 2033
- Figure 3: Asia Pacific Sports Composites Industry Revenue Share (%), by Type 2025 & 2033
- Figure 4: Asia Pacific Sports Composites Industry Revenue (billion), by Resin Type 2025 & 2033
- Figure 5: Asia Pacific Sports Composites Industry Revenue Share (%), by Resin Type 2025 & 2033
- Figure 6: Asia Pacific Sports Composites Industry Revenue (billion), by Applications 2025 & 2033
- Figure 7: Asia Pacific Sports Composites Industry Revenue Share (%), by Applications 2025 & 2033
- Figure 8: Asia Pacific Sports Composites Industry Revenue (billion), by Country 2025 & 2033
- Figure 9: Asia Pacific Sports Composites Industry Revenue Share (%), by Country 2025 & 2033
- Figure 10: North America Sports Composites Industry Revenue (billion), by Type 2025 & 2033
- Figure 11: North America Sports Composites Industry Revenue Share (%), by Type 2025 & 2033
- Figure 12: North America Sports Composites Industry Revenue (billion), by Resin Type 2025 & 2033
- Figure 13: North America Sports Composites Industry Revenue Share (%), by Resin Type 2025 & 2033
- Figure 14: North America Sports Composites Industry Revenue (billion), by Applications 2025 & 2033
- Figure 15: North America Sports Composites Industry Revenue Share (%), by Applications 2025 & 2033
- Figure 16: North America Sports Composites Industry Revenue (billion), by Country 2025 & 2033
- Figure 17: North America Sports Composites Industry Revenue Share (%), by Country 2025 & 2033
- Figure 18: Europe Sports Composites Industry Revenue (billion), by Type 2025 & 2033
- Figure 19: Europe Sports Composites Industry Revenue Share (%), by Type 2025 & 2033
- Figure 20: Europe Sports Composites Industry Revenue (billion), by Resin Type 2025 & 2033
- Figure 21: Europe Sports Composites Industry Revenue Share (%), by Resin Type 2025 & 2033
- Figure 22: Europe Sports Composites Industry Revenue (billion), by Applications 2025 & 2033
- Figure 23: Europe Sports Composites Industry Revenue Share (%), by Applications 2025 & 2033
- Figure 24: Europe Sports Composites Industry Revenue (billion), by Country 2025 & 2033
- Figure 25: Europe Sports Composites Industry Revenue Share (%), by Country 2025 & 2033
- Figure 26: South America Sports Composites Industry Revenue (billion), by Type 2025 & 2033
- Figure 27: South America Sports Composites Industry Revenue Share (%), by Type 2025 & 2033
- Figure 28: South America Sports Composites Industry Revenue (billion), by Resin Type 2025 & 2033
- Figure 29: South America Sports Composites Industry Revenue Share (%), by Resin Type 2025 & 2033
- Figure 30: South America Sports Composites Industry Revenue (billion), by Applications 2025 & 2033
- Figure 31: South America Sports Composites Industry Revenue Share (%), by Applications 2025 & 2033
- Figure 32: South America Sports Composites Industry Revenue (billion), by Country 2025 & 2033
- Figure 33: South America Sports Composites Industry Revenue Share (%), by Country 2025 & 2033
- Figure 34: Middle East and Africa Sports Composites Industry Revenue (billion), by Type 2025 & 2033
- Figure 35: Middle East and Africa Sports Composites Industry Revenue Share (%), by Type 2025 & 2033
- Figure 36: Middle East and Africa Sports Composites Industry Revenue (billion), by Resin Type 2025 & 2033
- Figure 37: Middle East and Africa Sports Composites Industry Revenue Share (%), by Resin Type 2025 & 2033
- Figure 38: Middle East and Africa Sports Composites Industry Revenue (billion), by Applications 2025 & 2033
- Figure 39: Middle East and Africa Sports Composites Industry Revenue Share (%), by Applications 2025 & 2033
- Figure 40: Middle East and Africa Sports Composites Industry Revenue (billion), by Country 2025 & 2033
- Figure 41: Middle East and Africa Sports Composites Industry Revenue Share (%), by Country 2025 & 2033
List of Tables
- Table 1: Global Sports Composites Industry Revenue billion Forecast, by Type 2020 & 2033
- Table 2: Global Sports Composites Industry Revenue billion Forecast, by Resin Type 2020 & 2033
- Table 3: Global Sports Composites Industry Revenue billion Forecast, by Applications 2020 & 2033
- Table 4: Global Sports Composites Industry Revenue billion Forecast, by Region 2020 & 2033
- Table 5: Global Sports Composites Industry Revenue billion Forecast, by Type 2020 & 2033
- Table 6: Global Sports Composites Industry Revenue billion Forecast, by Resin Type 2020 & 2033
- Table 7: Global Sports Composites Industry Revenue billion Forecast, by Applications 2020 & 2033
- Table 8: Global Sports Composites Industry Revenue billion Forecast, by Country 2020 & 2033
- Table 9: China Sports Composites Industry Revenue (billion) Forecast, by Application 2020 & 2033
- Table 10: India Sports Composites Industry Revenue (billion) Forecast, by Application 2020 & 2033
- Table 11: Japan Sports Composites Industry Revenue (billion) Forecast, by Application 2020 & 2033
- Table 12: South Korea Sports Composites Industry Revenue (billion) Forecast, by Application 2020 & 2033
- Table 13: Rest of Asia Pacific Sports Composites Industry Revenue (billion) Forecast, by Application 2020 & 2033
- Table 14: Global Sports Composites Industry Revenue billion Forecast, by Type 2020 & 2033
- Table 15: Global Sports Composites Industry Revenue billion Forecast, by Resin Type 2020 & 2033
- Table 16: Global Sports Composites Industry Revenue billion Forecast, by Applications 2020 & 2033
- Table 17: Global Sports Composites Industry Revenue billion Forecast, by Country 2020 & 2033
- Table 18: United States Sports Composites Industry Revenue (billion) Forecast, by Application 2020 & 2033
- Table 19: Canada Sports Composites Industry Revenue (billion) Forecast, by Application 2020 & 2033
- Table 20: Mexico Sports Composites Industry Revenue (billion) Forecast, by Application 2020 & 2033
- Table 21: Global Sports Composites Industry Revenue billion Forecast, by Type 2020 & 2033
- Table 22: Global Sports Composites Industry Revenue billion Forecast, by Resin Type 2020 & 2033
- Table 23: Global Sports Composites Industry Revenue billion Forecast, by Applications 2020 & 2033
- Table 24: Global Sports Composites Industry Revenue billion Forecast, by Country 2020 & 2033
- Table 25: Germany Sports Composites Industry Revenue (billion) Forecast, by Application 2020 & 2033
- Table 26: United Kingdom Sports Composites Industry Revenue (billion) Forecast, by Application 2020 & 2033
- Table 27: Italy Sports Composites Industry Revenue (billion) Forecast, by Application 2020 & 2033
- Table 28: France Sports Composites Industry Revenue (billion) Forecast, by Application 2020 & 2033
- Table 29: Rest of Europe Sports Composites Industry Revenue (billion) Forecast, by Application 2020 & 2033
- Table 30: Global Sports Composites Industry Revenue billion Forecast, by Type 2020 & 2033
- Table 31: Global Sports Composites Industry Revenue billion Forecast, by Resin Type 2020 & 2033
- Table 32: Global Sports Composites Industry Revenue billion Forecast, by Applications 2020 & 2033
- Table 33: Global Sports Composites Industry Revenue billion Forecast, by Country 2020 & 2033
- Table 34: Brazil Sports Composites Industry Revenue (billion) Forecast, by Application 2020 & 2033
- Table 35: Argentina Sports Composites Industry Revenue (billion) Forecast, by Application 2020 & 2033
- Table 36: Rest of South America Sports Composites Industry Revenue (billion) Forecast, by Application 2020 & 2033
- Table 37: Global Sports Composites Industry Revenue billion Forecast, by Type 2020 & 2033
- Table 38: Global Sports Composites Industry Revenue billion Forecast, by Resin Type 2020 & 2033
- Table 39: Global Sports Composites Industry Revenue billion Forecast, by Applications 2020 & 2033
- Table 40: Global Sports Composites Industry Revenue billion Forecast, by Country 2020 & 2033
- Table 41: Saudi Arabia Sports Composites Industry Revenue (billion) Forecast, by Application 2020 & 2033
- Table 42: South Africa Sports Composites Industry Revenue (billion) Forecast, by Application 2020 & 2033
- Table 43: Rest of Middle East and Africa Sports Composites Industry Revenue (billion) Forecast, by Application 2020 & 2033
Frequently Asked Questions
1. What is the projected Compound Annual Growth Rate (CAGR) of the Sports Composites Industry?
The projected CAGR is approximately 5%.
2. Which companies are prominent players in the Sports Composites Industry?
Key companies in the market include Celanese Corporation, Dexcraft, EPSILON Composite, Exel Composites, Mitsubishi Chemical Carbon Fiber and Composites Inc, Rockman, Rock West Composites, SGL Carbon, Toray Industries Inc, Topkey*List Not Exhaustive.
3. What are the main segments of the Sports Composites Industry?
The market segments include Type, Resin Type, Applications.
4. Can you provide details about the market size?
The market size is estimated to be USD 5.05 billion as of 2022.
5. What are some drivers contributing to market growth?
Increasing Demand for Lightweight and High-Performance Sports Equipment; Growing Golf Industry.
6. What are the notable trends driving market growth?
Increasing Demand for Skis and Snowboards.
7. Are there any restraints impacting market growth?
Increasing Demand for Lightweight and High-Performance Sports Equipment; Growing Golf Industry.
8. Can you provide examples of recent developments in the market?
In February 2022, Celanese Corporation announced the acquisition of DuPont's Mobility & Materials (M&M) business for USD 11.0 billion. This acquisition will expand the company's product portfolio and extend its reach globally.
9. What pricing options are available for accessing the report?
Pricing options include single-user, multi-user, and enterprise licenses priced at USD 4750, USD 5250, and USD 8750 respectively.
10. Is the market size provided in terms of value or volume?
The market size is provided in terms of value, measured in billion.
11. Are there any specific market keywords associated with the report?
Yes, the market keyword associated with the report is "Sports Composites Industry," which aids in identifying and referencing the specific market segment covered.
12. How do I determine which pricing option suits my needs best?
The pricing options vary based on user requirements and access needs. Individual users may opt for single-user licenses, while businesses requiring broader access may choose multi-user or enterprise licenses for cost-effective access to the report.
13. Are there any additional resources or data provided in the Sports Composites Industry report?
While the report offers comprehensive insights, it's advisable to review the specific contents or supplementary materials provided to ascertain if additional resources or data are available.
14. How can I stay updated on further developments or reports in the Sports Composites Industry?
To stay informed about further developments, trends, and reports in the Sports Composites Industry, consider subscribing to industry newsletters, following relevant companies and organizations, or regularly checking reputable industry news sources and publications.
Methodology
Step 1 - Identification of Relevant Samples Size from Population Database


Step 2 - Approaches for Defining Global Market Size (Value, Volume* & Price*)

Note*: In applicable scenarios
Step 3 - Data Sources
Primary Research
- Web Analytics
- Survey Reports
- Research Institute
- Latest Research Reports
- Opinion Leaders
Secondary Research
- Annual Reports
- White Paper
- Latest Press Release
- Industry Association
- Paid Database
- Investor Presentations

Step 4 - Data Triangulation
Involves using different sources of information in order to increase the validity of a study
These sources are likely to be stakeholders in a program - participants, other researchers, program staff, other community members, and so on.
Then we put all data in single framework & apply various statistical tools to find out the dynamic on the market.
During the analysis stage, feedback from the stakeholder groups would be compared to determine areas of agreement as well as areas of divergence