
Key Insights
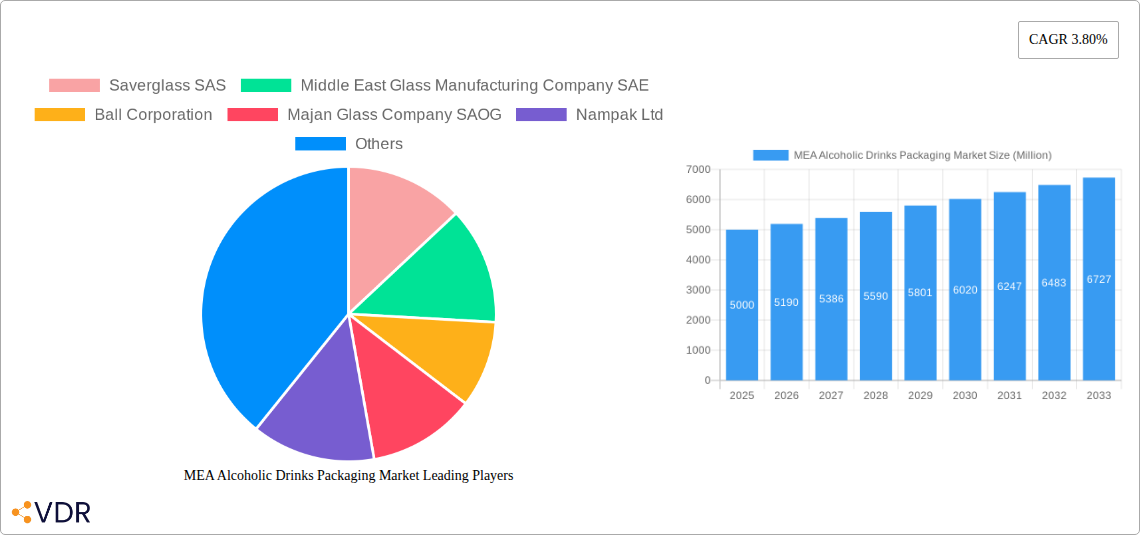
The Middle East and Africa (MEA) alcoholic drinks packaging market is experiencing steady growth, projected to maintain a Compound Annual Growth Rate (CAGR) of 3.80% from 2025 to 2033. This expansion is driven by several factors. Firstly, a rising disposable income and changing lifestyles in several MEA countries are fueling increased alcohol consumption, consequently boosting demand for packaging solutions. Secondly, the increasing preference for convenient and premium packaging formats, such as sleek glass bottles and innovative cans, is driving market growth. The burgeoning tourism sector in key MEA countries also contributes to the demand for attractive and functional packaging to meet the needs of diverse consumer preferences. Finally, technological advancements in packaging materials and production techniques are leading to more sustainable and cost-effective options. The market is segmented by primary material (glass, metal, plastic, paper), alcoholic product (wine, spirits, beer, others), product type (bottles, cans, etc.), and country, offering diverse opportunities for businesses.
However, the market faces certain restraints. Fluctuations in raw material prices, particularly for glass and metal, can impact packaging costs and profitability. Furthermore, stringent regulations regarding alcohol content and labeling in some MEA countries impose challenges for packaging manufacturers. Environmental concerns related to plastic waste are also prompting a shift toward sustainable alternatives like recycled glass and paper-based packaging, requiring companies to adapt and innovate. The competitive landscape includes both international players with established brand recognition and local manufacturers focusing on regional preferences. This dynamic interplay between market drivers, challenges, and evolving consumer preferences shapes the MEA alcoholic drinks packaging market’s trajectory. The forecast indicates a significant expansion in the market's value over the next decade, suggesting attractive investment prospects for businesses adapting to the evolving needs of the industry.
MEA Alcoholic Drinks Packaging Market: A Comprehensive Report (2019-2033)
This in-depth report provides a comprehensive analysis of the Middle East and Africa (MEA) Alcoholic Drinks Packaging Market, offering invaluable insights for industry professionals, investors, and strategic decision-makers. With a focus on market dynamics, growth trends, and competitive landscape, this report covers the period from 2019 to 2033, with a base year of 2025. The report segments the market by primary material (glass, metal, plastic, paper), alcoholic product (wine, spirits, beer, others), product type (bottles, cans, etc.), and country (UAE, South Africa, Egypt, Turkey, Rest of MEA). The total market size is projected to reach xx Million units by 2033.
MEA Alcoholic Drinks Packaging Market Dynamics & Structure
The MEA alcoholic drinks packaging market is characterized by a moderately concentrated landscape, with several major players holding significant market share. However, the emergence of smaller, specialized companies focusing on sustainable and innovative packaging solutions is steadily increasing competition. Technological innovation is a key driver, with a strong emphasis on lightweighting, recyclability, and improved barrier properties to enhance product shelf life and reduce environmental impact. Regulatory frameworks, particularly concerning sustainability and labeling, are evolving, creating both challenges and opportunities for market players. The market witnesses a substantial substitution effect, particularly with the growing preference for sustainable alternatives to traditional glass and plastic packaging. End-user demographics, including changing consumption patterns and evolving preferences for premium alcoholic beverages, significantly influence packaging choices. M&A activity is moderate, with larger players strategically acquiring smaller companies to expand their product portfolios and geographic reach.
Quantitative Insights:
- Market Concentration: xx% held by top 5 players (2024)
- M&A Deal Volume (2019-2024): xx deals
- Market Share of Glass Packaging (2024): xx%
Qualitative Factors:
- Innovation Barriers: High initial investment costs for new technologies, regulatory hurdles.
- Sustainability Concerns: Growing pressure to adopt eco-friendly packaging solutions.
- Consumer Preferences: Shift towards premiumization and convenience drives packaging innovation.
MEA Alcoholic Drinks Packaging Market Growth Trends & Insights
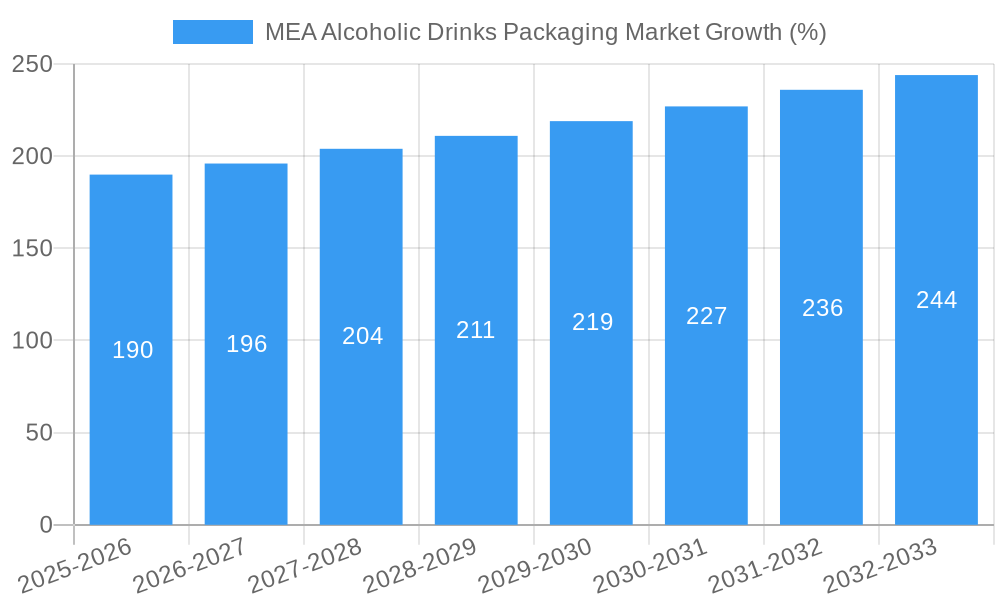
The MEA alcoholic drinks packaging market exhibits robust growth, driven by rising disposable incomes, increasing urbanization, and a burgeoning alcoholic beverage industry. The market size experienced a CAGR of xx% during the historical period (2019-2024) and is projected to register a CAGR of xx% during the forecast period (2025-2033). This growth is attributed to several factors, including the rising popularity of craft beers and premium spirits, the increasing demand for convenient packaging formats, and the growing adoption of sustainable packaging solutions. Technological disruptions, such as the introduction of lightweight materials and innovative closure systems, are further fueling market expansion. Consumer behavior shifts, notably towards eco-conscious choices and a preference for on-the-go consumption, are reshaping the packaging landscape. The market penetration of sustainable packaging is expected to increase significantly in the coming years, driven by both consumer demand and regulatory pressure. The adoption of advanced technologies like smart packaging and tamper-evident closures is also gaining traction.
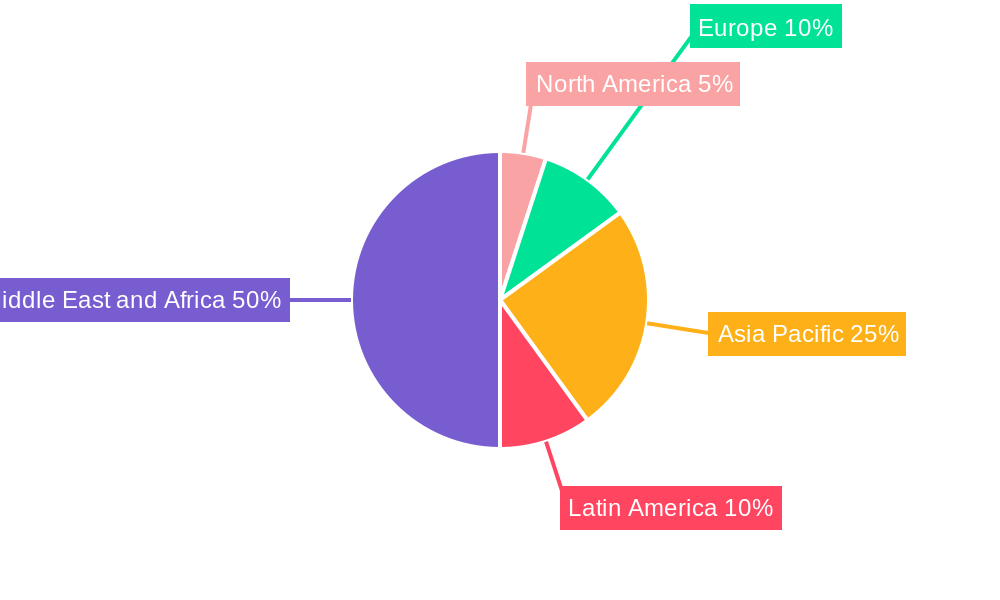
Dominant Regions, Countries, or Segments in MEA Alcoholic Drinks Packaging Market
The UAE and South Africa are currently the leading markets within the MEA region, driven by robust economic growth, established alcoholic beverage industries, and relatively advanced packaging infrastructure. However, countries like Egypt and Turkey also exhibit high growth potential due to expanding middle classes and rising alcohol consumption.
By Primary Material: Glass remains the dominant primary material due to its perceived quality and premium image, although metal (cans) is gaining traction for its cost-effectiveness and recyclability.
By Alcoholic Product: Spirits and beer segments drive the most significant demand for packaging, followed by wine.
By Product Type: Glass bottles are the most widely used product type, followed by metal cans, reflecting the established preferences of consumers and producers.
Key Drivers:
- Economic Growth: Rising disposable incomes and increased spending on alcoholic beverages.
- Infrastructure Development: Improvements in logistics and supply chain networks.
- Tourism: Growth in the tourism sector drives demand for premium packaging.
- Government Regulations: Increasing emphasis on sustainability promotes eco-friendly packaging.
Dominance Factors:
- Market Share: The UAE and South Africa hold the largest market share due to their established alcoholic beverage industries and high consumption rates.
- Growth Potential: Egypt and Turkey present promising growth opportunities due to their expanding consumer base and increasing alcohol consumption.
MEA Alcoholic Drinks Packaging Market Product Landscape
The MEA alcoholic drinks packaging market showcases a diverse range of products, with ongoing innovation in materials, designs, and functionalities. Lightweighting, enhanced barrier properties, and improved recyclability are key areas of focus. New closure systems enhance consumer convenience and tamper evidence. Sustainable packaging options made from recycled materials and biodegradable polymers are gaining popularity, addressing growing environmental concerns. Unique selling propositions include aesthetically pleasing designs, convenient formats, and the incorporation of branding features to enhance shelf appeal. Technological advancements include the integration of smart labels and track-and-trace capabilities.
Key Drivers, Barriers & Challenges in MEA Alcoholic Drinks Packaging Market
Key Drivers:
- Increasing alcoholic beverage consumption driven by rising disposable incomes and changing lifestyles.
- Growing demand for convenient and sustainable packaging solutions.
- Technological advancements in materials science and packaging technologies.
Challenges & Restraints:
- Fluctuating raw material prices impacting production costs. (Impact: xx% increase in production cost in 2024)
- Stringent regulatory requirements for labeling and materials compliance. (Impact: xx% increase in compliance costs in 2024)
- Intense competition among packaging providers. (Impact: xx% reduction in profit margins in 2024 for smaller players)
- Supply chain disruptions due to geopolitical instability.
Emerging Opportunities in MEA Alcoholic Drinks Packaging Market
- Growing demand for sustainable and eco-friendly packaging solutions made from recycled materials and biodegradable polymers.
- Increased adoption of innovative packaging formats such as pouches, cans, and flexible packaging.
- Expansion into untapped markets with high growth potential.
- Rising demand for premium and customized packaging for high-value alcoholic beverages.
Growth Accelerators in the MEA Alcoholic Drinks Packaging Market Industry
The long-term growth of the MEA alcoholic drinks packaging market will be driven by technological advancements enabling the creation of lightweight, sustainable, and tamper-evident packaging. Strategic partnerships between packaging manufacturers and alcoholic beverage companies will foster innovation and collaboration. Expansion into new markets and regions will unlock significant growth potential.
Key Players Shaping the MEA Alcoholic Drinks Packaging Market Market
- Saverglass SAS
- Middle East Glass Manufacturing Company SAE
- Ball Corporation
- Majan Glass Company SAOG
- Nampak Ltd
- The National Company For Glass Industries (Zouja)
- Crown Holdings Inc
- Can-Pack S.A.
- Saudi Arabian Glass Co Ltd
- Huhtamäki Oyj
- Bonpak (Pty) Ltd
- Consol Glass Ltd
Notable Milestones in MEA Alcoholic Drinks Packaging Market Sector
- August 2021: Huhtamäki Oyj acquired Elif Holding AŞ, expanding its presence in Turkey and Egypt and boosting its sustainability initiatives. This significantly impacted the market by introducing more sustainable packaging solutions.
- August 2021: Ball Corporation's commitment to aluminum as a sustainable alternative to plastic positions it as a key innovator, potentially altering market share in the long term.
In-Depth MEA Alcoholic Drinks Packaging Market Market Outlook
The MEA alcoholic drinks packaging market is poised for significant growth in the coming years, driven by sustained economic growth, rising consumer demand, and increasing adoption of sustainable packaging solutions. Strategic investments in innovation, sustainable practices, and expansion into new markets will be crucial for companies seeking to capitalize on this promising market opportunity. The focus on lightweighting, recyclability, and eco-friendly materials will continue to shape industry trends, presenting significant opportunities for companies that can effectively adapt to the changing market dynamics.
MEA Alcoholic Drinks Packaging Market Segmentation
-
1. Primary Material
- 1.1. Glass
- 1.2. Metal
- 1.3. Plastic
- 1.4. Paper
-
2. Alcoholic Products
- 2.1. Wine
- 2.2. Spirits
- 2.3. Beer
- 2.4. Other Types of Alcoholic Beverages
-
3. Product Type
- 3.1. Glass Bottles
- 3.2. Metal Cans
- 3.3. Plastic Bottles
- 3.4. Other Product Types
MEA Alcoholic Drinks Packaging Market Segmentation By Geography
-
1. North America
- 1.1. United States
- 1.2. Canada
- 1.3. Mexico
-
2. South America
- 2.1. Brazil
- 2.2. Argentina
- 2.3. Rest of South America
-
3. Europe
- 3.1. United Kingdom
- 3.2. Germany
- 3.3. France
- 3.4. Italy
- 3.5. Spain
- 3.6. Russia
- 3.7. Benelux
- 3.8. Nordics
- 3.9. Rest of Europe
-
4. Middle East & Africa
- 4.1. Turkey
- 4.2. Israel
- 4.3. GCC
- 4.4. North Africa
- 4.5. South Africa
- 4.6. Rest of Middle East & Africa
-
5. Asia Pacific
- 5.1. China
- 5.2. India
- 5.3. Japan
- 5.4. South Korea
- 5.5. ASEAN
- 5.6. Oceania
- 5.7. Rest of Asia Pacific
MEA Alcoholic Drinks Packaging Market REPORT HIGHLIGHTS
| Aspects | Details |
|---|---|
| Study Period | 2019-2033 |
| Base Year | 2024 |
| Estimated Year | 2025 |
| Forecast Period | 2025-2033 |
| Historical Period | 2019-2024 |
| Growth Rate | CAGR of 3.80% from 2019-2033 |
| Segmentation |
|
Table of Contents
- 1. Introduction
- 1.1. Research Scope
- 1.2. Market Segmentation
- 1.3. Research Methodology
- 1.4. Definitions and Assumptions
- 2. Executive Summary
- 2.1. Introduction
- 3. Market Dynamics
- 3.1. Introduction
- 3.2. Market Drivers
- 3.2.1. Growth in Purchasing Power of Consumers; Growing Awareness Among Alcoholic Beverage Manufacturers to Differentiate Their Products Over Packaging
- 3.3. Market Restrains
- 3.3.1. Presence of Alternate Packaging Solutions
- 3.4. Market Trends
- 3.4.1. Metal Can Packaging is Expected to Grow Significantly
- 4. Market Factor Analysis
- 4.1. Porters Five Forces
- 4.2. Supply/Value Chain
- 4.3. PESTEL analysis
- 4.4. Market Entropy
- 4.5. Patent/Trademark Analysis
- 5. Global MEA Alcoholic Drinks Packaging Market Analysis, Insights and Forecast, 2019-2031
- 5.1. Market Analysis, Insights and Forecast - by Primary Material
- 5.1.1. Glass
- 5.1.2. Metal
- 5.1.3. Plastic
- 5.1.4. Paper
- 5.2. Market Analysis, Insights and Forecast - by Alcoholic Products
- 5.2.1. Wine
- 5.2.2. Spirits
- 5.2.3. Beer
- 5.2.4. Other Types of Alcoholic Beverages
- 5.3. Market Analysis, Insights and Forecast - by Product Type
- 5.3.1. Glass Bottles
- 5.3.2. Metal Cans
- 5.3.3. Plastic Bottles
- 5.3.4. Other Product Types
- 5.4. Market Analysis, Insights and Forecast - by Region
- 5.4.1. North America
- 5.4.2. South America
- 5.4.3. Europe
- 5.4.4. Middle East & Africa
- 5.4.5. Asia Pacific
- 5.1. Market Analysis, Insights and Forecast - by Primary Material
- 6. North America MEA Alcoholic Drinks Packaging Market Analysis, Insights and Forecast, 2019-2031
- 6.1. Market Analysis, Insights and Forecast - by Primary Material
- 6.1.1. Glass
- 6.1.2. Metal
- 6.1.3. Plastic
- 6.1.4. Paper
- 6.2. Market Analysis, Insights and Forecast - by Alcoholic Products
- 6.2.1. Wine
- 6.2.2. Spirits
- 6.2.3. Beer
- 6.2.4. Other Types of Alcoholic Beverages
- 6.3. Market Analysis, Insights and Forecast - by Product Type
- 6.3.1. Glass Bottles
- 6.3.2. Metal Cans
- 6.3.3. Plastic Bottles
- 6.3.4. Other Product Types
- 6.1. Market Analysis, Insights and Forecast - by Primary Material
- 7. South America MEA Alcoholic Drinks Packaging Market Analysis, Insights and Forecast, 2019-2031
- 7.1. Market Analysis, Insights and Forecast - by Primary Material
- 7.1.1. Glass
- 7.1.2. Metal
- 7.1.3. Plastic
- 7.1.4. Paper
- 7.2. Market Analysis, Insights and Forecast - by Alcoholic Products
- 7.2.1. Wine
- 7.2.2. Spirits
- 7.2.3. Beer
- 7.2.4. Other Types of Alcoholic Beverages
- 7.3. Market Analysis, Insights and Forecast - by Product Type
- 7.3.1. Glass Bottles
- 7.3.2. Metal Cans
- 7.3.3. Plastic Bottles
- 7.3.4. Other Product Types
- 7.1. Market Analysis, Insights and Forecast - by Primary Material
- 8. Europe MEA Alcoholic Drinks Packaging Market Analysis, Insights and Forecast, 2019-2031
- 8.1. Market Analysis, Insights and Forecast - by Primary Material
- 8.1.1. Glass
- 8.1.2. Metal
- 8.1.3. Plastic
- 8.1.4. Paper
- 8.2. Market Analysis, Insights and Forecast - by Alcoholic Products
- 8.2.1. Wine
- 8.2.2. Spirits
- 8.2.3. Beer
- 8.2.4. Other Types of Alcoholic Beverages
- 8.3. Market Analysis, Insights and Forecast - by Product Type
- 8.3.1. Glass Bottles
- 8.3.2. Metal Cans
- 8.3.3. Plastic Bottles
- 8.3.4. Other Product Types
- 8.1. Market Analysis, Insights and Forecast - by Primary Material
- 9. Middle East & Africa MEA Alcoholic Drinks Packaging Market Analysis, Insights and Forecast, 2019-2031
- 9.1. Market Analysis, Insights and Forecast - by Primary Material
- 9.1.1. Glass
- 9.1.2. Metal
- 9.1.3. Plastic
- 9.1.4. Paper
- 9.2. Market Analysis, Insights and Forecast - by Alcoholic Products
- 9.2.1. Wine
- 9.2.2. Spirits
- 9.2.3. Beer
- 9.2.4. Other Types of Alcoholic Beverages
- 9.3. Market Analysis, Insights and Forecast - by Product Type
- 9.3.1. Glass Bottles
- 9.3.2. Metal Cans
- 9.3.3. Plastic Bottles
- 9.3.4. Other Product Types
- 9.1. Market Analysis, Insights and Forecast - by Primary Material
- 10. Asia Pacific MEA Alcoholic Drinks Packaging Market Analysis, Insights and Forecast, 2019-2031
- 10.1. Market Analysis, Insights and Forecast - by Primary Material
- 10.1.1. Glass
- 10.1.2. Metal
- 10.1.3. Plastic
- 10.1.4. Paper
- 10.2. Market Analysis, Insights and Forecast - by Alcoholic Products
- 10.2.1. Wine
- 10.2.2. Spirits
- 10.2.3. Beer
- 10.2.4. Other Types of Alcoholic Beverages
- 10.3. Market Analysis, Insights and Forecast - by Product Type
- 10.3.1. Glass Bottles
- 10.3.2. Metal Cans
- 10.3.3. Plastic Bottles
- 10.3.4. Other Product Types
- 10.1. Market Analysis, Insights and Forecast - by Primary Material
- 11. North America MEA Alcoholic Drinks Packaging Market Analysis, Insights and Forecast, 2019-2031
- 11.1. Market Analysis, Insights and Forecast - By Country/Sub-region
- 11.1.1 United States
- 11.1.2 Canada
- 12. Europe MEA Alcoholic Drinks Packaging Market Analysis, Insights and Forecast, 2019-2031
- 12.1. Market Analysis, Insights and Forecast - By Country/Sub-region
- 12.1.1 United Kingdom
- 12.1.2 Germany
- 12.1.3 France
- 12.1.4 Spain
- 12.1.5 Rest of Europe
- 13. Asia Pacific MEA Alcoholic Drinks Packaging Market Analysis, Insights and Forecast, 2019-2031
- 13.1. Market Analysis, Insights and Forecast - By Country/Sub-region
- 13.1.1 China
- 13.1.2 India
- 13.1.3 Japan
- 13.1.4 South Korea
- 13.1.5 Thailand
- 13.1.6 Rest of Asia Pacific
- 14. Latin America MEA Alcoholic Drinks Packaging Market Analysis, Insights and Forecast, 2019-2031
- 14.1. Market Analysis, Insights and Forecast - By Country/Sub-region
- 14.1.1 Brazil
- 14.1.2 Mexico
- 14.1.3 Rest of Latin America
- 15. Middle East and Africa MEA Alcoholic Drinks Packaging Market Analysis, Insights and Forecast, 2019-2031
- 15.1. Market Analysis, Insights and Forecast - By Country/Sub-region
- 15.1.1 United Arab Emirates
- 15.1.2 Saudi Arabia
- 15.1.3 South Africa
- 15.1.4 Rest of Middle East
- 16. Competitive Analysis
- 16.1. Global Market Share Analysis 2024
- 16.2. Company Profiles
- 16.2.1 Saverglass SAS
- 16.2.1.1. Overview
- 16.2.1.2. Products
- 16.2.1.3. SWOT Analysis
- 16.2.1.4. Recent Developments
- 16.2.1.5. Financials (Based on Availability)
- 16.2.2 Middle East Glass Manufacturing Company SAE
- 16.2.2.1. Overview
- 16.2.2.2. Products
- 16.2.2.3. SWOT Analysis
- 16.2.2.4. Recent Developments
- 16.2.2.5. Financials (Based on Availability)
- 16.2.3 Ball Corporation
- 16.2.3.1. Overview
- 16.2.3.2. Products
- 16.2.3.3. SWOT Analysis
- 16.2.3.4. Recent Developments
- 16.2.3.5. Financials (Based on Availability)
- 16.2.4 Majan Glass Company SAOG
- 16.2.4.1. Overview
- 16.2.4.2. Products
- 16.2.4.3. SWOT Analysis
- 16.2.4.4. Recent Developments
- 16.2.4.5. Financials (Based on Availability)
- 16.2.5 Nampak Ltd
- 16.2.5.1. Overview
- 16.2.5.2. Products
- 16.2.5.3. SWOT Analysis
- 16.2.5.4. Recent Developments
- 16.2.5.5. Financials (Based on Availability)
- 16.2.6 The National Company For Glass Industries (Zouja)
- 16.2.6.1. Overview
- 16.2.6.2. Products
- 16.2.6.3. SWOT Analysis
- 16.2.6.4. Recent Developments
- 16.2.6.5. Financials (Based on Availability)
- 16.2.7 Crown Holdings Inc
- 16.2.7.1. Overview
- 16.2.7.2. Products
- 16.2.7.3. SWOT Analysis
- 16.2.7.4. Recent Developments
- 16.2.7.5. Financials (Based on Availability)
- 16.2.8 Can-Pack S
- 16.2.8.1. Overview
- 16.2.8.2. Products
- 16.2.8.3. SWOT Analysis
- 16.2.8.4. Recent Developments
- 16.2.8.5. Financials (Based on Availability)
- 16.2.9 Saudi Arabian Glass Co Ltd
- 16.2.9.1. Overview
- 16.2.9.2. Products
- 16.2.9.3. SWOT Analysis
- 16.2.9.4. Recent Developments
- 16.2.9.5. Financials (Based on Availability)
- 16.2.10 Huhtamäki Oyj
- 16.2.10.1. Overview
- 16.2.10.2. Products
- 16.2.10.3. SWOT Analysis
- 16.2.10.4. Recent Developments
- 16.2.10.5. Financials (Based on Availability)
- 16.2.11 Bonpak (Pty) Ltd
- 16.2.11.1. Overview
- 16.2.11.2. Products
- 16.2.11.3. SWOT Analysis
- 16.2.11.4. Recent Developments
- 16.2.11.5. Financials (Based on Availability)
- 16.2.12 Consol Glass Ltd
- 16.2.12.1. Overview
- 16.2.12.2. Products
- 16.2.12.3. SWOT Analysis
- 16.2.12.4. Recent Developments
- 16.2.12.5. Financials (Based on Availability)
- 16.2.1 Saverglass SAS
List of Figures
- Figure 1: Global MEA Alcoholic Drinks Packaging Market Revenue Breakdown (Million, %) by Region 2024 & 2032
- Figure 2: North America MEA Alcoholic Drinks Packaging Market Revenue (Million), by Country 2024 & 2032
- Figure 3: North America MEA Alcoholic Drinks Packaging Market Revenue Share (%), by Country 2024 & 2032
- Figure 4: Europe MEA Alcoholic Drinks Packaging Market Revenue (Million), by Country 2024 & 2032
- Figure 5: Europe MEA Alcoholic Drinks Packaging Market Revenue Share (%), by Country 2024 & 2032
- Figure 6: Asia Pacific MEA Alcoholic Drinks Packaging Market Revenue (Million), by Country 2024 & 2032
- Figure 7: Asia Pacific MEA Alcoholic Drinks Packaging Market Revenue Share (%), by Country 2024 & 2032
- Figure 8: Latin America MEA Alcoholic Drinks Packaging Market Revenue (Million), by Country 2024 & 2032
- Figure 9: Latin America MEA Alcoholic Drinks Packaging Market Revenue Share (%), by Country 2024 & 2032
- Figure 10: Middle East and Africa MEA Alcoholic Drinks Packaging Market Revenue (Million), by Country 2024 & 2032
- Figure 11: Middle East and Africa MEA Alcoholic Drinks Packaging Market Revenue Share (%), by Country 2024 & 2032
- Figure 12: North America MEA Alcoholic Drinks Packaging Market Revenue (Million), by Primary Material 2024 & 2032
- Figure 13: North America MEA Alcoholic Drinks Packaging Market Revenue Share (%), by Primary Material 2024 & 2032
- Figure 14: North America MEA Alcoholic Drinks Packaging Market Revenue (Million), by Alcoholic Products 2024 & 2032
- Figure 15: North America MEA Alcoholic Drinks Packaging Market Revenue Share (%), by Alcoholic Products 2024 & 2032
- Figure 16: North America MEA Alcoholic Drinks Packaging Market Revenue (Million), by Product Type 2024 & 2032
- Figure 17: North America MEA Alcoholic Drinks Packaging Market Revenue Share (%), by Product Type 2024 & 2032
- Figure 18: North America MEA Alcoholic Drinks Packaging Market Revenue (Million), by Country 2024 & 2032
- Figure 19: North America MEA Alcoholic Drinks Packaging Market Revenue Share (%), by Country 2024 & 2032
- Figure 20: South America MEA Alcoholic Drinks Packaging Market Revenue (Million), by Primary Material 2024 & 2032
- Figure 21: South America MEA Alcoholic Drinks Packaging Market Revenue Share (%), by Primary Material 2024 & 2032
- Figure 22: South America MEA Alcoholic Drinks Packaging Market Revenue (Million), by Alcoholic Products 2024 & 2032
- Figure 23: South America MEA Alcoholic Drinks Packaging Market Revenue Share (%), by Alcoholic Products 2024 & 2032
- Figure 24: South America MEA Alcoholic Drinks Packaging Market Revenue (Million), by Product Type 2024 & 2032
- Figure 25: South America MEA Alcoholic Drinks Packaging Market Revenue Share (%), by Product Type 2024 & 2032
- Figure 26: South America MEA Alcoholic Drinks Packaging Market Revenue (Million), by Country 2024 & 2032
- Figure 27: South America MEA Alcoholic Drinks Packaging Market Revenue Share (%), by Country 2024 & 2032
- Figure 28: Europe MEA Alcoholic Drinks Packaging Market Revenue (Million), by Primary Material 2024 & 2032
- Figure 29: Europe MEA Alcoholic Drinks Packaging Market Revenue Share (%), by Primary Material 2024 & 2032
- Figure 30: Europe MEA Alcoholic Drinks Packaging Market Revenue (Million), by Alcoholic Products 2024 & 2032
- Figure 31: Europe MEA Alcoholic Drinks Packaging Market Revenue Share (%), by Alcoholic Products 2024 & 2032
- Figure 32: Europe MEA Alcoholic Drinks Packaging Market Revenue (Million), by Product Type 2024 & 2032
- Figure 33: Europe MEA Alcoholic Drinks Packaging Market Revenue Share (%), by Product Type 2024 & 2032
- Figure 34: Europe MEA Alcoholic Drinks Packaging Market Revenue (Million), by Country 2024 & 2032
- Figure 35: Europe MEA Alcoholic Drinks Packaging Market Revenue Share (%), by Country 2024 & 2032
- Figure 36: Middle East & Africa MEA Alcoholic Drinks Packaging Market Revenue (Million), by Primary Material 2024 & 2032
- Figure 37: Middle East & Africa MEA Alcoholic Drinks Packaging Market Revenue Share (%), by Primary Material 2024 & 2032
- Figure 38: Middle East & Africa MEA Alcoholic Drinks Packaging Market Revenue (Million), by Alcoholic Products 2024 & 2032
- Figure 39: Middle East & Africa MEA Alcoholic Drinks Packaging Market Revenue Share (%), by Alcoholic Products 2024 & 2032
- Figure 40: Middle East & Africa MEA Alcoholic Drinks Packaging Market Revenue (Million), by Product Type 2024 & 2032
- Figure 41: Middle East & Africa MEA Alcoholic Drinks Packaging Market Revenue Share (%), by Product Type 2024 & 2032
- Figure 42: Middle East & Africa MEA Alcoholic Drinks Packaging Market Revenue (Million), by Country 2024 & 2032
- Figure 43: Middle East & Africa MEA Alcoholic Drinks Packaging Market Revenue Share (%), by Country 2024 & 2032
- Figure 44: Asia Pacific MEA Alcoholic Drinks Packaging Market Revenue (Million), by Primary Material 2024 & 2032
- Figure 45: Asia Pacific MEA Alcoholic Drinks Packaging Market Revenue Share (%), by Primary Material 2024 & 2032
- Figure 46: Asia Pacific MEA Alcoholic Drinks Packaging Market Revenue (Million), by Alcoholic Products 2024 & 2032
- Figure 47: Asia Pacific MEA Alcoholic Drinks Packaging Market Revenue Share (%), by Alcoholic Products 2024 & 2032
- Figure 48: Asia Pacific MEA Alcoholic Drinks Packaging Market Revenue (Million), by Product Type 2024 & 2032
- Figure 49: Asia Pacific MEA Alcoholic Drinks Packaging Market Revenue Share (%), by Product Type 2024 & 2032
- Figure 50: Asia Pacific MEA Alcoholic Drinks Packaging Market Revenue (Million), by Country 2024 & 2032
- Figure 51: Asia Pacific MEA Alcoholic Drinks Packaging Market Revenue Share (%), by Country 2024 & 2032
List of Tables
- Table 1: Global MEA Alcoholic Drinks Packaging Market Revenue Million Forecast, by Region 2019 & 2032
- Table 2: Global MEA Alcoholic Drinks Packaging Market Revenue Million Forecast, by Primary Material 2019 & 2032
- Table 3: Global MEA Alcoholic Drinks Packaging Market Revenue Million Forecast, by Alcoholic Products 2019 & 2032
- Table 4: Global MEA Alcoholic Drinks Packaging Market Revenue Million Forecast, by Product Type 2019 & 2032
- Table 5: Global MEA Alcoholic Drinks Packaging Market Revenue Million Forecast, by Region 2019 & 2032
- Table 6: Global MEA Alcoholic Drinks Packaging Market Revenue Million Forecast, by Country 2019 & 2032
- Table 7: United States MEA Alcoholic Drinks Packaging Market Revenue (Million) Forecast, by Application 2019 & 2032
- Table 8: Canada MEA Alcoholic Drinks Packaging Market Revenue (Million) Forecast, by Application 2019 & 2032
- Table 9: Global MEA Alcoholic Drinks Packaging Market Revenue Million Forecast, by Country 2019 & 2032
- Table 10: United Kingdom MEA Alcoholic Drinks Packaging Market Revenue (Million) Forecast, by Application 2019 & 2032
- Table 11: Germany MEA Alcoholic Drinks Packaging Market Revenue (Million) Forecast, by Application 2019 & 2032
- Table 12: France MEA Alcoholic Drinks Packaging Market Revenue (Million) Forecast, by Application 2019 & 2032
- Table 13: Spain MEA Alcoholic Drinks Packaging Market Revenue (Million) Forecast, by Application 2019 & 2032
- Table 14: Rest of Europe MEA Alcoholic Drinks Packaging Market Revenue (Million) Forecast, by Application 2019 & 2032
- Table 15: Global MEA Alcoholic Drinks Packaging Market Revenue Million Forecast, by Country 2019 & 2032
- Table 16: China MEA Alcoholic Drinks Packaging Market Revenue (Million) Forecast, by Application 2019 & 2032
- Table 17: India MEA Alcoholic Drinks Packaging Market Revenue (Million) Forecast, by Application 2019 & 2032
- Table 18: Japan MEA Alcoholic Drinks Packaging Market Revenue (Million) Forecast, by Application 2019 & 2032
- Table 19: South Korea MEA Alcoholic Drinks Packaging Market Revenue (Million) Forecast, by Application 2019 & 2032
- Table 20: Thailand MEA Alcoholic Drinks Packaging Market Revenue (Million) Forecast, by Application 2019 & 2032
- Table 21: Rest of Asia Pacific MEA Alcoholic Drinks Packaging Market Revenue (Million) Forecast, by Application 2019 & 2032
- Table 22: Global MEA Alcoholic Drinks Packaging Market Revenue Million Forecast, by Country 2019 & 2032
- Table 23: Brazil MEA Alcoholic Drinks Packaging Market Revenue (Million) Forecast, by Application 2019 & 2032
- Table 24: Mexico MEA Alcoholic Drinks Packaging Market Revenue (Million) Forecast, by Application 2019 & 2032
- Table 25: Rest of Latin America MEA Alcoholic Drinks Packaging Market Revenue (Million) Forecast, by Application 2019 & 2032
- Table 26: Global MEA Alcoholic Drinks Packaging Market Revenue Million Forecast, by Country 2019 & 2032
- Table 27: United Arab Emirates MEA Alcoholic Drinks Packaging Market Revenue (Million) Forecast, by Application 2019 & 2032
- Table 28: Saudi Arabia MEA Alcoholic Drinks Packaging Market Revenue (Million) Forecast, by Application 2019 & 2032
- Table 29: South Africa MEA Alcoholic Drinks Packaging Market Revenue (Million) Forecast, by Application 2019 & 2032
- Table 30: Rest of Middle East MEA Alcoholic Drinks Packaging Market Revenue (Million) Forecast, by Application 2019 & 2032
- Table 31: Global MEA Alcoholic Drinks Packaging Market Revenue Million Forecast, by Primary Material 2019 & 2032
- Table 32: Global MEA Alcoholic Drinks Packaging Market Revenue Million Forecast, by Alcoholic Products 2019 & 2032
- Table 33: Global MEA Alcoholic Drinks Packaging Market Revenue Million Forecast, by Product Type 2019 & 2032
- Table 34: Global MEA Alcoholic Drinks Packaging Market Revenue Million Forecast, by Country 2019 & 2032
- Table 35: United States MEA Alcoholic Drinks Packaging Market Revenue (Million) Forecast, by Application 2019 & 2032
- Table 36: Canada MEA Alcoholic Drinks Packaging Market Revenue (Million) Forecast, by Application 2019 & 2032
- Table 37: Mexico MEA Alcoholic Drinks Packaging Market Revenue (Million) Forecast, by Application 2019 & 2032
- Table 38: Global MEA Alcoholic Drinks Packaging Market Revenue Million Forecast, by Primary Material 2019 & 2032
- Table 39: Global MEA Alcoholic Drinks Packaging Market Revenue Million Forecast, by Alcoholic Products 2019 & 2032
- Table 40: Global MEA Alcoholic Drinks Packaging Market Revenue Million Forecast, by Product Type 2019 & 2032
- Table 41: Global MEA Alcoholic Drinks Packaging Market Revenue Million Forecast, by Country 2019 & 2032
- Table 42: Brazil MEA Alcoholic Drinks Packaging Market Revenue (Million) Forecast, by Application 2019 & 2032
- Table 43: Argentina MEA Alcoholic Drinks Packaging Market Revenue (Million) Forecast, by Application 2019 & 2032
- Table 44: Rest of South America MEA Alcoholic Drinks Packaging Market Revenue (Million) Forecast, by Application 2019 & 2032
- Table 45: Global MEA Alcoholic Drinks Packaging Market Revenue Million Forecast, by Primary Material 2019 & 2032
- Table 46: Global MEA Alcoholic Drinks Packaging Market Revenue Million Forecast, by Alcoholic Products 2019 & 2032
- Table 47: Global MEA Alcoholic Drinks Packaging Market Revenue Million Forecast, by Product Type 2019 & 2032
- Table 48: Global MEA Alcoholic Drinks Packaging Market Revenue Million Forecast, by Country 2019 & 2032
- Table 49: United Kingdom MEA Alcoholic Drinks Packaging Market Revenue (Million) Forecast, by Application 2019 & 2032
- Table 50: Germany MEA Alcoholic Drinks Packaging Market Revenue (Million) Forecast, by Application 2019 & 2032
- Table 51: France MEA Alcoholic Drinks Packaging Market Revenue (Million) Forecast, by Application 2019 & 2032
- Table 52: Italy MEA Alcoholic Drinks Packaging Market Revenue (Million) Forecast, by Application 2019 & 2032
- Table 53: Spain MEA Alcoholic Drinks Packaging Market Revenue (Million) Forecast, by Application 2019 & 2032
- Table 54: Russia MEA Alcoholic Drinks Packaging Market Revenue (Million) Forecast, by Application 2019 & 2032
- Table 55: Benelux MEA Alcoholic Drinks Packaging Market Revenue (Million) Forecast, by Application 2019 & 2032
- Table 56: Nordics MEA Alcoholic Drinks Packaging Market Revenue (Million) Forecast, by Application 2019 & 2032
- Table 57: Rest of Europe MEA Alcoholic Drinks Packaging Market Revenue (Million) Forecast, by Application 2019 & 2032
- Table 58: Global MEA Alcoholic Drinks Packaging Market Revenue Million Forecast, by Primary Material 2019 & 2032
- Table 59: Global MEA Alcoholic Drinks Packaging Market Revenue Million Forecast, by Alcoholic Products 2019 & 2032
- Table 60: Global MEA Alcoholic Drinks Packaging Market Revenue Million Forecast, by Product Type 2019 & 2032
- Table 61: Global MEA Alcoholic Drinks Packaging Market Revenue Million Forecast, by Country 2019 & 2032
- Table 62: Turkey MEA Alcoholic Drinks Packaging Market Revenue (Million) Forecast, by Application 2019 & 2032
- Table 63: Israel MEA Alcoholic Drinks Packaging Market Revenue (Million) Forecast, by Application 2019 & 2032
- Table 64: GCC MEA Alcoholic Drinks Packaging Market Revenue (Million) Forecast, by Application 2019 & 2032
- Table 65: North Africa MEA Alcoholic Drinks Packaging Market Revenue (Million) Forecast, by Application 2019 & 2032
- Table 66: South Africa MEA Alcoholic Drinks Packaging Market Revenue (Million) Forecast, by Application 2019 & 2032
- Table 67: Rest of Middle East & Africa MEA Alcoholic Drinks Packaging Market Revenue (Million) Forecast, by Application 2019 & 2032
- Table 68: Global MEA Alcoholic Drinks Packaging Market Revenue Million Forecast, by Primary Material 2019 & 2032
- Table 69: Global MEA Alcoholic Drinks Packaging Market Revenue Million Forecast, by Alcoholic Products 2019 & 2032
- Table 70: Global MEA Alcoholic Drinks Packaging Market Revenue Million Forecast, by Product Type 2019 & 2032
- Table 71: Global MEA Alcoholic Drinks Packaging Market Revenue Million Forecast, by Country 2019 & 2032
- Table 72: China MEA Alcoholic Drinks Packaging Market Revenue (Million) Forecast, by Application 2019 & 2032
- Table 73: India MEA Alcoholic Drinks Packaging Market Revenue (Million) Forecast, by Application 2019 & 2032
- Table 74: Japan MEA Alcoholic Drinks Packaging Market Revenue (Million) Forecast, by Application 2019 & 2032
- Table 75: South Korea MEA Alcoholic Drinks Packaging Market Revenue (Million) Forecast, by Application 2019 & 2032
- Table 76: ASEAN MEA Alcoholic Drinks Packaging Market Revenue (Million) Forecast, by Application 2019 & 2032
- Table 77: Oceania MEA Alcoholic Drinks Packaging Market Revenue (Million) Forecast, by Application 2019 & 2032
- Table 78: Rest of Asia Pacific MEA Alcoholic Drinks Packaging Market Revenue (Million) Forecast, by Application 2019 & 2032
Frequently Asked Questions
1. What is the projected Compound Annual Growth Rate (CAGR) of the MEA Alcoholic Drinks Packaging Market?
The projected CAGR is approximately 3.80%.
2. Which companies are prominent players in the MEA Alcoholic Drinks Packaging Market?
Key companies in the market include Saverglass SAS, Middle East Glass Manufacturing Company SAE, Ball Corporation, Majan Glass Company SAOG, Nampak Ltd, The National Company For Glass Industries (Zouja), Crown Holdings Inc, Can-Pack S, Saudi Arabian Glass Co Ltd, Huhtamäki Oyj, Bonpak (Pty) Ltd, Consol Glass Ltd.
3. What are the main segments of the MEA Alcoholic Drinks Packaging Market?
The market segments include Primary Material, Alcoholic Products, Product Type.
4. Can you provide details about the market size?
The market size is estimated to be USD XX Million as of 2022.
5. What are some drivers contributing to market growth?
Growth in Purchasing Power of Consumers; Growing Awareness Among Alcoholic Beverage Manufacturers to Differentiate Their Products Over Packaging.
6. What are the notable trends driving market growth?
Metal Can Packaging is Expected to Grow Significantly.
7. Are there any restraints impacting market growth?
Presence of Alternate Packaging Solutions.
8. Can you provide examples of recent developments in the market?
August 2021 - Huhtamäki Oyj acquired Elif Holding AŞ, a major supplier of sustainable, flexible packaging to global FMCG brand owners, with operations in Turkey and Egypt. In line with Huhtamaki's 2030 growth strategy, the acquisition adds scale in strategic geographies and supports Huhtamaki's progress toward reaching its high sustainability ambitions. The acquisition also expands Huhtamaki's technology capabilities and product range, allowing it to serve its customers even better.
9. What pricing options are available for accessing the report?
Pricing options include single-user, multi-user, and enterprise licenses priced at USD 4750, USD 4950, and USD 6800 respectively.
10. Is the market size provided in terms of value or volume?
The market size is provided in terms of value, measured in Million.
11. Are there any specific market keywords associated with the report?
Yes, the market keyword associated with the report is "MEA Alcoholic Drinks Packaging Market," which aids in identifying and referencing the specific market segment covered.
12. How do I determine which pricing option suits my needs best?
The pricing options vary based on user requirements and access needs. Individual users may opt for single-user licenses, while businesses requiring broader access may choose multi-user or enterprise licenses for cost-effective access to the report.
13. Are there any additional resources or data provided in the MEA Alcoholic Drinks Packaging Market report?
While the report offers comprehensive insights, it's advisable to review the specific contents or supplementary materials provided to ascertain if additional resources or data are available.
14. How can I stay updated on further developments or reports in the MEA Alcoholic Drinks Packaging Market?
To stay informed about further developments, trends, and reports in the MEA Alcoholic Drinks Packaging Market, consider subscribing to industry newsletters, following relevant companies and organizations, or regularly checking reputable industry news sources and publications.
Methodology
Step 1 - Identification of Relevant Samples Size from Population Database


Step 2 - Approaches for Defining Global Market Size (Value, Volume* & Price*)

Note*: In applicable scenarios
Step 3 - Data Sources
Primary Research
- Web Analytics
- Survey Reports
- Research Institute
- Latest Research Reports
- Opinion Leaders
Secondary Research
- Annual Reports
- White Paper
- Latest Press Release
- Industry Association
- Paid Database
- Investor Presentations

Step 4 - Data Triangulation
Involves using different sources of information in order to increase the validity of a study
These sources are likely to be stakeholders in a program - participants, other researchers, program staff, other community members, and so on.
Then we put all data in single framework & apply various statistical tools to find out the dynamic on the market.
During the analysis stage, feedback from the stakeholder groups would be compared to determine areas of agreement as well as areas of divergence


