

Key Insights
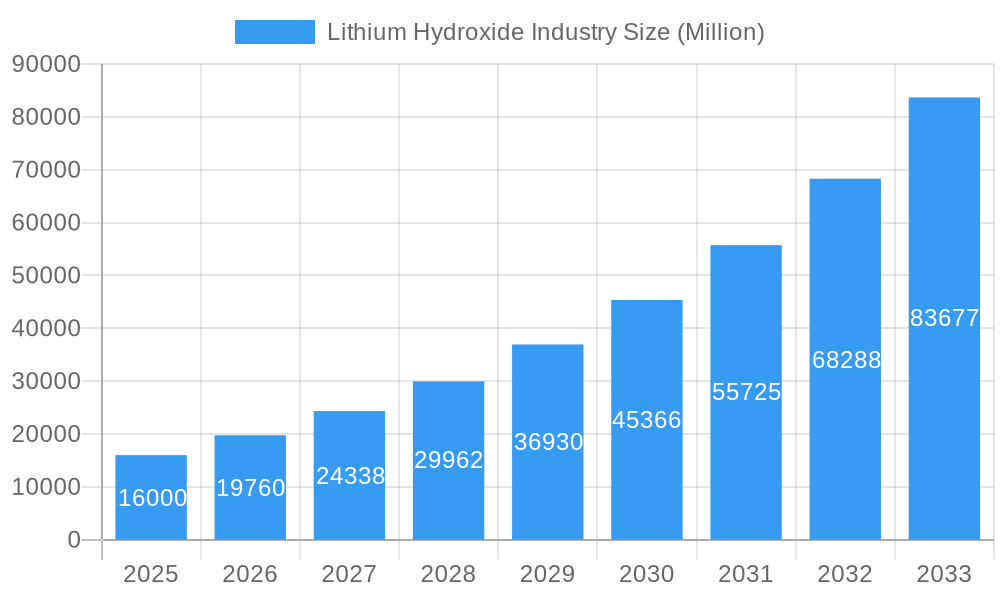
The lithium hydroxide market is poised for significant expansion, propelled by the rapid growth of the electric vehicle (EV) sector and the escalating demand for advanced energy storage solutions. With a projected Compound Annual Growth Rate (CAGR) of 14.05%, the market is anticipated to reach a size of 4.71 billion by 2025. This robust growth trajectory is underpinned by increasing global adoption of EVs, supported by government incentives and evolving consumer preferences. Furthermore, the proliferation of renewable energy sources necessitates efficient and reliable energy storage, further fueling demand for lithium hydroxide.
Lithium Hydroxide Industry Market Size (In Billion)
Key growth catalysts include the ongoing decarbonization efforts worldwide, stringent emission regulations, and substantial investments in battery technology research and development. The increasing demand for high-nickel cathode materials in lithium-ion batteries, which require battery-grade lithium hydroxide, is a primary driver. Applications beyond batteries, such as in specialized lubricants and advanced ceramics, also contribute to market diversification.
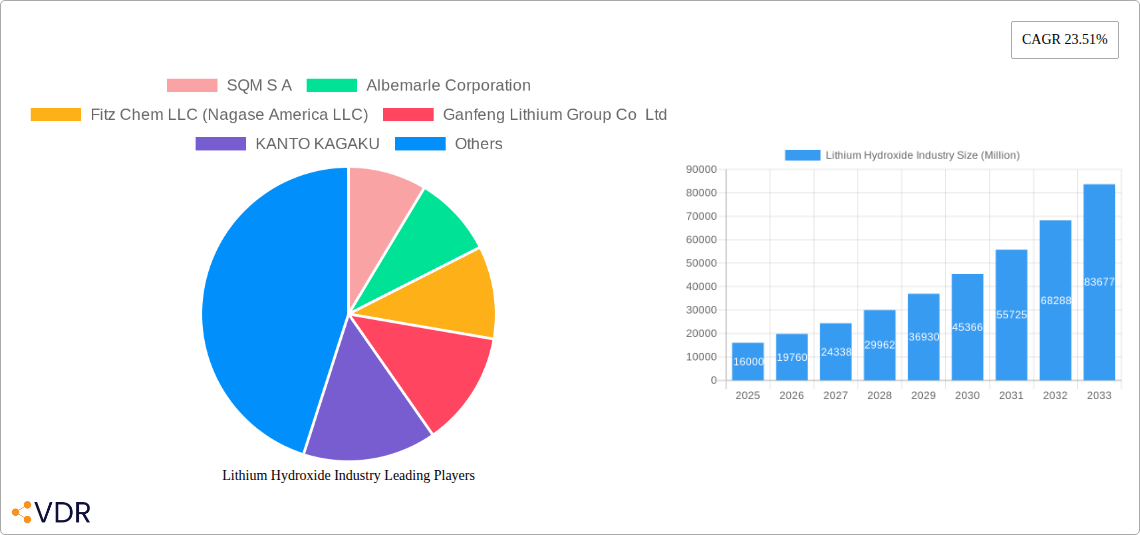
Lithium Hydroxide Industry Company Market Share
Despite the positive outlook, the market encounters challenges including price volatility of raw materials, supply chain disruptions influenced by geopolitical factors, and environmental considerations related to lithium extraction and processing. Intense competition among major market players, including SQM S.A., Albemarle Corporation, and Ganfeng Lithium Group, fosters innovation and drives efforts towards cost optimization and sustainable production methods. Market segmentation is expected across product grades (battery grade, industrial grade), applications (batteries, grease, plastics, etc.), and key geographical regions, with North America and Asia-Pacific anticipated to lead market share due to strong EV penetration and manufacturing capabilities.
Lithium Hydroxide Industry Market Report: 2019-2033
This comprehensive report provides a detailed analysis of the Lithium Hydroxide industry, encompassing market dynamics, growth trends, regional landscapes, key players, and future outlook. With a focus on the parent market of battery materials and the child market of electric vehicle (EV) batteries, this report is an essential resource for industry professionals, investors, and strategic decision-makers. The study period covers 2019-2033, with a base year of 2025 and a forecast period of 2025-2033. The report utilizes data from the historical period (2019-2024) and includes estimated data for 2025. All values are presented in million units unless otherwise stated.
Lithium Hydroxide Industry Market Dynamics & Structure
The lithium hydroxide market is characterized by moderate concentration, with several major players controlling a significant portion of global production. Technological innovation, driven by the demand for higher-performance batteries, is a key driver, while regulatory frameworks concerning resource extraction and environmental impact play a significant role. Competitive substitutes are limited, primarily focusing on other lithium compounds. The end-user demographic is heavily influenced by the burgeoning EV market and the expanding energy storage sector. M&A activity has been significant, reflecting consolidation efforts and securing access to critical resources.
- Market Concentration: xx% controlled by top 5 players (2024).
- Technological Innovation: Focus on high purity lithium hydroxide for improved battery performance.
- Regulatory Landscape: Increasingly stringent environmental regulations impacting mining and processing.
- Competitive Substitutes: Limited, with other lithium salts offering niche applications.
- End-User Demographics: Dominated by the EV and energy storage sectors.
- M&A Trends: xx major deals in the last 5 years, totaling an estimated xx million USD.
Lithium Hydroxide Industry Growth Trends & Insights
The lithium hydroxide market has experienced robust growth, driven primarily by the exponential rise in demand for lithium-ion batteries used in electric vehicles and energy storage systems. This surge in demand has led to significant capacity expansions and investments in new production facilities. Technological advancements, including improvements in extraction and processing techniques, are enhancing efficiency and reducing costs. Changing consumer behavior, favoring environmentally friendly transportation and renewable energy solutions, further fuels market growth. The CAGR for the forecast period (2025-2033) is estimated at xx%. Market penetration in the EV sector is projected to reach xx% by 2033.
Dominant Regions, Countries, or Segments in Lithium Hydroxide Industry
The Asia-Pacific region, particularly China, currently holds a dominant position in the lithium hydroxide market, benefiting from significant downstream demand for EV batteries and established lithium processing infrastructure. However, other regions, including North America and South America, are witnessing rapid growth due to increasing investments in lithium mining and processing facilities, along with supportive government policies.
- Key Drivers (China): Established lithium processing infrastructure, strong domestic EV market, government support for renewable energy.
- Key Drivers (North America): Growing EV manufacturing, investments in new lithium projects, focus on domestic supply chain security.
- Key Drivers (South America): Abundant lithium resources, rising foreign investment, favorable mining regulations.
- Market Share (2024): China (xx%), North America (xx%), South America (xx%).
- Growth Potential (2025-2033): North America (xx%), South America (xx%).
Lithium Hydroxide Industry Product Landscape
Lithium hydroxide is primarily offered in battery-grade and industrial-grade forms. Recent innovations focus on enhancing purity, improving consistency, and reducing production costs. Key applications include lithium-ion batteries for electric vehicles, energy storage systems, and other consumer electronics. Unique selling propositions often center on purity levels, consistent quality, and sustainable sourcing practices.
Key Drivers, Barriers & Challenges in Lithium Hydroxide Industry
Key Drivers: The burgeoning EV market, the expanding energy storage sector, supportive government policies promoting renewable energy, and ongoing technological advancements in battery technology are all driving significant growth.
Key Challenges: Supply chain disruptions, particularly regarding raw material availability and geopolitical factors, pose significant risks. Environmental concerns regarding lithium mining and processing, coupled with rising regulatory scrutiny, also present challenges. Furthermore, intense competition among producers can put downward pressure on prices. Estimated supply chain disruption cost in 2024: xx million.
Emerging Opportunities in Lithium Hydroxide Industry
Emerging opportunities exist in developing sustainable and responsible lithium sourcing practices, exploring alternative lithium extraction technologies, and expanding into new applications, such as advanced battery chemistries and specialized industrial uses. Untapped markets in developing economies also present significant potential for growth.
Growth Accelerators in the Lithium Hydroxide Industry
Technological breakthroughs, including innovations in extraction methods and battery chemistries, will significantly accelerate market growth. Strategic partnerships between lithium producers, battery manufacturers, and automakers will also play a vital role in securing supply chains and optimizing production. Expansion into new geographic markets and diversification into other lithium-based products will further drive long-term growth.
Key Players Shaping the Lithium Hydroxide Industry Market
- SQM S A
- Albemarle Corporation
- Fitz Chem LLC (Nagase America LLC)
- Ganfeng Lithium Group Co Ltd
- KANTO KAGAKU
- LevertonHELM Limited
- Livent
- Nemaska Lithium
- Shangai China Lithium Industrial Co Ltd
- SICHUAN BRIVO LITHIUM MATERIALS CO LTD
- Tianqi Lithium *List Not Exhaustive
Notable Milestones in Lithium Hydroxide Industry Sector
- June 2023: Nemaska Lithium commenced construction of its new lithium hydroxide production facility in Bécancour, Quebec.
- May 2023: Nemaska Lithium secured a supply agreement with Ford for up to 13,000 tons of lithium hydroxide annually.
- March 2023: Albemarle Corporation expanded its lithium processing facility in South Carolina, boosting its capacity to produce approximately 50,000 tons of battery-grade lithium hydroxide annually.
In-Depth Lithium Hydroxide Industry Market Outlook
The lithium hydroxide market is poised for continued strong growth, driven by the sustained expansion of the electric vehicle and energy storage sectors. Strategic investments in new production capacity, technological advancements, and collaborative partnerships will be crucial in meeting the rising demand. Opportunities exist for companies to capitalize on this growth by focusing on sustainable practices, technological innovation, and securing access to critical resources. The market is expected to reach xx million units by 2033.
Lithium Hydroxide Industry Segmentation
-
1. Application
- 1.1. Lithium-ion Batteries
- 1.2. Lubricating Greases
- 1.3. Purification
- 1.4. Other Applications (Polymer Production)
Lithium Hydroxide Industry Segmentation By Geography
-
1. Asia Pacific
- 1.1. China
- 1.2. India
- 1.3. Japan
- 1.4. South Korea
- 1.5. Malaysia
- 1.6. Thailand
- 1.7. Indonesia
- 1.8. Vietnam
- 1.9. Rest of Asia Pacific
-
2. North America
- 2.1. United States
- 2.2. Canada
- 2.3. Mexico
-
3. Europe
- 3.1. Germany
- 3.2. United Kingdom
- 3.3. Italy
- 3.4. France
- 3.5. Spain
- 3.6. Turkey
- 3.7. Russia
- 3.8. NORDIC
- 3.9. Rest of Europe
-
4. South America
- 4.1. Brazil
- 4.2. Argentina
- 4.3. Colombia
- 4.4. Rest of South America
-
5. Middle East and Africa
- 5.1. Saudi Arabia
- 5.2. South Africa
- 5.3. Nigeria
- 5.4. Qatar
- 5.5. Egypt
- 5.6. UAE
- 5.7. Rest of Middle East and Africa
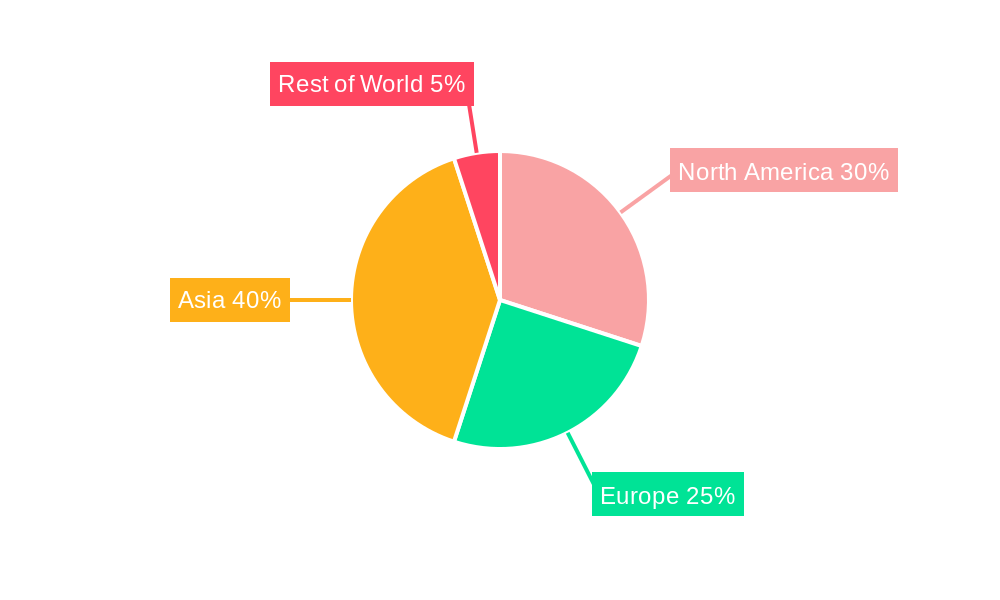
Lithium Hydroxide Industry Regional Market Share
Geographic Coverage of Lithium Hydroxide Industry
Lithium Hydroxide Industry REPORT HIGHLIGHTS
| Aspects | Details |
|---|---|
| Study Period | 2020-2034 |
| Base Year | 2025 |
| Estimated Year | 2026 |
| Forecast Period | 2026-2034 |
| Historical Period | 2020-2025 |
| Growth Rate | CAGR of 14.05% from 2020-2034 |
| Segmentation |
|
Table of Contents
- 1. Introduction
- 1.1. Research Scope
- 1.2. Market Segmentation
- 1.3. Research Objective
- 1.4. Definitions and Assumptions
- 2. Executive Summary
- 2.1. Market Snapshot
- 3. Market Dynamics
- 3.1. Market Drivers
- 3.2. Market Restrains
- 3.3. Market Trends
- 3.4. Market Opportunities
- 4. Market Factor Analysis
- 4.1. Porters Five Forces
- 4.1.1. Bargaining Power of Suppliers
- 4.1.2. Bargaining Power of Buyers
- 4.1.3. Threat of New Entrants
- 4.1.4. Threat of Substitutes
- 4.1.5. Competitive Rivalry
- 4.2. PESTEL analysis
- 4.3. BCG Analysis
- 4.3.1. Stars (High Growth, High Market Share)
- 4.3.2. Cash Cows (Low Growth, High Market Share)
- 4.3.3. Question Mark (High Growth, Low Market Share)
- 4.3.4. Dogs (Low Growth, Low Market Share)
- 4.4. Ansoff Matrix Analysis
- 4.5. Supply Chain Analysis
- 4.6. Regulatory Landscape
- 4.7. Current Market Potential and Opportunity Assessment (TAM–SAM–SOM Framework)
- 4.8. VDR Analyst Note
- 4.1. Porters Five Forces
- 5. Market Analysis, Insights and Forecast 2021-2033
- 5.1. Market Analysis, Insights and Forecast - by Application
- 5.1.1. Lithium-ion Batteries
- 5.1.2. Lubricating Greases
- 5.1.3. Purification
- 5.1.4. Other Applications (Polymer Production)
- 5.2. Market Analysis, Insights and Forecast - by Region
- 5.2.1. Asia Pacific
- 5.2.2. North America
- 5.2.3. Europe
- 5.2.4. South America
- 5.2.5. Middle East and Africa
- 5.1. Market Analysis, Insights and Forecast - by Application
- 6. Global Lithium Hydroxide Industry Analysis, Insights and Forecast, 2021-2033
- 6.1. Market Analysis, Insights and Forecast - by Application
- 6.1.1. Lithium-ion Batteries
- 6.1.2. Lubricating Greases
- 6.1.3. Purification
- 6.1.4. Other Applications (Polymer Production)
- 6.1. Market Analysis, Insights and Forecast - by Application
- 7. Asia Pacific Lithium Hydroxide Industry Analysis, Insights and Forecast, 2021-2033
- 7.1. Market Analysis, Insights and Forecast - by Application
- 7.1.1. Lithium-ion Batteries
- 7.1.2. Lubricating Greases
- 7.1.3. Purification
- 7.1.4. Other Applications (Polymer Production)
- 7.1. Market Analysis, Insights and Forecast - by Application
- 8. North America Lithium Hydroxide Industry Analysis, Insights and Forecast, 2021-2033
- 8.1. Market Analysis, Insights and Forecast - by Application
- 8.1.1. Lithium-ion Batteries
- 8.1.2. Lubricating Greases
- 8.1.3. Purification
- 8.1.4. Other Applications (Polymer Production)
- 8.1. Market Analysis, Insights and Forecast - by Application
- 9. Europe Lithium Hydroxide Industry Analysis, Insights and Forecast, 2021-2033
- 9.1. Market Analysis, Insights and Forecast - by Application
- 9.1.1. Lithium-ion Batteries
- 9.1.2. Lubricating Greases
- 9.1.3. Purification
- 9.1.4. Other Applications (Polymer Production)
- 9.1. Market Analysis, Insights and Forecast - by Application
- 10. South America Lithium Hydroxide Industry Analysis, Insights and Forecast, 2021-2033
- 10.1. Market Analysis, Insights and Forecast - by Application
- 10.1.1. Lithium-ion Batteries
- 10.1.2. Lubricating Greases
- 10.1.3. Purification
- 10.1.4. Other Applications (Polymer Production)
- 10.1. Market Analysis, Insights and Forecast - by Application
- 11. Middle East and Africa Lithium Hydroxide Industry Analysis, Insights and Forecast, 2021-2033
- 11.1. Market Analysis, Insights and Forecast - by Application
- 11.1.1. Lithium-ion Batteries
- 11.1.2. Lubricating Greases
- 11.1.3. Purification
- 11.1.4. Other Applications (Polymer Production)
- 11.1. Market Analysis, Insights and Forecast - by Application
- 12. Competitive Analysis
- 12.1. Company Profiles
- 12.1.1 SQM S A
- 12.1.1.1. Company Overview
- 12.1.1.2. Products
- 12.1.1.3. Company Financials
- 12.1.1.4. SWOT Analysis
- 12.1.2 Albemarle Corporation
- 12.1.2.1. Company Overview
- 12.1.2.2. Products
- 12.1.2.3. Company Financials
- 12.1.2.4. SWOT Analysis
- 12.1.3 Fitz Chem LLC (Nagase America LLC)
- 12.1.3.1. Company Overview
- 12.1.3.2. Products
- 12.1.3.3. Company Financials
- 12.1.3.4. SWOT Analysis
- 12.1.4 Ganfeng Lithium Group Co Ltd
- 12.1.4.1. Company Overview
- 12.1.4.2. Products
- 12.1.4.3. Company Financials
- 12.1.4.4. SWOT Analysis
- 12.1.5 KANTO KAGAKU
- 12.1.5.1. Company Overview
- 12.1.5.2. Products
- 12.1.5.3. Company Financials
- 12.1.5.4. SWOT Analysis
- 12.1.6 LevertonHELM Limited
- 12.1.6.1. Company Overview
- 12.1.6.2. Products
- 12.1.6.3. Company Financials
- 12.1.6.4. SWOT Analysis
- 12.1.7 Livent
- 12.1.7.1. Company Overview
- 12.1.7.2. Products
- 12.1.7.3. Company Financials
- 12.1.7.4. SWOT Analysis
- 12.1.8 Nemaska Lithium
- 12.1.8.1. Company Overview
- 12.1.8.2. Products
- 12.1.8.3. Company Financials
- 12.1.8.4. SWOT Analysis
- 12.1.9 Shangai China Lithium Industrial Co Ltd
- 12.1.9.1. Company Overview
- 12.1.9.2. Products
- 12.1.9.3. Company Financials
- 12.1.9.4. SWOT Analysis
- 12.1.10 SICHUAN BRIVO LITHIUM MATERIALS CO LTD
- 12.1.10.1. Company Overview
- 12.1.10.2. Products
- 12.1.10.3. Company Financials
- 12.1.10.4. SWOT Analysis
- 12.1.11 Tianqi Lithium*List Not Exhaustive
- 12.1.11.1. Company Overview
- 12.1.11.2. Products
- 12.1.11.3. Company Financials
- 12.1.11.4. SWOT Analysis
- 12.1.1 SQM S A
- 12.2. Market Entropy
- 12.2.1 Company's Key Areas Served
- 12.2.2 Recent Developments
- 12.3. Company Market Share Analysis 2025
- 12.3.1 Top 5 Companies Market Share Analysis
- 12.3.2 Top 3 Companies Market Share Analysis
- 12.4. List of Potential Customers
- 13. Research Methodology
List of Figures
- Figure 1: Global Lithium Hydroxide Industry Revenue Breakdown (billion, %) by Region 2025 & 2033
- Figure 2: Asia Pacific Lithium Hydroxide Industry Revenue (billion), by Application 2025 & 2033
- Figure 3: Asia Pacific Lithium Hydroxide Industry Revenue Share (%), by Application 2025 & 2033
- Figure 4: Asia Pacific Lithium Hydroxide Industry Revenue (billion), by Country 2025 & 2033
- Figure 5: Asia Pacific Lithium Hydroxide Industry Revenue Share (%), by Country 2025 & 2033
- Figure 6: North America Lithium Hydroxide Industry Revenue (billion), by Application 2025 & 2033
- Figure 7: North America Lithium Hydroxide Industry Revenue Share (%), by Application 2025 & 2033
- Figure 8: North America Lithium Hydroxide Industry Revenue (billion), by Country 2025 & 2033
- Figure 9: North America Lithium Hydroxide Industry Revenue Share (%), by Country 2025 & 2033
- Figure 10: Europe Lithium Hydroxide Industry Revenue (billion), by Application 2025 & 2033
- Figure 11: Europe Lithium Hydroxide Industry Revenue Share (%), by Application 2025 & 2033
- Figure 12: Europe Lithium Hydroxide Industry Revenue (billion), by Country 2025 & 2033
- Figure 13: Europe Lithium Hydroxide Industry Revenue Share (%), by Country 2025 & 2033
- Figure 14: South America Lithium Hydroxide Industry Revenue (billion), by Application 2025 & 2033
- Figure 15: South America Lithium Hydroxide Industry Revenue Share (%), by Application 2025 & 2033
- Figure 16: South America Lithium Hydroxide Industry Revenue (billion), by Country 2025 & 2033
- Figure 17: South America Lithium Hydroxide Industry Revenue Share (%), by Country 2025 & 2033
- Figure 18: Middle East and Africa Lithium Hydroxide Industry Revenue (billion), by Application 2025 & 2033
- Figure 19: Middle East and Africa Lithium Hydroxide Industry Revenue Share (%), by Application 2025 & 2033
- Figure 20: Middle East and Africa Lithium Hydroxide Industry Revenue (billion), by Country 2025 & 2033
- Figure 21: Middle East and Africa Lithium Hydroxide Industry Revenue Share (%), by Country 2025 & 2033
List of Tables
- Table 1: Global Lithium Hydroxide Industry Revenue billion Forecast, by Application 2020 & 2033
- Table 2: Global Lithium Hydroxide Industry Revenue billion Forecast, by Region 2020 & 2033
- Table 3: Global Lithium Hydroxide Industry Revenue billion Forecast, by Application 2020 & 2033
- Table 4: Global Lithium Hydroxide Industry Revenue billion Forecast, by Country 2020 & 2033
- Table 5: China Lithium Hydroxide Industry Revenue (billion) Forecast, by Application 2020 & 2033
- Table 6: India Lithium Hydroxide Industry Revenue (billion) Forecast, by Application 2020 & 2033
- Table 7: Japan Lithium Hydroxide Industry Revenue (billion) Forecast, by Application 2020 & 2033
- Table 8: South Korea Lithium Hydroxide Industry Revenue (billion) Forecast, by Application 2020 & 2033
- Table 9: Malaysia Lithium Hydroxide Industry Revenue (billion) Forecast, by Application 2020 & 2033
- Table 10: Thailand Lithium Hydroxide Industry Revenue (billion) Forecast, by Application 2020 & 2033
- Table 11: Indonesia Lithium Hydroxide Industry Revenue (billion) Forecast, by Application 2020 & 2033
- Table 12: Vietnam Lithium Hydroxide Industry Revenue (billion) Forecast, by Application 2020 & 2033
- Table 13: Rest of Asia Pacific Lithium Hydroxide Industry Revenue (billion) Forecast, by Application 2020 & 2033
- Table 14: Global Lithium Hydroxide Industry Revenue billion Forecast, by Application 2020 & 2033
- Table 15: Global Lithium Hydroxide Industry Revenue billion Forecast, by Country 2020 & 2033
- Table 16: United States Lithium Hydroxide Industry Revenue (billion) Forecast, by Application 2020 & 2033
- Table 17: Canada Lithium Hydroxide Industry Revenue (billion) Forecast, by Application 2020 & 2033
- Table 18: Mexico Lithium Hydroxide Industry Revenue (billion) Forecast, by Application 2020 & 2033
- Table 19: Global Lithium Hydroxide Industry Revenue billion Forecast, by Application 2020 & 2033
- Table 20: Global Lithium Hydroxide Industry Revenue billion Forecast, by Country 2020 & 2033
- Table 21: Germany Lithium Hydroxide Industry Revenue (billion) Forecast, by Application 2020 & 2033
- Table 22: United Kingdom Lithium Hydroxide Industry Revenue (billion) Forecast, by Application 2020 & 2033
- Table 23: Italy Lithium Hydroxide Industry Revenue (billion) Forecast, by Application 2020 & 2033
- Table 24: France Lithium Hydroxide Industry Revenue (billion) Forecast, by Application 2020 & 2033
- Table 25: Spain Lithium Hydroxide Industry Revenue (billion) Forecast, by Application 2020 & 2033
- Table 26: Turkey Lithium Hydroxide Industry Revenue (billion) Forecast, by Application 2020 & 2033
- Table 27: Russia Lithium Hydroxide Industry Revenue (billion) Forecast, by Application 2020 & 2033
- Table 28: NORDIC Lithium Hydroxide Industry Revenue (billion) Forecast, by Application 2020 & 2033
- Table 29: Rest of Europe Lithium Hydroxide Industry Revenue (billion) Forecast, by Application 2020 & 2033
- Table 30: Global Lithium Hydroxide Industry Revenue billion Forecast, by Application 2020 & 2033
- Table 31: Global Lithium Hydroxide Industry Revenue billion Forecast, by Country 2020 & 2033
- Table 32: Brazil Lithium Hydroxide Industry Revenue (billion) Forecast, by Application 2020 & 2033
- Table 33: Argentina Lithium Hydroxide Industry Revenue (billion) Forecast, by Application 2020 & 2033
- Table 34: Colombia Lithium Hydroxide Industry Revenue (billion) Forecast, by Application 2020 & 2033
- Table 35: Rest of South America Lithium Hydroxide Industry Revenue (billion) Forecast, by Application 2020 & 2033
- Table 36: Global Lithium Hydroxide Industry Revenue billion Forecast, by Application 2020 & 2033
- Table 37: Global Lithium Hydroxide Industry Revenue billion Forecast, by Country 2020 & 2033
- Table 38: Saudi Arabia Lithium Hydroxide Industry Revenue (billion) Forecast, by Application 2020 & 2033
- Table 39: South Africa Lithium Hydroxide Industry Revenue (billion) Forecast, by Application 2020 & 2033
- Table 40: Nigeria Lithium Hydroxide Industry Revenue (billion) Forecast, by Application 2020 & 2033
- Table 41: Qatar Lithium Hydroxide Industry Revenue (billion) Forecast, by Application 2020 & 2033
- Table 42: Egypt Lithium Hydroxide Industry Revenue (billion) Forecast, by Application 2020 & 2033
- Table 43: UAE Lithium Hydroxide Industry Revenue (billion) Forecast, by Application 2020 & 2033
- Table 44: Rest of Middle East and Africa Lithium Hydroxide Industry Revenue (billion) Forecast, by Application 2020 & 2033
Frequently Asked Questions
1. What is the projected Compound Annual Growth Rate (CAGR) of the Lithium Hydroxide Industry?
The projected CAGR is approximately 14.05%.
2. Which companies are prominent players in the Lithium Hydroxide Industry?
Key companies in the market include SQM S A, Albemarle Corporation, Fitz Chem LLC (Nagase America LLC), Ganfeng Lithium Group Co Ltd, KANTO KAGAKU, LevertonHELM Limited, Livent, Nemaska Lithium, Shangai China Lithium Industrial Co Ltd, SICHUAN BRIVO LITHIUM MATERIALS CO LTD, Tianqi Lithium*List Not Exhaustive.
3. What are the main segments of the Lithium Hydroxide Industry?
The market segments include Application.
4. Can you provide details about the market size?
The market size is estimated to be USD 4.71 billion as of 2022.
5. What are some drivers contributing to market growth?
Increasing Demand for Electric Vehicles; Increasing Demand for Power Tools.
6. What are the notable trends driving market growth?
Batteries Segment to Dominate the Market.
7. Are there any restraints impacting market growth?
Increasing Demand for Electric Vehicles; Increasing Demand for Power Tools.
8. Can you provide examples of recent developments in the market?
June 2023: Nemaska Lithium announced the commencement of construction of its new production facility in Bécancour. This new facility would produce lithium hydroxide for batteries, which the Whabouchi mine would supply.
9. What pricing options are available for accessing the report?
Pricing options include single-user, multi-user, and enterprise licenses priced at USD 4750, USD 5250, and USD 8750 respectively.
10. Is the market size provided in terms of value or volume?
The market size is provided in terms of value, measured in billion.
11. Are there any specific market keywords associated with the report?
Yes, the market keyword associated with the report is "Lithium Hydroxide Industry," which aids in identifying and referencing the specific market segment covered.
12. How do I determine which pricing option suits my needs best?
The pricing options vary based on user requirements and access needs. Individual users may opt for single-user licenses, while businesses requiring broader access may choose multi-user or enterprise licenses for cost-effective access to the report.
13. Are there any additional resources or data provided in the Lithium Hydroxide Industry report?
While the report offers comprehensive insights, it's advisable to review the specific contents or supplementary materials provided to ascertain if additional resources or data are available.
14. How can I stay updated on further developments or reports in the Lithium Hydroxide Industry?
To stay informed about further developments, trends, and reports in the Lithium Hydroxide Industry, consider subscribing to industry newsletters, following relevant companies and organizations, or regularly checking reputable industry news sources and publications.
Methodology
Step 1 - Identification of Relevant Samples Size from Population Database


Step 2 - Approaches for Defining Global Market Size (Value, Volume* & Price*)

Note*: In applicable scenarios
Step 3 - Data Sources
Primary Research
- Web Analytics
- Survey Reports
- Research Institute
- Latest Research Reports
- Opinion Leaders
Secondary Research
- Annual Reports
- White Paper
- Latest Press Release
- Industry Association
- Paid Database
- Investor Presentations

Step 4 - Data Triangulation
Involves using different sources of information in order to increase the validity of a study
These sources are likely to be stakeholders in a program - participants, other researchers, program staff, other community members, and so on.
Then we put all data in single framework & apply various statistical tools to find out the dynamic on the market.
During the analysis stage, feedback from the stakeholder groups would be compared to determine areas of agreement as well as areas of divergence