

Key Insights
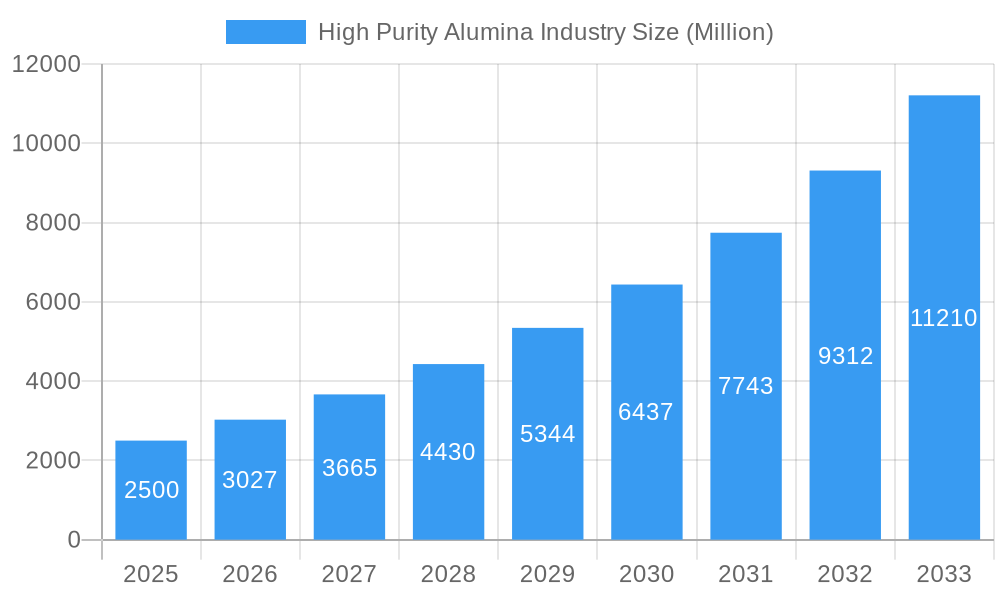
The High-Purity Alumina (HPA) market is poised for significant expansion, propelled by escalating demand across key sectors, notably electronics and LED lighting. Projecting a Compound Annual Growth Rate (CAGR) of 20.62% from the base year 2025, the market is expected to reach approximately 0.57 billion by the end of the forecast period. This robust growth is underpinned by the increasing utilization of sapphire substrates in LED manufacturing, the rising adoption of HPA in advanced ceramics and refractories, and its expanding applications within the semiconductor industry. Leading market participants are strategically investing in production capacity enhancements and technological innovation to cater to this surge. However, challenges such as raw material price volatility and the energy-intensive nature of HPA production necessitate careful market navigation.
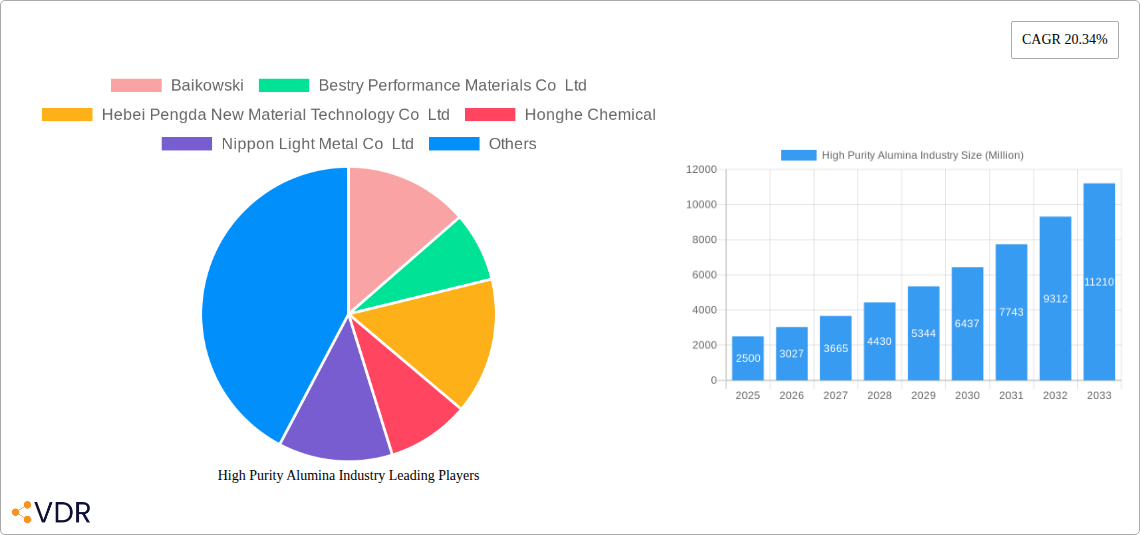
High Purity Alumina Industry Market Size (In Million)
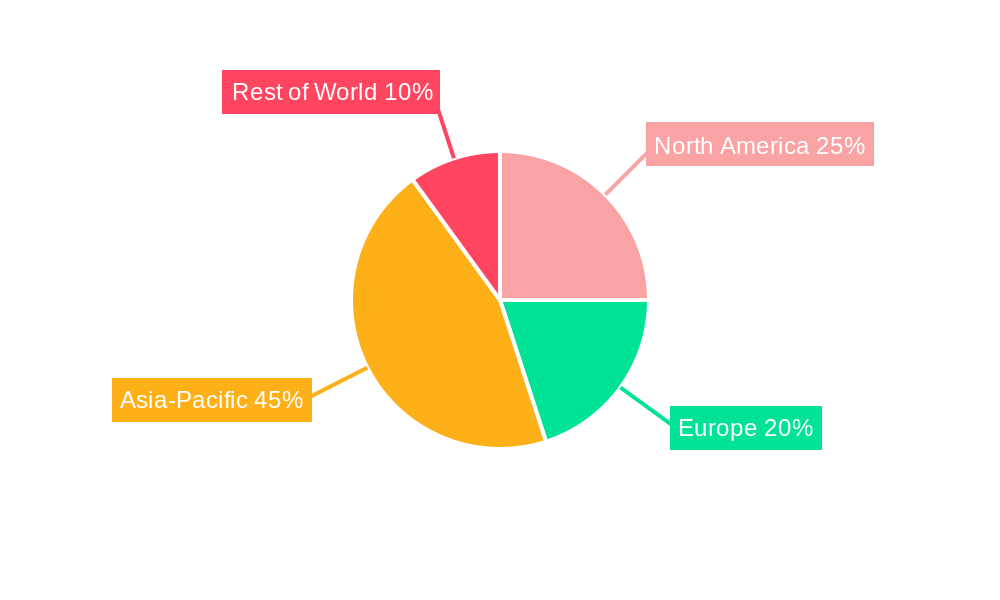
The HPA market's segmentation highlights its diverse applications, with the electronics and LED sectors anticipated to drive substantial growth, followed closely by ceramics and refractories. Geographically, regions with strong manufacturing bases and significant investments in technological advancement, such as Asia-Pacific (especially China), North America, and Europe, are expected to be dominant. The overall market size is substantial and growing rapidly, presenting a high-potential investment landscape. Deeper analysis into specific segment breakdowns, regional dynamics, and competitive intelligence will offer more granular insights into this dynamic market.
High Purity Alumina Industry Company Market Share
High Purity Alumina Industry Market Report: 2019-2033
This comprehensive report provides a detailed analysis of the High Purity Alumina industry, encompassing market dynamics, growth trends, regional segmentation, product landscape, and key players. The study period covers 2019-2033, with a base year of 2025 and a forecast period of 2025-2033. The report leverages extensive primary and secondary research to deliver actionable insights for industry professionals, investors, and strategic decision-makers. The global High Purity Alumina market is valued at xx Million in 2025 and is projected to reach xx Million by 2033.
High Purity Alumina Industry Market Dynamics & Structure
The High Purity Alumina market is characterized by a moderately concentrated landscape, with several key players holding significant market shares. Technological innovation, particularly in the production of ultra-high purity alumina (99.99% or more), is a major driver. Stringent regulatory frameworks concerning material purity and environmental impact influence market dynamics. Competitive substitutes, like alternative ceramic materials, pose a challenge. The end-user industries are diverse, ranging from electronics to advanced batteries, shaping demand patterns. M&A activity has been relatively moderate, with a few key deals impacting market consolidation.
- Market Concentration: Moderate concentration with top 5 players holding approximately xx% of market share (2025).
- Technological Innovation: Focus on ultra-fine α-alumina and improved production efficiency.
- Regulatory Frameworks: Stringent environmental regulations and quality standards influence production processes.
- Competitive Substitutes: Alternative ceramic materials pose a moderate competitive threat.
- End-User Demographics: Demand driven by electronics, advanced ceramics, and the burgeoning lithium-ion battery industry.
- M&A Trends: Limited major M&A activity in the recent past, with xx major deals recorded from 2019-2024.
High Purity Alumina Industry Growth Trends & Insights
The High Purity Alumina market experienced a CAGR of xx% during the historical period (2019-2024) and is projected to maintain a CAGR of xx% during the forecast period (2025-2033). This growth is fueled by increasing demand from the electronics, automotive, and energy sectors. The adoption rate of high-purity alumina is rising due to its superior performance characteristics. Technological disruptions, such as the introduction of new production methods by Sumitomo Chemical (detailed below), are driving efficiency gains and product improvements. Consumer behavior shifts towards environmentally friendly products are also influencing market growth, particularly in the battery sector.
Dominant Regions, Countries, or Segments in High Purity Alumina Industry
The [Region, e.g., Asia-Pacific] region dominates the High Purity Alumina market, accounting for xx% of global revenue in 2025. This dominance is attributed to several factors:
- Strong Manufacturing Base: Presence of major alumina producers and downstream industries.
- Government Support: Favorable economic policies and investments in advanced materials research.
- Growing Demand: Rapid expansion of the electronics and battery sectors in key countries like China and Japan.
[Other regions like North America and Europe can be analyzed similarly with specifics on driving factors and market share percentages].
High Purity Alumina Industry Product Landscape
High purity alumina products vary in particle size, morphology, and purity level, catering to specific application requirements. Innovations focus on ultra-fine powders for enhanced performance in electronics and advanced ceramics. Key performance metrics include particle size distribution, purity, and surface area. Unique selling propositions include high thermal conductivity, chemical inertness, and biocompatibility. Technological advancements center around more efficient and sustainable production methods.
Key Drivers, Barriers & Challenges in High Purity Alumina Industry
Key Drivers:
- Growing demand from electronics & battery industries.
- Technological advancements in production processes (e.g., Sumitomo Chemical's new technology).
- Government support for clean energy technologies.
Challenges:
- Fluctuations in raw material prices (e.g., bauxite).
- Stringent environmental regulations impacting production costs.
- Intense competition from existing and emerging players. This results in xx% of the market share being contested annually.
Emerging Opportunities in High Purity Alumina Industry
- Expansion into niche applications like medical implants and high-temperature coatings.
- Development of novel alumina-based composites with improved properties.
- Leveraging sustainable manufacturing practices to reduce environmental impact.
Growth Accelerators in the High Purity Alumina Industry
Technological breakthroughs, especially in the production of ultra-fine α-alumina, are driving market expansion. Strategic partnerships between raw material suppliers, alumina producers, and downstream industries are fostering innovation and streamlining supply chains. Expansion into high-growth regions, particularly in Asia and emerging markets, presents significant opportunities.
Key Players Shaping the High Purity Alumina Industry Market
- Baikowski
- Bestry Performance Materials Co Ltd
- Hebei Pengda New Material Technology Co Ltd
- Honghe Chemical
- Nippon Light Metal Co Ltd
- Polar Sapphire
- Rusal
- Sasol (USA) Corporation
- Shandong Keheng Crystal Material Technology Co Ltd
- Sumitomo Chemical Co Ltd
- Wuxi Tuobada Titanium Dioxide Products Co Ltd
- Xuancheng Jingrui New Materials Co Ltd
Notable Milestones in High Purity Alumina Industry Sector
- August 2023: Sumitomo Chemical introduces a new technology for ultra-fine α-alumina production, slated to begin in September 2023. This significantly enhances product quality and potential applications.
- January 2022: Polar Performance Materials receives USD 4.1 million in funding for high-purity alumina production for lithium-ion batteries, signaling growing investment in the sector.
In-Depth High Purity Alumina Industry Market Outlook
The High Purity Alumina market is poised for continued robust growth driven by technological innovation, increasing demand from key end-use sectors, and supportive government policies. Strategic investments in R&D and expansion into emerging applications offer significant opportunities for market players. The focus on sustainability and environmentally friendly production methods will further shape industry dynamics in the coming years.
High Purity Alumina Industry Segmentation
-
1. Type
- 1.1. 4N
- 1.2. 5N
- 1.3. 6N
-
2. Technology
- 2.1. Hydrolysis
- 2.2. Hydrochloric Acid Leaching
-
3. Application
- 3.1. LED Lighting
- 3.2. Phosphor
- 3.3. Semiconductor
- 3.4. Lithium-ion (Li-Ion) Batteries
- 3.5. Technical Ceramics
- 3.6. Other Applications
High Purity Alumina Industry Segmentation By Geography
-
1. Asia Pacific
- 1.1. China
- 1.2. India
- 1.3. Japan
- 1.4. South Korea
- 1.5. Malaysia
- 1.6. Thailand
- 1.7. Indonesia
- 1.8. Vietnam
- 1.9. Rest of Asia Pacific
-
2. North America
- 2.1. United States
- 2.2. Canada
- 2.3. Mexico
-
3. Europe
- 3.1. Germany
- 3.2. United Kingdom
- 3.3. France
- 3.4. Italy
- 3.5. Spain
- 3.6. NORDIC Countries
- 3.7. Turkey
- 3.8. Russia
- 3.9. Rest of Europe
-
4. South America
- 4.1. Brazil
- 4.2. Argentina
- 4.3. Colombia
- 4.4. Rest of South America
-
5. Middle East and Africa
- 5.1. Saudi Arabia
- 5.2. Qatar
- 5.3. United Arab Emirates
- 5.4. Nigeria
- 5.5. Egypt
- 5.6. South Africa
- 5.7. Rest of Middle East and Africa
High Purity Alumina Industry Regional Market Share
Geographic Coverage of High Purity Alumina Industry
High Purity Alumina Industry REPORT HIGHLIGHTS
| Aspects | Details |
|---|---|
| Study Period | 2020-2034 |
| Base Year | 2025 |
| Estimated Year | 2026 |
| Forecast Period | 2026-2034 |
| Historical Period | 2020-2025 |
| Growth Rate | CAGR of 20.62% from 2020-2034 |
| Segmentation |
|
Table of Contents
- 1. Introduction
- 1.1. Research Scope
- 1.2. Market Segmentation
- 1.3. Research Objective
- 1.4. Definitions and Assumptions
- 2. Executive Summary
- 2.1. Market Snapshot
- 3. Market Dynamics
- 3.1. Market Drivers
- 3.2. Market Restrains
- 3.3. Market Trends
- 3.4. Market Opportunities
- 4. Market Factor Analysis
- 4.1. Porters Five Forces
- 4.1.1. Bargaining Power of Suppliers
- 4.1.2. Bargaining Power of Buyers
- 4.1.3. Threat of New Entrants
- 4.1.4. Threat of Substitutes
- 4.1.5. Competitive Rivalry
- 4.2. PESTEL analysis
- 4.3. BCG Analysis
- 4.3.1. Stars (High Growth, High Market Share)
- 4.3.2. Cash Cows (Low Growth, High Market Share)
- 4.3.3. Question Mark (High Growth, Low Market Share)
- 4.3.4. Dogs (Low Growth, Low Market Share)
- 4.4. Ansoff Matrix Analysis
- 4.5. Supply Chain Analysis
- 4.6. Regulatory Landscape
- 4.7. Current Market Potential and Opportunity Assessment (TAM–SAM–SOM Framework)
- 4.8. VDR Analyst Note
- 4.1. Porters Five Forces
- 5. Market Analysis, Insights and Forecast 2021-2033
- 5.1. Market Analysis, Insights and Forecast - by Type
- 5.1.1. 4N
- 5.1.2. 5N
- 5.1.3. 6N
- 5.2. Market Analysis, Insights and Forecast - by Technology
- 5.2.1. Hydrolysis
- 5.2.2. Hydrochloric Acid Leaching
- 5.3. Market Analysis, Insights and Forecast - by Application
- 5.3.1. LED Lighting
- 5.3.2. Phosphor
- 5.3.3. Semiconductor
- 5.3.4. Lithium-ion (Li-Ion) Batteries
- 5.3.5. Technical Ceramics
- 5.3.6. Other Applications
- 5.4. Market Analysis, Insights and Forecast - by Region
- 5.4.1. Asia Pacific
- 5.4.2. North America
- 5.4.3. Europe
- 5.4.4. South America
- 5.4.5. Middle East and Africa
- 5.1. Market Analysis, Insights and Forecast - by Type
- 6. Global High Purity Alumina Industry Analysis, Insights and Forecast, 2021-2033
- 6.1. Market Analysis, Insights and Forecast - by Type
- 6.1.1. 4N
- 6.1.2. 5N
- 6.1.3. 6N
- 6.2. Market Analysis, Insights and Forecast - by Technology
- 6.2.1. Hydrolysis
- 6.2.2. Hydrochloric Acid Leaching
- 6.3. Market Analysis, Insights and Forecast - by Application
- 6.3.1. LED Lighting
- 6.3.2. Phosphor
- 6.3.3. Semiconductor
- 6.3.4. Lithium-ion (Li-Ion) Batteries
- 6.3.5. Technical Ceramics
- 6.3.6. Other Applications
- 6.1. Market Analysis, Insights and Forecast - by Type
- 7. Asia Pacific High Purity Alumina Industry Analysis, Insights and Forecast, 2021-2033
- 7.1. Market Analysis, Insights and Forecast - by Type
- 7.1.1. 4N
- 7.1.2. 5N
- 7.1.3. 6N
- 7.2. Market Analysis, Insights and Forecast - by Technology
- 7.2.1. Hydrolysis
- 7.2.2. Hydrochloric Acid Leaching
- 7.3. Market Analysis, Insights and Forecast - by Application
- 7.3.1. LED Lighting
- 7.3.2. Phosphor
- 7.3.3. Semiconductor
- 7.3.4. Lithium-ion (Li-Ion) Batteries
- 7.3.5. Technical Ceramics
- 7.3.6. Other Applications
- 7.1. Market Analysis, Insights and Forecast - by Type
- 8. North America High Purity Alumina Industry Analysis, Insights and Forecast, 2021-2033
- 8.1. Market Analysis, Insights and Forecast - by Type
- 8.1.1. 4N
- 8.1.2. 5N
- 8.1.3. 6N
- 8.2. Market Analysis, Insights and Forecast - by Technology
- 8.2.1. Hydrolysis
- 8.2.2. Hydrochloric Acid Leaching
- 8.3. Market Analysis, Insights and Forecast - by Application
- 8.3.1. LED Lighting
- 8.3.2. Phosphor
- 8.3.3. Semiconductor
- 8.3.4. Lithium-ion (Li-Ion) Batteries
- 8.3.5. Technical Ceramics
- 8.3.6. Other Applications
- 8.1. Market Analysis, Insights and Forecast - by Type
- 9. Europe High Purity Alumina Industry Analysis, Insights and Forecast, 2021-2033
- 9.1. Market Analysis, Insights and Forecast - by Type
- 9.1.1. 4N
- 9.1.2. 5N
- 9.1.3. 6N
- 9.2. Market Analysis, Insights and Forecast - by Technology
- 9.2.1. Hydrolysis
- 9.2.2. Hydrochloric Acid Leaching
- 9.3. Market Analysis, Insights and Forecast - by Application
- 9.3.1. LED Lighting
- 9.3.2. Phosphor
- 9.3.3. Semiconductor
- 9.3.4. Lithium-ion (Li-Ion) Batteries
- 9.3.5. Technical Ceramics
- 9.3.6. Other Applications
- 9.1. Market Analysis, Insights and Forecast - by Type
- 10. South America High Purity Alumina Industry Analysis, Insights and Forecast, 2021-2033
- 10.1. Market Analysis, Insights and Forecast - by Type
- 10.1.1. 4N
- 10.1.2. 5N
- 10.1.3. 6N
- 10.2. Market Analysis, Insights and Forecast - by Technology
- 10.2.1. Hydrolysis
- 10.2.2. Hydrochloric Acid Leaching
- 10.3. Market Analysis, Insights and Forecast - by Application
- 10.3.1. LED Lighting
- 10.3.2. Phosphor
- 10.3.3. Semiconductor
- 10.3.4. Lithium-ion (Li-Ion) Batteries
- 10.3.5. Technical Ceramics
- 10.3.6. Other Applications
- 10.1. Market Analysis, Insights and Forecast - by Type
- 11. Middle East and Africa High Purity Alumina Industry Analysis, Insights and Forecast, 2021-2033
- 11.1. Market Analysis, Insights and Forecast - by Type
- 11.1.1. 4N
- 11.1.2. 5N
- 11.1.3. 6N
- 11.2. Market Analysis, Insights and Forecast - by Technology
- 11.2.1. Hydrolysis
- 11.2.2. Hydrochloric Acid Leaching
- 11.3. Market Analysis, Insights and Forecast - by Application
- 11.3.1. LED Lighting
- 11.3.2. Phosphor
- 11.3.3. Semiconductor
- 11.3.4. Lithium-ion (Li-Ion) Batteries
- 11.3.5. Technical Ceramics
- 11.3.6. Other Applications
- 11.1. Market Analysis, Insights and Forecast - by Type
- 12. Competitive Analysis
- 12.1. Company Profiles
- 12.1.1 Baikowski
- 12.1.1.1. Company Overview
- 12.1.1.2. Products
- 12.1.1.3. Company Financials
- 12.1.1.4. SWOT Analysis
- 12.1.2 Bestry Performance Materials Co Ltd
- 12.1.2.1. Company Overview
- 12.1.2.2. Products
- 12.1.2.3. Company Financials
- 12.1.2.4. SWOT Analysis
- 12.1.3 Hebei Pengda New Material Technology Co Ltd
- 12.1.3.1. Company Overview
- 12.1.3.2. Products
- 12.1.3.3. Company Financials
- 12.1.3.4. SWOT Analysis
- 12.1.4 Honghe Chemical
- 12.1.4.1. Company Overview
- 12.1.4.2. Products
- 12.1.4.3. Company Financials
- 12.1.4.4. SWOT Analysis
- 12.1.5 Nippon Light Metal Co Ltd
- 12.1.5.1. Company Overview
- 12.1.5.2. Products
- 12.1.5.3. Company Financials
- 12.1.5.4. SWOT Analysis
- 12.1.6 Polar Sapphire
- 12.1.6.1. Company Overview
- 12.1.6.2. Products
- 12.1.6.3. Company Financials
- 12.1.6.4. SWOT Analysis
- 12.1.7 Rusal
- 12.1.7.1. Company Overview
- 12.1.7.2. Products
- 12.1.7.3. Company Financials
- 12.1.7.4. SWOT Analysis
- 12.1.8 Sasol (USA) Corporation
- 12.1.8.1. Company Overview
- 12.1.8.2. Products
- 12.1.8.3. Company Financials
- 12.1.8.4. SWOT Analysis
- 12.1.9 Shandong Keheng Crystal Material Technology Co Ltd
- 12.1.9.1. Company Overview
- 12.1.9.2. Products
- 12.1.9.3. Company Financials
- 12.1.9.4. SWOT Analysis
- 12.1.10 Sumitomo Chemical Co Ltd
- 12.1.10.1. Company Overview
- 12.1.10.2. Products
- 12.1.10.3. Company Financials
- 12.1.10.4. SWOT Analysis
- 12.1.11 Wuxi Tuobada Titanium Dioxide Products Co Ltd
- 12.1.11.1. Company Overview
- 12.1.11.2. Products
- 12.1.11.3. Company Financials
- 12.1.11.4. SWOT Analysis
- 12.1.12 Xuancheng Jingrui New Materials Co Ltd*List Not Exhaustive
- 12.1.12.1. Company Overview
- 12.1.12.2. Products
- 12.1.12.3. Company Financials
- 12.1.12.4. SWOT Analysis
- 12.1.1 Baikowski
- 12.2. Market Entropy
- 12.2.1 Company's Key Areas Served
- 12.2.2 Recent Developments
- 12.3. Company Market Share Analysis 2025
- 12.3.1 Top 5 Companies Market Share Analysis
- 12.3.2 Top 3 Companies Market Share Analysis
- 12.4. List of Potential Customers
- 13. Research Methodology
List of Figures
- Figure 1: Global High Purity Alumina Industry Revenue Breakdown (billion, %) by Region 2025 & 2033
- Figure 2: Asia Pacific High Purity Alumina Industry Revenue (billion), by Type 2025 & 2033
- Figure 3: Asia Pacific High Purity Alumina Industry Revenue Share (%), by Type 2025 & 2033
- Figure 4: Asia Pacific High Purity Alumina Industry Revenue (billion), by Technology 2025 & 2033
- Figure 5: Asia Pacific High Purity Alumina Industry Revenue Share (%), by Technology 2025 & 2033
- Figure 6: Asia Pacific High Purity Alumina Industry Revenue (billion), by Application 2025 & 2033
- Figure 7: Asia Pacific High Purity Alumina Industry Revenue Share (%), by Application 2025 & 2033
- Figure 8: Asia Pacific High Purity Alumina Industry Revenue (billion), by Country 2025 & 2033
- Figure 9: Asia Pacific High Purity Alumina Industry Revenue Share (%), by Country 2025 & 2033
- Figure 10: North America High Purity Alumina Industry Revenue (billion), by Type 2025 & 2033
- Figure 11: North America High Purity Alumina Industry Revenue Share (%), by Type 2025 & 2033
- Figure 12: North America High Purity Alumina Industry Revenue (billion), by Technology 2025 & 2033
- Figure 13: North America High Purity Alumina Industry Revenue Share (%), by Technology 2025 & 2033
- Figure 14: North America High Purity Alumina Industry Revenue (billion), by Application 2025 & 2033
- Figure 15: North America High Purity Alumina Industry Revenue Share (%), by Application 2025 & 2033
- Figure 16: North America High Purity Alumina Industry Revenue (billion), by Country 2025 & 2033
- Figure 17: North America High Purity Alumina Industry Revenue Share (%), by Country 2025 & 2033
- Figure 18: Europe High Purity Alumina Industry Revenue (billion), by Type 2025 & 2033
- Figure 19: Europe High Purity Alumina Industry Revenue Share (%), by Type 2025 & 2033
- Figure 20: Europe High Purity Alumina Industry Revenue (billion), by Technology 2025 & 2033
- Figure 21: Europe High Purity Alumina Industry Revenue Share (%), by Technology 2025 & 2033
- Figure 22: Europe High Purity Alumina Industry Revenue (billion), by Application 2025 & 2033
- Figure 23: Europe High Purity Alumina Industry Revenue Share (%), by Application 2025 & 2033
- Figure 24: Europe High Purity Alumina Industry Revenue (billion), by Country 2025 & 2033
- Figure 25: Europe High Purity Alumina Industry Revenue Share (%), by Country 2025 & 2033
- Figure 26: South America High Purity Alumina Industry Revenue (billion), by Type 2025 & 2033
- Figure 27: South America High Purity Alumina Industry Revenue Share (%), by Type 2025 & 2033
- Figure 28: South America High Purity Alumina Industry Revenue (billion), by Technology 2025 & 2033
- Figure 29: South America High Purity Alumina Industry Revenue Share (%), by Technology 2025 & 2033
- Figure 30: South America High Purity Alumina Industry Revenue (billion), by Application 2025 & 2033
- Figure 31: South America High Purity Alumina Industry Revenue Share (%), by Application 2025 & 2033
- Figure 32: South America High Purity Alumina Industry Revenue (billion), by Country 2025 & 2033
- Figure 33: South America High Purity Alumina Industry Revenue Share (%), by Country 2025 & 2033
- Figure 34: Middle East and Africa High Purity Alumina Industry Revenue (billion), by Type 2025 & 2033
- Figure 35: Middle East and Africa High Purity Alumina Industry Revenue Share (%), by Type 2025 & 2033
- Figure 36: Middle East and Africa High Purity Alumina Industry Revenue (billion), by Technology 2025 & 2033
- Figure 37: Middle East and Africa High Purity Alumina Industry Revenue Share (%), by Technology 2025 & 2033
- Figure 38: Middle East and Africa High Purity Alumina Industry Revenue (billion), by Application 2025 & 2033
- Figure 39: Middle East and Africa High Purity Alumina Industry Revenue Share (%), by Application 2025 & 2033
- Figure 40: Middle East and Africa High Purity Alumina Industry Revenue (billion), by Country 2025 & 2033
- Figure 41: Middle East and Africa High Purity Alumina Industry Revenue Share (%), by Country 2025 & 2033
List of Tables
- Table 1: Global High Purity Alumina Industry Revenue billion Forecast, by Type 2020 & 2033
- Table 2: Global High Purity Alumina Industry Revenue billion Forecast, by Technology 2020 & 2033
- Table 3: Global High Purity Alumina Industry Revenue billion Forecast, by Application 2020 & 2033
- Table 4: Global High Purity Alumina Industry Revenue billion Forecast, by Region 2020 & 2033
- Table 5: Global High Purity Alumina Industry Revenue billion Forecast, by Type 2020 & 2033
- Table 6: Global High Purity Alumina Industry Revenue billion Forecast, by Technology 2020 & 2033
- Table 7: Global High Purity Alumina Industry Revenue billion Forecast, by Application 2020 & 2033
- Table 8: Global High Purity Alumina Industry Revenue billion Forecast, by Country 2020 & 2033
- Table 9: China High Purity Alumina Industry Revenue (billion) Forecast, by Application 2020 & 2033
- Table 10: India High Purity Alumina Industry Revenue (billion) Forecast, by Application 2020 & 2033
- Table 11: Japan High Purity Alumina Industry Revenue (billion) Forecast, by Application 2020 & 2033
- Table 12: South Korea High Purity Alumina Industry Revenue (billion) Forecast, by Application 2020 & 2033
- Table 13: Malaysia High Purity Alumina Industry Revenue (billion) Forecast, by Application 2020 & 2033
- Table 14: Thailand High Purity Alumina Industry Revenue (billion) Forecast, by Application 2020 & 2033
- Table 15: Indonesia High Purity Alumina Industry Revenue (billion) Forecast, by Application 2020 & 2033
- Table 16: Vietnam High Purity Alumina Industry Revenue (billion) Forecast, by Application 2020 & 2033
- Table 17: Rest of Asia Pacific High Purity Alumina Industry Revenue (billion) Forecast, by Application 2020 & 2033
- Table 18: Global High Purity Alumina Industry Revenue billion Forecast, by Type 2020 & 2033
- Table 19: Global High Purity Alumina Industry Revenue billion Forecast, by Technology 2020 & 2033
- Table 20: Global High Purity Alumina Industry Revenue billion Forecast, by Application 2020 & 2033
- Table 21: Global High Purity Alumina Industry Revenue billion Forecast, by Country 2020 & 2033
- Table 22: United States High Purity Alumina Industry Revenue (billion) Forecast, by Application 2020 & 2033
- Table 23: Canada High Purity Alumina Industry Revenue (billion) Forecast, by Application 2020 & 2033
- Table 24: Mexico High Purity Alumina Industry Revenue (billion) Forecast, by Application 2020 & 2033
- Table 25: Global High Purity Alumina Industry Revenue billion Forecast, by Type 2020 & 2033
- Table 26: Global High Purity Alumina Industry Revenue billion Forecast, by Technology 2020 & 2033
- Table 27: Global High Purity Alumina Industry Revenue billion Forecast, by Application 2020 & 2033
- Table 28: Global High Purity Alumina Industry Revenue billion Forecast, by Country 2020 & 2033
- Table 29: Germany High Purity Alumina Industry Revenue (billion) Forecast, by Application 2020 & 2033
- Table 30: United Kingdom High Purity Alumina Industry Revenue (billion) Forecast, by Application 2020 & 2033
- Table 31: France High Purity Alumina Industry Revenue (billion) Forecast, by Application 2020 & 2033
- Table 32: Italy High Purity Alumina Industry Revenue (billion) Forecast, by Application 2020 & 2033
- Table 33: Spain High Purity Alumina Industry Revenue (billion) Forecast, by Application 2020 & 2033
- Table 34: NORDIC Countries High Purity Alumina Industry Revenue (billion) Forecast, by Application 2020 & 2033
- Table 35: Turkey High Purity Alumina Industry Revenue (billion) Forecast, by Application 2020 & 2033
- Table 36: Russia High Purity Alumina Industry Revenue (billion) Forecast, by Application 2020 & 2033
- Table 37: Rest of Europe High Purity Alumina Industry Revenue (billion) Forecast, by Application 2020 & 2033
- Table 38: Global High Purity Alumina Industry Revenue billion Forecast, by Type 2020 & 2033
- Table 39: Global High Purity Alumina Industry Revenue billion Forecast, by Technology 2020 & 2033
- Table 40: Global High Purity Alumina Industry Revenue billion Forecast, by Application 2020 & 2033
- Table 41: Global High Purity Alumina Industry Revenue billion Forecast, by Country 2020 & 2033
- Table 42: Brazil High Purity Alumina Industry Revenue (billion) Forecast, by Application 2020 & 2033
- Table 43: Argentina High Purity Alumina Industry Revenue (billion) Forecast, by Application 2020 & 2033
- Table 44: Colombia High Purity Alumina Industry Revenue (billion) Forecast, by Application 2020 & 2033
- Table 45: Rest of South America High Purity Alumina Industry Revenue (billion) Forecast, by Application 2020 & 2033
- Table 46: Global High Purity Alumina Industry Revenue billion Forecast, by Type 2020 & 2033
- Table 47: Global High Purity Alumina Industry Revenue billion Forecast, by Technology 2020 & 2033
- Table 48: Global High Purity Alumina Industry Revenue billion Forecast, by Application 2020 & 2033
- Table 49: Global High Purity Alumina Industry Revenue billion Forecast, by Country 2020 & 2033
- Table 50: Saudi Arabia High Purity Alumina Industry Revenue (billion) Forecast, by Application 2020 & 2033
- Table 51: Qatar High Purity Alumina Industry Revenue (billion) Forecast, by Application 2020 & 2033
- Table 52: United Arab Emirates High Purity Alumina Industry Revenue (billion) Forecast, by Application 2020 & 2033
- Table 53: Nigeria High Purity Alumina Industry Revenue (billion) Forecast, by Application 2020 & 2033
- Table 54: Egypt High Purity Alumina Industry Revenue (billion) Forecast, by Application 2020 & 2033
- Table 55: South Africa High Purity Alumina Industry Revenue (billion) Forecast, by Application 2020 & 2033
- Table 56: Rest of Middle East and Africa High Purity Alumina Industry Revenue (billion) Forecast, by Application 2020 & 2033
Frequently Asked Questions
1. What is the projected Compound Annual Growth Rate (CAGR) of the High Purity Alumina Industry?
The projected CAGR is approximately 20.62%.
2. Which companies are prominent players in the High Purity Alumina Industry?
Key companies in the market include Baikowski, Bestry Performance Materials Co Ltd, Hebei Pengda New Material Technology Co Ltd, Honghe Chemical, Nippon Light Metal Co Ltd, Polar Sapphire, Rusal, Sasol (USA) Corporation, Shandong Keheng Crystal Material Technology Co Ltd, Sumitomo Chemical Co Ltd, Wuxi Tuobada Titanium Dioxide Products Co Ltd, Xuancheng Jingrui New Materials Co Ltd*List Not Exhaustive.
3. What are the main segments of the High Purity Alumina Industry?
The market segments include Type, Technology, Application.
4. Can you provide details about the market size?
The market size is estimated to be USD 0.57 billion as of 2022.
5. What are some drivers contributing to market growth?
Increasing Demand for LED-based Lighting; Demand from Lithium-ion Battery Markets.
6. What are the notable trends driving market growth?
The LED Lighting Segment is Expected to Dominate the Market.
7. Are there any restraints impacting market growth?
Increasing Demand for LED-based Lighting; Demand from Lithium-ion Battery Markets.
8. Can you provide examples of recent developments in the market?
August 2023: Sumitomo Chemical introduced a new technology for the production of ultra-fine α-alumina, which was set to start in September 2023. Alumina materials that are made by calcining aluminum hydroxide at high temperatures have a purity of around 99.99% or more. They are called ultra-high purity alumina.
9. What pricing options are available for accessing the report?
Pricing options include single-user, multi-user, and enterprise licenses priced at USD 4750, USD 5250, and USD 8750 respectively.
10. Is the market size provided in terms of value or volume?
The market size is provided in terms of value, measured in billion.
11. Are there any specific market keywords associated with the report?
Yes, the market keyword associated with the report is "High Purity Alumina Industry," which aids in identifying and referencing the specific market segment covered.
12. How do I determine which pricing option suits my needs best?
The pricing options vary based on user requirements and access needs. Individual users may opt for single-user licenses, while businesses requiring broader access may choose multi-user or enterprise licenses for cost-effective access to the report.
13. Are there any additional resources or data provided in the High Purity Alumina Industry report?
While the report offers comprehensive insights, it's advisable to review the specific contents or supplementary materials provided to ascertain if additional resources or data are available.
14. How can I stay updated on further developments or reports in the High Purity Alumina Industry?
To stay informed about further developments, trends, and reports in the High Purity Alumina Industry, consider subscribing to industry newsletters, following relevant companies and organizations, or regularly checking reputable industry news sources and publications.
Methodology
Step 1 - Identification of Relevant Samples Size from Population Database


Step 2 - Approaches for Defining Global Market Size (Value, Volume* & Price*)

Note*: In applicable scenarios
Step 3 - Data Sources
Primary Research
- Web Analytics
- Survey Reports
- Research Institute
- Latest Research Reports
- Opinion Leaders
Secondary Research
- Annual Reports
- White Paper
- Latest Press Release
- Industry Association
- Paid Database
- Investor Presentations

Step 4 - Data Triangulation
Involves using different sources of information in order to increase the validity of a study
These sources are likely to be stakeholders in a program - participants, other researchers, program staff, other community members, and so on.
Then we put all data in single framework & apply various statistical tools to find out the dynamic on the market.
During the analysis stage, feedback from the stakeholder groups would be compared to determine areas of agreement as well as areas of divergence