
Key Insights
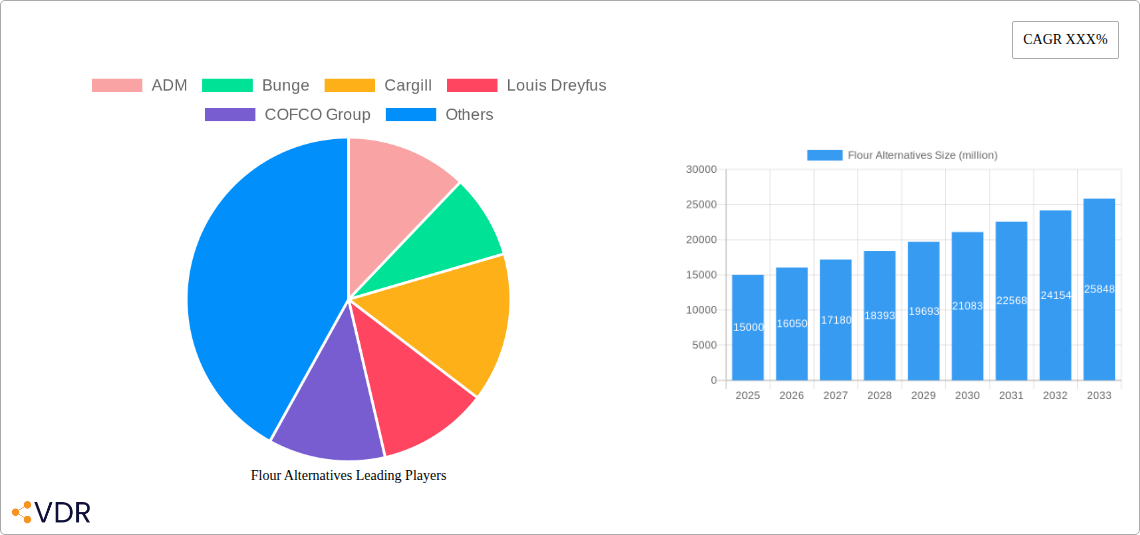
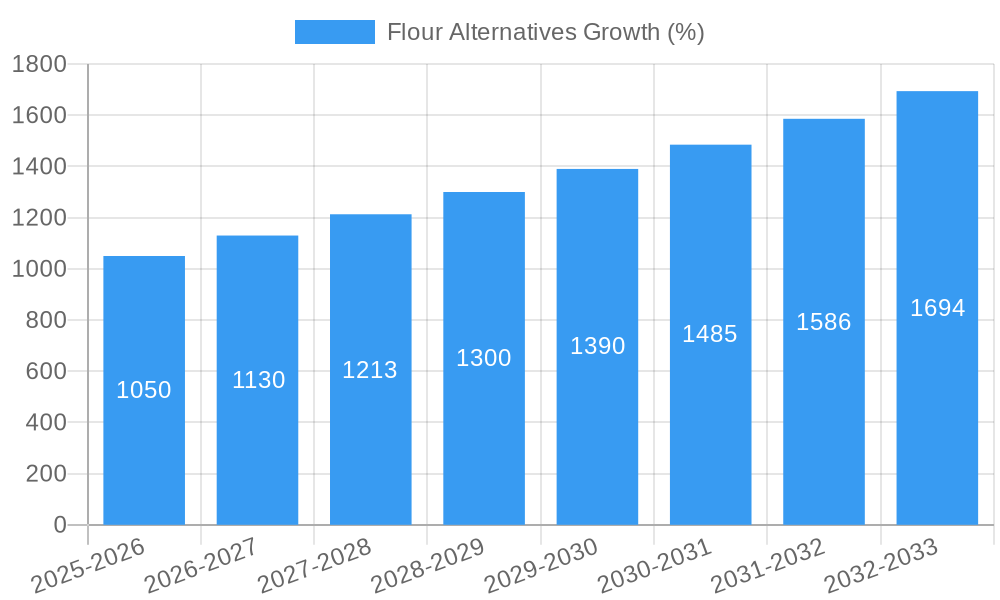
The global flour alternatives market is experiencing robust growth, driven by increasing health consciousness, rising demand for gluten-free products, and the growing popularity of plant-based diets. The market, estimated at $15 billion in 2025, is projected to exhibit a Compound Annual Growth Rate (CAGR) of 7% from 2025 to 2033, reaching approximately $25 billion by 2033. This expansion is fueled by several key factors. Consumers are increasingly seeking alternatives to traditional wheat flour due to concerns about gluten intolerance, allergies, and the perceived health benefits of alternative grains and ingredients. This trend is particularly strong in developed nations, where awareness of dietary health is high, but is also gaining traction in developing economies. Furthermore, innovations in food technology are leading to the development of flour alternatives with improved texture, taste, and nutritional profiles, making them more appealing to a wider consumer base. The market is segmented by various types of flour alternatives including almond flour, coconut flour, chickpea flour, rice flour, and others, each catering to specific dietary needs and preferences. Major players such as ADM, Bunge, Cargill, and Wilmar International are actively involved in production, processing, and distribution, contributing to market competitiveness.
The market's growth, however, is not without its challenges. Fluctuations in raw material prices, particularly for certain specialty grains and nuts, can impact profitability. Furthermore, the relatively high cost of some flour alternatives compared to traditional wheat flour can limit market penetration in price-sensitive segments. Despite these constraints, the long-term outlook for the flour alternatives market remains positive. Continued innovation, expanding consumer awareness of health benefits, and the increasing availability of products in diverse retail channels are expected to drive substantial market growth in the coming years. The rise of online retail and direct-to-consumer brands is also expected to further fuel the expansion. Regional variations in consumption patterns are also noteworthy, with North America and Europe currently dominating the market but strong growth potential existing in Asia-Pacific.
Flour Alternatives Market Report: A Comprehensive Analysis (2019-2033)
This comprehensive report provides an in-depth analysis of the Flour Alternatives market, encompassing market dynamics, growth trends, regional insights, product landscape, and future outlook. The study period spans from 2019 to 2033, with 2025 serving as the base and estimated year. The report is essential for industry professionals, investors, and strategists seeking a thorough understanding of this rapidly evolving market. The parent market is the global food and beverage industry, while the child market is the alternative ingredient sector within food production.
The report covers a global market estimated at xx million units in 2025, projected to reach xx million units by 2033, exhibiting a CAGR of xx% during the forecast period (2025-2033).
Flour Alternatives Market Dynamics & Structure
This section analyzes the competitive landscape, technological advancements, and regulatory influences shaping the flour alternatives market. The report delves into market concentration, identifying key players and their respective market shares. Technological innovation drivers, such as advancements in processing and formulation, are examined alongside regulatory frameworks impacting product development and labeling. The analysis also considers competitive substitutes and the evolving end-user demographics, including dietary preferences and health consciousness. Finally, it explores mergers and acquisitions (M&A) trends, quantifying deal volumes and assessing their impact on market consolidation.
- Market Concentration: Highly fragmented with top 5 players holding xx% market share in 2025.
- Technological Innovation: Focus on improving nutritional profiles, texture, and cost-effectiveness of alternatives.
- Regulatory Framework: Varying regulations across regions impact labeling, ingredient sourcing, and claims.
- Competitive Substitutes: Traditional wheat flour remains a dominant competitor, requiring strong differentiation.
- End-User Demographics: Growing demand driven by health-conscious consumers, gluten-free diets, and allergies.
- M&A Trends: xx M&A deals recorded between 2019 and 2024, indicating consolidation and expansion strategies.
Flour Alternatives Growth Trends & Insights
This section leverages proprietary data and industry expertise to provide a detailed analysis of market size evolution, adoption rates, technological disruptions, and shifting consumer behaviors within the flour alternatives market. It details the historical market size (2019-2024), provides an estimate for 2025, and projects growth through 2033. The analysis will pinpoint specific growth drivers and identify any potential market saturation points. Key performance indicators (KPIs) such as CAGR, market penetration rates, and regional variations will be used to contextualize the findings and reveal areas of opportunity.
(Detailed analysis will be provided in the full report, utilizing approximately 600 words.)
Dominant Regions, Countries, or Segments in Flour Alternatives
This section pinpoints the leading geographic regions, specific countries, and market segments driving flour alternatives growth. Factors contributing to this dominance are explored, including economic policies, infrastructure development, consumer preferences, and regulatory environments. The analysis will utilize market share data and growth projections to support its findings and present a nuanced picture of regional performance variations.
- Leading Region: North America, driven by high consumer awareness and demand for specialized diets.
- Key Drivers: Increasing disposable incomes, health consciousness, rising prevalence of allergies & intolerances.
- Dominance Factors: Strong distribution networks, established R&D infrastructure, and favorable regulatory landscape.
- (Detailed analysis will be provided in the full report, utilizing approximately 600 words.)
Flour Alternatives Product Landscape
This section details the innovation within flour alternatives, covering a diverse range of products, their applications, and performance metrics. This encompasses unique selling propositions (USPs), technological advancements impacting product quality and shelf life. The focus is on highlighting differentiation strategies among various product offerings.
(Analysis will be provided in the full report, utilizing approximately 100-150 words.)
Key Drivers, Barriers & Challenges in Flour Alternatives
This section outlines the key drivers and challenges impacting the flour alternatives market. It explores technological advancements, economic factors, and policy changes that fuel market growth. Conversely, it analyzes supply chain issues, regulatory hurdles, and competitive pressures, quantifying their effects on market expansion.
- Key Drivers: Growing health consciousness, rising demand for gluten-free products, technological innovations improving product quality.
- Challenges: High production costs, maintaining consistent quality and texture, potential for supply chain disruptions. (Detailed analysis will be provided in the full report, utilizing approximately 150 words for each section.)
Emerging Opportunities in Flour Alternatives
This section identifies emerging trends and untapped opportunities in the flour alternatives sector. This includes innovations in product applications, evolving consumer preferences, and expansion into new geographical markets.
(Analysis will be provided in the full report, utilizing approximately 150 words.)
Growth Accelerators in the Flour Alternatives Industry
This section discusses the factors that will drive long-term growth within the flour alternatives industry. The focus is on technological breakthroughs, strategic partnerships, and successful market expansion strategies, outlining their potential impact on market trajectory.
(Analysis will be provided in the full report, utilizing approximately 150 words.)
Key Players Shaping the Flour Alternatives Market
- ADM
- Bunge
- Cargill
- Louis Dreyfus Company
- COFCO Group
- Wilmar International
- Jinshahe Group
- GoodMills Group
- Milne MicroDried
- Carolina Innovative Food Ingredients
- Liuxu Food
- Live Glean
- NorQuin
- Andean Valley Corporation
- Beichun
Notable Milestones in Flour Alternatives Sector
(This section will include a detailed chronological list of significant milestones, including product launches, mergers, acquisitions, and regulatory changes affecting the Flour Alternatives market, with their respective dates.)
In-Depth Flour Alternatives Market Outlook
This section summarizes the key growth accelerators and provides a concise outlook on the future market potential of flour alternatives. It highlights strategic opportunities for companies to capitalize on the expected growth and emphasizes the lasting impact of identified trends.
(Analysis will be provided in the full report, utilizing approximately 150 words.)
Flour Alternatives Segmentation
-
1. Application
- 1.1. Baked Goods
- 1.2. Noodles
- 1.3. Pastry
- 1.4. Fried Food
- 1.5. Others
-
2. Type
- 2.1. Corn Flour
- 2.2. Rice Flour
- 2.3. Sweet Potato Flour
- 2.4. Quinoa Flour
- 2.5. Almond Flour
- 2.6. Others
Flour Alternatives Segmentation By Geography
-
1. North America
- 1.1. United States
- 1.2. Canada
- 1.3. Mexico
-
2. South America
- 2.1. Brazil
- 2.2. Argentina
- 2.3. Rest of South America
-
3. Europe
- 3.1. United Kingdom
- 3.2. Germany
- 3.3. France
- 3.4. Italy
- 3.5. Spain
- 3.6. Russia
- 3.7. Benelux
- 3.8. Nordics
- 3.9. Rest of Europe
-
4. Middle East & Africa
- 4.1. Turkey
- 4.2. Israel
- 4.3. GCC
- 4.4. North Africa
- 4.5. South Africa
- 4.6. Rest of Middle East & Africa
-
5. Asia Pacific
- 5.1. China
- 5.2. India
- 5.3. Japan
- 5.4. South Korea
- 5.5. ASEAN
- 5.6. Oceania
- 5.7. Rest of Asia Pacific

Flour Alternatives REPORT HIGHLIGHTS
| Aspects | Details |
|---|---|
| Study Period | 2019-2033 |
| Base Year | 2024 |
| Estimated Year | 2025 |
| Forecast Period | 2025-2033 |
| Historical Period | 2019-2024 |
| Growth Rate | CAGR of XXX% from 2019-2033 |
| Segmentation |
|
Table of Contents
- 1. Introduction
- 1.1. Research Scope
- 1.2. Market Segmentation
- 1.3. Research Methodology
- 1.4. Definitions and Assumptions
- 2. Executive Summary
- 2.1. Introduction
- 3. Market Dynamics
- 3.1. Introduction
- 3.2. Market Drivers
- 3.3. Market Restrains
- 3.4. Market Trends
- 4. Market Factor Analysis
- 4.1. Porters Five Forces
- 4.2. Supply/Value Chain
- 4.3. PESTEL analysis
- 4.4. Market Entropy
- 4.5. Patent/Trademark Analysis
- 5. Global Flour Alternatives Analysis, Insights and Forecast, 2019-2031
- 5.1. Market Analysis, Insights and Forecast - by Application
- 5.1.1. Baked Goods
- 5.1.2. Noodles
- 5.1.3. Pastry
- 5.1.4. Fried Food
- 5.1.5. Others
- 5.2. Market Analysis, Insights and Forecast - by Type
- 5.2.1. Corn Flour
- 5.2.2. Rice Flour
- 5.2.3. Sweet Potato Flour
- 5.2.4. Quinoa Flour
- 5.2.5. Almond Flour
- 5.2.6. Others
- 5.3. Market Analysis, Insights and Forecast - by Region
- 5.3.1. North America
- 5.3.2. South America
- 5.3.3. Europe
- 5.3.4. Middle East & Africa
- 5.3.5. Asia Pacific
- 5.1. Market Analysis, Insights and Forecast - by Application
- 6. North America Flour Alternatives Analysis, Insights and Forecast, 2019-2031
- 6.1. Market Analysis, Insights and Forecast - by Application
- 6.1.1. Baked Goods
- 6.1.2. Noodles
- 6.1.3. Pastry
- 6.1.4. Fried Food
- 6.1.5. Others
- 6.2. Market Analysis, Insights and Forecast - by Type
- 6.2.1. Corn Flour
- 6.2.2. Rice Flour
- 6.2.3. Sweet Potato Flour
- 6.2.4. Quinoa Flour
- 6.2.5. Almond Flour
- 6.2.6. Others
- 6.1. Market Analysis, Insights and Forecast - by Application
- 7. South America Flour Alternatives Analysis, Insights and Forecast, 2019-2031
- 7.1. Market Analysis, Insights and Forecast - by Application
- 7.1.1. Baked Goods
- 7.1.2. Noodles
- 7.1.3. Pastry
- 7.1.4. Fried Food
- 7.1.5. Others
- 7.2. Market Analysis, Insights and Forecast - by Type
- 7.2.1. Corn Flour
- 7.2.2. Rice Flour
- 7.2.3. Sweet Potato Flour
- 7.2.4. Quinoa Flour
- 7.2.5. Almond Flour
- 7.2.6. Others
- 7.1. Market Analysis, Insights and Forecast - by Application
- 8. Europe Flour Alternatives Analysis, Insights and Forecast, 2019-2031
- 8.1. Market Analysis, Insights and Forecast - by Application
- 8.1.1. Baked Goods
- 8.1.2. Noodles
- 8.1.3. Pastry
- 8.1.4. Fried Food
- 8.1.5. Others
- 8.2. Market Analysis, Insights and Forecast - by Type
- 8.2.1. Corn Flour
- 8.2.2. Rice Flour
- 8.2.3. Sweet Potato Flour
- 8.2.4. Quinoa Flour
- 8.2.5. Almond Flour
- 8.2.6. Others
- 8.1. Market Analysis, Insights and Forecast - by Application
- 9. Middle East & Africa Flour Alternatives Analysis, Insights and Forecast, 2019-2031
- 9.1. Market Analysis, Insights and Forecast - by Application
- 9.1.1. Baked Goods
- 9.1.2. Noodles
- 9.1.3. Pastry
- 9.1.4. Fried Food
- 9.1.5. Others
- 9.2. Market Analysis, Insights and Forecast - by Type
- 9.2.1. Corn Flour
- 9.2.2. Rice Flour
- 9.2.3. Sweet Potato Flour
- 9.2.4. Quinoa Flour
- 9.2.5. Almond Flour
- 9.2.6. Others
- 9.1. Market Analysis, Insights and Forecast - by Application
- 10. Asia Pacific Flour Alternatives Analysis, Insights and Forecast, 2019-2031
- 10.1. Market Analysis, Insights and Forecast - by Application
- 10.1.1. Baked Goods
- 10.1.2. Noodles
- 10.1.3. Pastry
- 10.1.4. Fried Food
- 10.1.5. Others
- 10.2. Market Analysis, Insights and Forecast - by Type
- 10.2.1. Corn Flour
- 10.2.2. Rice Flour
- 10.2.3. Sweet Potato Flour
- 10.2.4. Quinoa Flour
- 10.2.5. Almond Flour
- 10.2.6. Others
- 10.1. Market Analysis, Insights and Forecast - by Application
- 11. Competitive Analysis
- 11.1. Global Market Share Analysis 2024
- 11.2. Company Profiles
- 11.2.1 ADM
- 11.2.1.1. Overview
- 11.2.1.2. Products
- 11.2.1.3. SWOT Analysis
- 11.2.1.4. Recent Developments
- 11.2.1.5. Financials (Based on Availability)
- 11.2.2 Bunge
- 11.2.2.1. Overview
- 11.2.2.2. Products
- 11.2.2.3. SWOT Analysis
- 11.2.2.4. Recent Developments
- 11.2.2.5. Financials (Based on Availability)
- 11.2.3 Cargill
- 11.2.3.1. Overview
- 11.2.3.2. Products
- 11.2.3.3. SWOT Analysis
- 11.2.3.4. Recent Developments
- 11.2.3.5. Financials (Based on Availability)
- 11.2.4 Louis Dreyfus
- 11.2.4.1. Overview
- 11.2.4.2. Products
- 11.2.4.3. SWOT Analysis
- 11.2.4.4. Recent Developments
- 11.2.4.5. Financials (Based on Availability)
- 11.2.5 COFCO Group
- 11.2.5.1. Overview
- 11.2.5.2. Products
- 11.2.5.3. SWOT Analysis
- 11.2.5.4. Recent Developments
- 11.2.5.5. Financials (Based on Availability)
- 11.2.6 Wilmar International
- 11.2.6.1. Overview
- 11.2.6.2. Products
- 11.2.6.3. SWOT Analysis
- 11.2.6.4. Recent Developments
- 11.2.6.5. Financials (Based on Availability)
- 11.2.7 Jinshahe Group
- 11.2.7.1. Overview
- 11.2.7.2. Products
- 11.2.7.3. SWOT Analysis
- 11.2.7.4. Recent Developments
- 11.2.7.5. Financials (Based on Availability)
- 11.2.8 GoodMills Group
- 11.2.8.1. Overview
- 11.2.8.2. Products
- 11.2.8.3. SWOT Analysis
- 11.2.8.4. Recent Developments
- 11.2.8.5. Financials (Based on Availability)
- 11.2.9 Milne MicroDried
- 11.2.9.1. Overview
- 11.2.9.2. Products
- 11.2.9.3. SWOT Analysis
- 11.2.9.4. Recent Developments
- 11.2.9.5. Financials (Based on Availability)
- 11.2.10 Carolina Innovative Food Ingredients
- 11.2.10.1. Overview
- 11.2.10.2. Products
- 11.2.10.3. SWOT Analysis
- 11.2.10.4. Recent Developments
- 11.2.10.5. Financials (Based on Availability)
- 11.2.11 Liuxu Food
- 11.2.11.1. Overview
- 11.2.11.2. Products
- 11.2.11.3. SWOT Analysis
- 11.2.11.4. Recent Developments
- 11.2.11.5. Financials (Based on Availability)
- 11.2.12 Live Glean
- 11.2.12.1. Overview
- 11.2.12.2. Products
- 11.2.12.3. SWOT Analysis
- 11.2.12.4. Recent Developments
- 11.2.12.5. Financials (Based on Availability)
- 11.2.13 NorQuin
- 11.2.13.1. Overview
- 11.2.13.2. Products
- 11.2.13.3. SWOT Analysis
- 11.2.13.4. Recent Developments
- 11.2.13.5. Financials (Based on Availability)
- 11.2.14 Andean Valley Corporation
- 11.2.14.1. Overview
- 11.2.14.2. Products
- 11.2.14.3. SWOT Analysis
- 11.2.14.4. Recent Developments
- 11.2.14.5. Financials (Based on Availability)
- 11.2.15 Beichun
- 11.2.15.1. Overview
- 11.2.15.2. Products
- 11.2.15.3. SWOT Analysis
- 11.2.15.4. Recent Developments
- 11.2.15.5. Financials (Based on Availability)
- 11.2.1 ADM
List of Figures
- Figure 1: Global Flour Alternatives Revenue Breakdown (million, %) by Region 2024 & 2032
- Figure 2: Global Flour Alternatives Volume Breakdown (K, %) by Region 2024 & 2032
- Figure 3: North America Flour Alternatives Revenue (million), by Application 2024 & 2032
- Figure 4: North America Flour Alternatives Volume (K), by Application 2024 & 2032
- Figure 5: North America Flour Alternatives Revenue Share (%), by Application 2024 & 2032
- Figure 6: North America Flour Alternatives Volume Share (%), by Application 2024 & 2032
- Figure 7: North America Flour Alternatives Revenue (million), by Type 2024 & 2032
- Figure 8: North America Flour Alternatives Volume (K), by Type 2024 & 2032
- Figure 9: North America Flour Alternatives Revenue Share (%), by Type 2024 & 2032
- Figure 10: North America Flour Alternatives Volume Share (%), by Type 2024 & 2032
- Figure 11: North America Flour Alternatives Revenue (million), by Country 2024 & 2032
- Figure 12: North America Flour Alternatives Volume (K), by Country 2024 & 2032
- Figure 13: North America Flour Alternatives Revenue Share (%), by Country 2024 & 2032
- Figure 14: North America Flour Alternatives Volume Share (%), by Country 2024 & 2032
- Figure 15: South America Flour Alternatives Revenue (million), by Application 2024 & 2032
- Figure 16: South America Flour Alternatives Volume (K), by Application 2024 & 2032
- Figure 17: South America Flour Alternatives Revenue Share (%), by Application 2024 & 2032
- Figure 18: South America Flour Alternatives Volume Share (%), by Application 2024 & 2032
- Figure 19: South America Flour Alternatives Revenue (million), by Type 2024 & 2032
- Figure 20: South America Flour Alternatives Volume (K), by Type 2024 & 2032
- Figure 21: South America Flour Alternatives Revenue Share (%), by Type 2024 & 2032
- Figure 22: South America Flour Alternatives Volume Share (%), by Type 2024 & 2032
- Figure 23: South America Flour Alternatives Revenue (million), by Country 2024 & 2032
- Figure 24: South America Flour Alternatives Volume (K), by Country 2024 & 2032
- Figure 25: South America Flour Alternatives Revenue Share (%), by Country 2024 & 2032
- Figure 26: South America Flour Alternatives Volume Share (%), by Country 2024 & 2032
- Figure 27: Europe Flour Alternatives Revenue (million), by Application 2024 & 2032
- Figure 28: Europe Flour Alternatives Volume (K), by Application 2024 & 2032
- Figure 29: Europe Flour Alternatives Revenue Share (%), by Application 2024 & 2032
- Figure 30: Europe Flour Alternatives Volume Share (%), by Application 2024 & 2032
- Figure 31: Europe Flour Alternatives Revenue (million), by Type 2024 & 2032
- Figure 32: Europe Flour Alternatives Volume (K), by Type 2024 & 2032
- Figure 33: Europe Flour Alternatives Revenue Share (%), by Type 2024 & 2032
- Figure 34: Europe Flour Alternatives Volume Share (%), by Type 2024 & 2032
- Figure 35: Europe Flour Alternatives Revenue (million), by Country 2024 & 2032
- Figure 36: Europe Flour Alternatives Volume (K), by Country 2024 & 2032
- Figure 37: Europe Flour Alternatives Revenue Share (%), by Country 2024 & 2032
- Figure 38: Europe Flour Alternatives Volume Share (%), by Country 2024 & 2032
- Figure 39: Middle East & Africa Flour Alternatives Revenue (million), by Application 2024 & 2032
- Figure 40: Middle East & Africa Flour Alternatives Volume (K), by Application 2024 & 2032
- Figure 41: Middle East & Africa Flour Alternatives Revenue Share (%), by Application 2024 & 2032
- Figure 42: Middle East & Africa Flour Alternatives Volume Share (%), by Application 2024 & 2032
- Figure 43: Middle East & Africa Flour Alternatives Revenue (million), by Type 2024 & 2032
- Figure 44: Middle East & Africa Flour Alternatives Volume (K), by Type 2024 & 2032
- Figure 45: Middle East & Africa Flour Alternatives Revenue Share (%), by Type 2024 & 2032
- Figure 46: Middle East & Africa Flour Alternatives Volume Share (%), by Type 2024 & 2032
- Figure 47: Middle East & Africa Flour Alternatives Revenue (million), by Country 2024 & 2032
- Figure 48: Middle East & Africa Flour Alternatives Volume (K), by Country 2024 & 2032
- Figure 49: Middle East & Africa Flour Alternatives Revenue Share (%), by Country 2024 & 2032
- Figure 50: Middle East & Africa Flour Alternatives Volume Share (%), by Country 2024 & 2032
- Figure 51: Asia Pacific Flour Alternatives Revenue (million), by Application 2024 & 2032
- Figure 52: Asia Pacific Flour Alternatives Volume (K), by Application 2024 & 2032
- Figure 53: Asia Pacific Flour Alternatives Revenue Share (%), by Application 2024 & 2032
- Figure 54: Asia Pacific Flour Alternatives Volume Share (%), by Application 2024 & 2032
- Figure 55: Asia Pacific Flour Alternatives Revenue (million), by Type 2024 & 2032
- Figure 56: Asia Pacific Flour Alternatives Volume (K), by Type 2024 & 2032
- Figure 57: Asia Pacific Flour Alternatives Revenue Share (%), by Type 2024 & 2032
- Figure 58: Asia Pacific Flour Alternatives Volume Share (%), by Type 2024 & 2032
- Figure 59: Asia Pacific Flour Alternatives Revenue (million), by Country 2024 & 2032
- Figure 60: Asia Pacific Flour Alternatives Volume (K), by Country 2024 & 2032
- Figure 61: Asia Pacific Flour Alternatives Revenue Share (%), by Country 2024 & 2032
- Figure 62: Asia Pacific Flour Alternatives Volume Share (%), by Country 2024 & 2032
List of Tables
- Table 1: Global Flour Alternatives Revenue million Forecast, by Region 2019 & 2032
- Table 2: Global Flour Alternatives Volume K Forecast, by Region 2019 & 2032
- Table 3: Global Flour Alternatives Revenue million Forecast, by Application 2019 & 2032
- Table 4: Global Flour Alternatives Volume K Forecast, by Application 2019 & 2032
- Table 5: Global Flour Alternatives Revenue million Forecast, by Type 2019 & 2032
- Table 6: Global Flour Alternatives Volume K Forecast, by Type 2019 & 2032
- Table 7: Global Flour Alternatives Revenue million Forecast, by Region 2019 & 2032
- Table 8: Global Flour Alternatives Volume K Forecast, by Region 2019 & 2032
- Table 9: Global Flour Alternatives Revenue million Forecast, by Application 2019 & 2032
- Table 10: Global Flour Alternatives Volume K Forecast, by Application 2019 & 2032
- Table 11: Global Flour Alternatives Revenue million Forecast, by Type 2019 & 2032
- Table 12: Global Flour Alternatives Volume K Forecast, by Type 2019 & 2032
- Table 13: Global Flour Alternatives Revenue million Forecast, by Country 2019 & 2032
- Table 14: Global Flour Alternatives Volume K Forecast, by Country 2019 & 2032
- Table 15: United States Flour Alternatives Revenue (million) Forecast, by Application 2019 & 2032
- Table 16: United States Flour Alternatives Volume (K) Forecast, by Application 2019 & 2032
- Table 17: Canada Flour Alternatives Revenue (million) Forecast, by Application 2019 & 2032
- Table 18: Canada Flour Alternatives Volume (K) Forecast, by Application 2019 & 2032
- Table 19: Mexico Flour Alternatives Revenue (million) Forecast, by Application 2019 & 2032
- Table 20: Mexico Flour Alternatives Volume (K) Forecast, by Application 2019 & 2032
- Table 21: Global Flour Alternatives Revenue million Forecast, by Application 2019 & 2032
- Table 22: Global Flour Alternatives Volume K Forecast, by Application 2019 & 2032
- Table 23: Global Flour Alternatives Revenue million Forecast, by Type 2019 & 2032
- Table 24: Global Flour Alternatives Volume K Forecast, by Type 2019 & 2032
- Table 25: Global Flour Alternatives Revenue million Forecast, by Country 2019 & 2032
- Table 26: Global Flour Alternatives Volume K Forecast, by Country 2019 & 2032
- Table 27: Brazil Flour Alternatives Revenue (million) Forecast, by Application 2019 & 2032
- Table 28: Brazil Flour Alternatives Volume (K) Forecast, by Application 2019 & 2032
- Table 29: Argentina Flour Alternatives Revenue (million) Forecast, by Application 2019 & 2032
- Table 30: Argentina Flour Alternatives Volume (K) Forecast, by Application 2019 & 2032
- Table 31: Rest of South America Flour Alternatives Revenue (million) Forecast, by Application 2019 & 2032
- Table 32: Rest of South America Flour Alternatives Volume (K) Forecast, by Application 2019 & 2032
- Table 33: Global Flour Alternatives Revenue million Forecast, by Application 2019 & 2032
- Table 34: Global Flour Alternatives Volume K Forecast, by Application 2019 & 2032
- Table 35: Global Flour Alternatives Revenue million Forecast, by Type 2019 & 2032
- Table 36: Global Flour Alternatives Volume K Forecast, by Type 2019 & 2032
- Table 37: Global Flour Alternatives Revenue million Forecast, by Country 2019 & 2032
- Table 38: Global Flour Alternatives Volume K Forecast, by Country 2019 & 2032
- Table 39: United Kingdom Flour Alternatives Revenue (million) Forecast, by Application 2019 & 2032
- Table 40: United Kingdom Flour Alternatives Volume (K) Forecast, by Application 2019 & 2032
- Table 41: Germany Flour Alternatives Revenue (million) Forecast, by Application 2019 & 2032
- Table 42: Germany Flour Alternatives Volume (K) Forecast, by Application 2019 & 2032
- Table 43: France Flour Alternatives Revenue (million) Forecast, by Application 2019 & 2032
- Table 44: France Flour Alternatives Volume (K) Forecast, by Application 2019 & 2032
- Table 45: Italy Flour Alternatives Revenue (million) Forecast, by Application 2019 & 2032
- Table 46: Italy Flour Alternatives Volume (K) Forecast, by Application 2019 & 2032
- Table 47: Spain Flour Alternatives Revenue (million) Forecast, by Application 2019 & 2032
- Table 48: Spain Flour Alternatives Volume (K) Forecast, by Application 2019 & 2032
- Table 49: Russia Flour Alternatives Revenue (million) Forecast, by Application 2019 & 2032
- Table 50: Russia Flour Alternatives Volume (K) Forecast, by Application 2019 & 2032
- Table 51: Benelux Flour Alternatives Revenue (million) Forecast, by Application 2019 & 2032
- Table 52: Benelux Flour Alternatives Volume (K) Forecast, by Application 2019 & 2032
- Table 53: Nordics Flour Alternatives Revenue (million) Forecast, by Application 2019 & 2032
- Table 54: Nordics Flour Alternatives Volume (K) Forecast, by Application 2019 & 2032
- Table 55: Rest of Europe Flour Alternatives Revenue (million) Forecast, by Application 2019 & 2032
- Table 56: Rest of Europe Flour Alternatives Volume (K) Forecast, by Application 2019 & 2032
- Table 57: Global Flour Alternatives Revenue million Forecast, by Application 2019 & 2032
- Table 58: Global Flour Alternatives Volume K Forecast, by Application 2019 & 2032
- Table 59: Global Flour Alternatives Revenue million Forecast, by Type 2019 & 2032
- Table 60: Global Flour Alternatives Volume K Forecast, by Type 2019 & 2032
- Table 61: Global Flour Alternatives Revenue million Forecast, by Country 2019 & 2032
- Table 62: Global Flour Alternatives Volume K Forecast, by Country 2019 & 2032
- Table 63: Turkey Flour Alternatives Revenue (million) Forecast, by Application 2019 & 2032
- Table 64: Turkey Flour Alternatives Volume (K) Forecast, by Application 2019 & 2032
- Table 65: Israel Flour Alternatives Revenue (million) Forecast, by Application 2019 & 2032
- Table 66: Israel Flour Alternatives Volume (K) Forecast, by Application 2019 & 2032
- Table 67: GCC Flour Alternatives Revenue (million) Forecast, by Application 2019 & 2032
- Table 68: GCC Flour Alternatives Volume (K) Forecast, by Application 2019 & 2032
- Table 69: North Africa Flour Alternatives Revenue (million) Forecast, by Application 2019 & 2032
- Table 70: North Africa Flour Alternatives Volume (K) Forecast, by Application 2019 & 2032
- Table 71: South Africa Flour Alternatives Revenue (million) Forecast, by Application 2019 & 2032
- Table 72: South Africa Flour Alternatives Volume (K) Forecast, by Application 2019 & 2032
- Table 73: Rest of Middle East & Africa Flour Alternatives Revenue (million) Forecast, by Application 2019 & 2032
- Table 74: Rest of Middle East & Africa Flour Alternatives Volume (K) Forecast, by Application 2019 & 2032
- Table 75: Global Flour Alternatives Revenue million Forecast, by Application 2019 & 2032
- Table 76: Global Flour Alternatives Volume K Forecast, by Application 2019 & 2032
- Table 77: Global Flour Alternatives Revenue million Forecast, by Type 2019 & 2032
- Table 78: Global Flour Alternatives Volume K Forecast, by Type 2019 & 2032
- Table 79: Global Flour Alternatives Revenue million Forecast, by Country 2019 & 2032
- Table 80: Global Flour Alternatives Volume K Forecast, by Country 2019 & 2032
- Table 81: China Flour Alternatives Revenue (million) Forecast, by Application 2019 & 2032
- Table 82: China Flour Alternatives Volume (K) Forecast, by Application 2019 & 2032
- Table 83: India Flour Alternatives Revenue (million) Forecast, by Application 2019 & 2032
- Table 84: India Flour Alternatives Volume (K) Forecast, by Application 2019 & 2032
- Table 85: Japan Flour Alternatives Revenue (million) Forecast, by Application 2019 & 2032
- Table 86: Japan Flour Alternatives Volume (K) Forecast, by Application 2019 & 2032
- Table 87: South Korea Flour Alternatives Revenue (million) Forecast, by Application 2019 & 2032
- Table 88: South Korea Flour Alternatives Volume (K) Forecast, by Application 2019 & 2032
- Table 89: ASEAN Flour Alternatives Revenue (million) Forecast, by Application 2019 & 2032
- Table 90: ASEAN Flour Alternatives Volume (K) Forecast, by Application 2019 & 2032
- Table 91: Oceania Flour Alternatives Revenue (million) Forecast, by Application 2019 & 2032
- Table 92: Oceania Flour Alternatives Volume (K) Forecast, by Application 2019 & 2032
- Table 93: Rest of Asia Pacific Flour Alternatives Revenue (million) Forecast, by Application 2019 & 2032
- Table 94: Rest of Asia Pacific Flour Alternatives Volume (K) Forecast, by Application 2019 & 2032
Frequently Asked Questions
1. What is the projected Compound Annual Growth Rate (CAGR) of the Flour Alternatives?
The projected CAGR is approximately XXX%.
2. Which companies are prominent players in the Flour Alternatives?
Key companies in the market include ADM, Bunge, Cargill, Louis Dreyfus, COFCO Group, Wilmar International, Jinshahe Group, GoodMills Group, Milne MicroDried, Carolina Innovative Food Ingredients, Liuxu Food, Live Glean, NorQuin, Andean Valley Corporation, Beichun.
3. What are the main segments of the Flour Alternatives?
The market segments include Application, Type.
4. Can you provide details about the market size?
The market size is estimated to be USD XXX million as of 2022.
5. What are some drivers contributing to market growth?
N/A
6. What are the notable trends driving market growth?
N/A
7. Are there any restraints impacting market growth?
N/A
8. Can you provide examples of recent developments in the market?
N/A
9. What pricing options are available for accessing the report?
Pricing options include single-user, multi-user, and enterprise licenses priced at USD 3950.00, USD 5925.00, and USD 7900.00 respectively.
10. Is the market size provided in terms of value or volume?
The market size is provided in terms of value, measured in million and volume, measured in K.
11. Are there any specific market keywords associated with the report?
Yes, the market keyword associated with the report is "Flour Alternatives," which aids in identifying and referencing the specific market segment covered.
12. How do I determine which pricing option suits my needs best?
The pricing options vary based on user requirements and access needs. Individual users may opt for single-user licenses, while businesses requiring broader access may choose multi-user or enterprise licenses for cost-effective access to the report.
13. Are there any additional resources or data provided in the Flour Alternatives report?
While the report offers comprehensive insights, it's advisable to review the specific contents or supplementary materials provided to ascertain if additional resources or data are available.
14. How can I stay updated on further developments or reports in the Flour Alternatives?
To stay informed about further developments, trends, and reports in the Flour Alternatives, consider subscribing to industry newsletters, following relevant companies and organizations, or regularly checking reputable industry news sources and publications.
Methodology
Step 1 - Identification of Relevant Samples Size from Population Database


Step 2 - Approaches for Defining Global Market Size (Value, Volume* & Price*)

Note*: In applicable scenarios
Step 3 - Data Sources
Primary Research
- Web Analytics
- Survey Reports
- Research Institute
- Latest Research Reports
- Opinion Leaders
Secondary Research
- Annual Reports
- White Paper
- Latest Press Release
- Industry Association
- Paid Database
- Investor Presentations

Step 4 - Data Triangulation
Involves using different sources of information in order to increase the validity of a study
These sources are likely to be stakeholders in a program - participants, other researchers, program staff, other community members, and so on.
Then we put all data in single framework & apply various statistical tools to find out the dynamic on the market.
During the analysis stage, feedback from the stakeholder groups would be compared to determine areas of agreement as well as areas of divergence


