
Key Insights
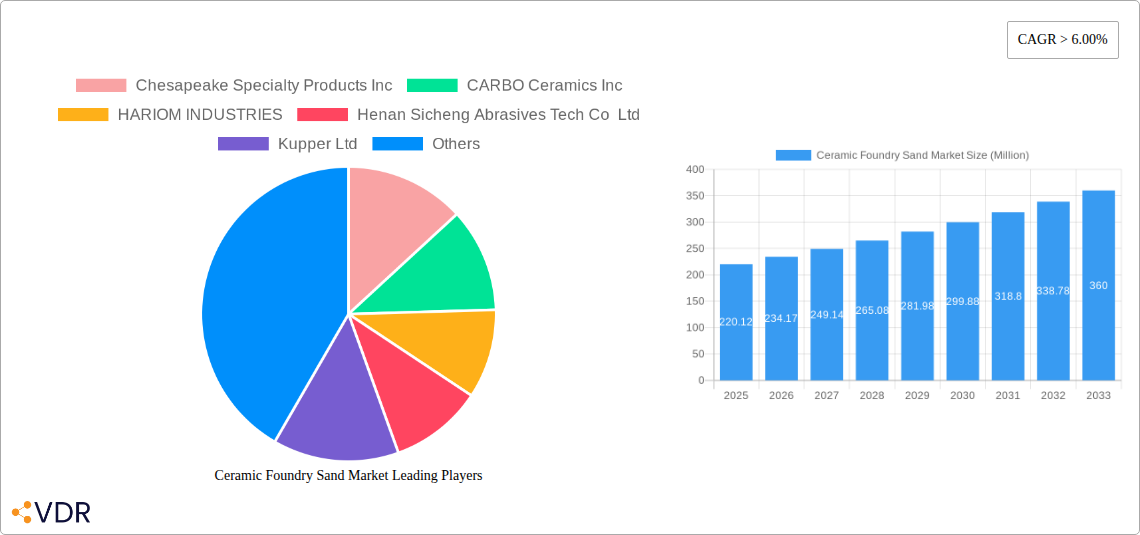
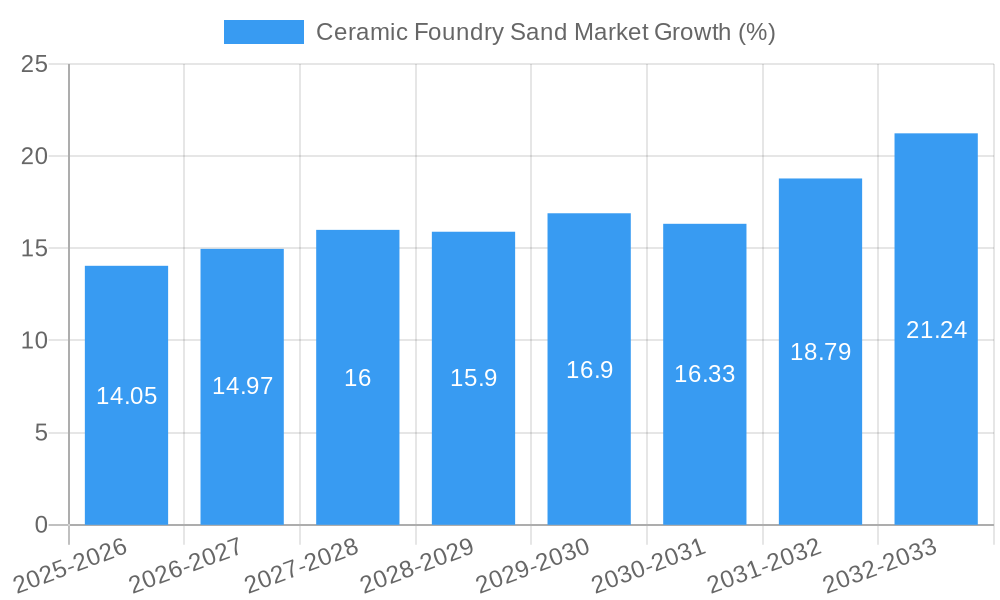
The global Ceramic Foundry Sand market is experiencing robust growth, projected to reach $220.12 million in 2025 and maintain a Compound Annual Growth Rate (CAGR) exceeding 6% from 2025 to 2033. This expansion is driven by several key factors. Firstly, the increasing demand for high-quality castings in various industries, including automotive, aerospace, and machinery manufacturing, fuels the need for superior foundry sand solutions. Ceramic foundry sand offers enhanced properties compared to traditional silica sand, such as improved thermal stability, higher strength, and better dimensional accuracy in castings. This leads to increased efficiency and reduced defects in the manufacturing process, making it a cost-effective choice in the long run. Secondly, the growing adoption of advanced casting techniques, like investment casting and lost-foam casting, further contributes to the market's growth. These methods often benefit from the unique characteristics of ceramic foundry sand. Finally, stringent environmental regulations concerning silica dust emissions are pushing the adoption of safer alternatives like ceramic sand, providing a significant impetus for market expansion.
However, the market faces certain challenges. The relatively higher cost of ceramic foundry sand compared to traditional silica sand could hinder wider adoption, particularly among smaller foundries with tighter budgets. Furthermore, the availability of raw materials and the technological complexities associated with ceramic sand production can impact supply chains and potentially limit market growth. Nevertheless, continuous innovation in material science and manufacturing processes are expected to address these challenges and unlock further market potential. The market segmentation reveals significant opportunities within specific industrial applications and geographical regions. Further research into these segments can refine market forecasts and pinpoint optimal investment strategies. Companies like Chesapeake Specialty Products Inc, CARBO Ceramics Inc, and others listed are key players shaping this dynamic market. Their innovative products and strategies will significantly influence the market landscape in the coming years.
Ceramic Foundry Sand Market: A Comprehensive Market Report (2019-2033)
This in-depth report provides a comprehensive analysis of the Ceramic Foundry Sand Market, encompassing market dynamics, growth trends, regional landscapes, product innovations, key players, and future outlook. The study covers the historical period (2019-2024), base year (2025), and forecast period (2025-2033), offering invaluable insights for industry professionals, investors, and strategic decision-makers. The parent market is the Foundry Sand Market and the child market is Ceramic Foundry Sand Market.
Ceramic Foundry Sand Market Market Dynamics & Structure
This section analyzes the competitive landscape of the Ceramic Foundry Sand Market, examining market concentration, technological innovation, regulatory influences, and market trends. We delve into the dynamics shaping the market, including mergers and acquisitions (M&A) activities. The report quantifies market share held by key players and explores qualitative factors influencing innovation and growth. The global market size in 2025 is estimated at xx Million.
- Market Concentration: The market exhibits a moderately concentrated structure, with the top five players holding approximately xx% of the market share in 2025.
- Technological Innovation: Continuous innovation in ceramic materials and manufacturing processes drives market growth. However, high R&D costs and the need for specialized expertise present significant barriers to entry.
- Regulatory Framework: Environmental regulations concerning emissions and waste disposal significantly impact the industry. Compliance costs influence pricing and competitiveness.
- Competitive Product Substitutes: Alternative foundry sands, such as synthetic sands, pose a competitive threat to ceramic foundry sand.
- End-User Demographics: The automotive, machinery, and construction industries are the primary end-users, driving demand for high-performance ceramic foundry sand.
- M&A Trends: The past five years have witnessed xx M&A deals in the ceramic foundry sand sector, primarily driven by strategic expansion and technology acquisition.
Ceramic Foundry Sand Market Growth Trends & Insights
This section presents a detailed analysis of the Ceramic Foundry Sand Market's growth trajectory, leveraging extensive data and market research. It explores market size evolution, adoption rates, technological disruptions, and shifts in consumer behavior within the forecast period. The report provides insights into factors influencing market expansion.
The market is projected to experience a Compound Annual Growth Rate (CAGR) of xx% during the forecast period (2025-2033), driven by increasing demand from the automotive and construction sectors and advancements in ceramic material technology. Market penetration is expected to reach xx% by 2033. Technological disruptions, such as the adoption of advanced manufacturing techniques and the development of high-performance ceramic sands, are significantly contributing to market growth. Consumer behavior shifts, including a greater emphasis on sustainability and environmentally friendly materials, also influence market trends.
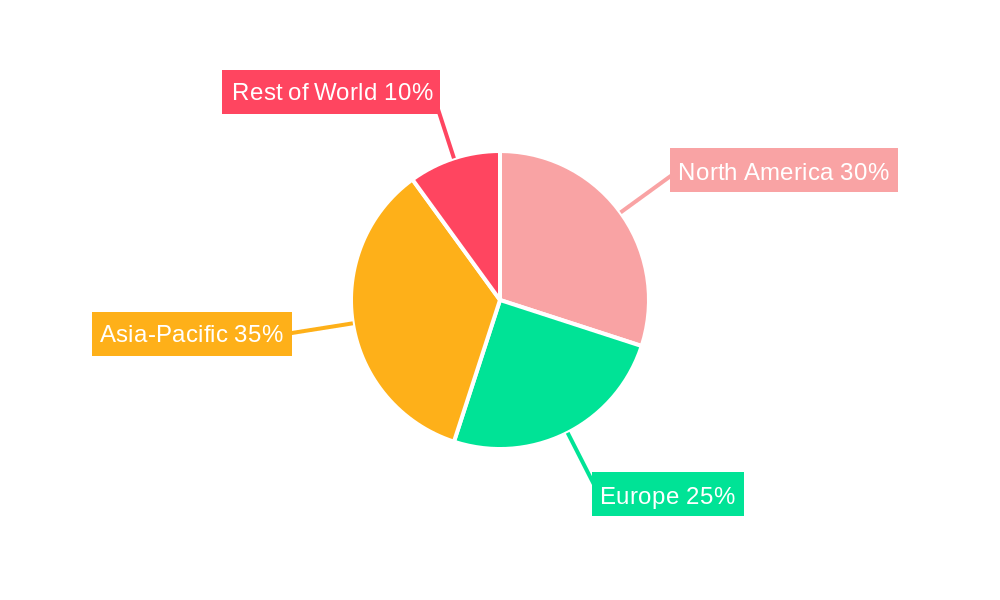
Dominant Regions, Countries, or Segments in Ceramic Foundry Sand Market
This section identifies the leading regions, countries, and segments driving market growth. Key factors contributing to the dominance of specific regions are analyzed. The report provides insights into regional market shares and growth potential.
- Asia-Pacific: This region is expected to dominate the market, driven by rapid industrialization, particularly in countries like China and India. Strong economic growth and significant investments in infrastructure projects significantly enhance demand.
- North America: North America holds a substantial market share, driven by a robust automotive industry and increasing demand for high-quality castings. Stringent environmental regulations also influence market growth.
- Europe: The European market is characterized by relatively mature industries and strict environmental standards. Technological advancements and a focus on sustainable manufacturing practices drive regional growth.
Ceramic Foundry Sand Market Product Landscape
The ceramic foundry sand market offers a variety of products tailored to diverse applications. Innovations focus on enhancing the performance characteristics of the sand, such as improving thermal stability, reducing emissions, and enhancing casting quality. Unique selling propositions frequently involve superior moldability, strength, and durability.
Key Drivers, Barriers & Challenges in Ceramic Foundry Sand Market
Key Drivers:
- Increasing demand from the automotive and construction industries.
- Technological advancements leading to higher-performance ceramic foundry sands.
- Stringent environmental regulations driving the adoption of eco-friendly solutions.
Challenges:
- Fluctuations in raw material prices.
- Intense competition from alternative foundry sand materials (xx% market share in 2025).
- Stringent environmental regulations increase compliance costs.
Emerging Opportunities in Ceramic Foundry Sand Market
- Growing demand for lightweight and high-strength castings in various industries.
- Development of specialized ceramic foundry sands for niche applications.
- Expansion into emerging markets with high growth potential.
Growth Accelerators in the Ceramic Foundry Sand Market Industry
Technological breakthroughs in ceramic material science, strategic partnerships between manufacturers and end-users, and successful market expansion strategies in developing economies are significant drivers of long-term growth.
Key Players Shaping the Ceramic Foundry Sand Market Market
- Chesapeake Specialty Products Inc
- CARBO Ceramics Inc
- HARIOM INDUSTRIES
- Henan Sicheng Abrasives Tech Co Ltd
- Kupper Ltd
- Kailin Foundry
- Qingdao Duoyuan New Materials Co Ltd
- Samarth Metallurgicals
- Hebei Shenghuo New Material Technology Co Ltd (SHXK)
- ZHENGZHOU HAIXU ABRASIVES CO LTD *List Not Exhaustive
Notable Milestones in Ceramic Foundry Sand Market Sector
- 2022: Launch of a new high-performance ceramic foundry sand by [Company Name].
- 2023: Acquisition of [Company A] by [Company B], expanding market reach.
- 2024: Introduction of a sustainable, eco-friendly ceramic foundry sand by [Company Name]. (Further milestones will be detailed in the complete report)
In-Depth Ceramic Foundry Sand Market Market Outlook
The Ceramic Foundry Sand Market is poised for significant growth in the coming years, driven by robust demand from key industries and continuous innovation. Strategic partnerships, investments in R&D, and expansion into new markets will be crucial for future success. The market presents significant opportunities for companies that can offer high-performance, sustainable, and cost-effective solutions.
Ceramic Foundry Sand Market Segmentation
-
1. Application
- 1.1. Resin Coated Sand
- 1.2. Cold Box Casting
- 1.3. Low Foam Casting
- 1.4. Facing Sand
- 1.5. Other Applications
Ceramic Foundry Sand Market Segmentation By Geography
-
1. Asia Pacific
- 1.1. China
- 1.2. India
- 1.3. Japan
- 1.4. South Korea
- 1.5. Indonesia
- 1.6. Malaysia
- 1.7. Thailand
- 1.8. Vietnam
- 1.9. Rest of Asia Pacific
-
2. North America
- 2.1. United States
- 2.2. Canada
- 2.3. Mexico
-
3. Europe
- 3.1. Germany
- 3.2. United Kingdom
- 3.3. Italy
- 3.4. France
- 3.5. Spain
- 3.6. Russia
- 3.7. NORDIC Countries
- 3.8. Turkey
- 3.9. Rest of Europe
-
4. South America
- 4.1. Brazil
- 4.2. Argentina
- 4.3. Colombia
- 4.4. Rest of South America
-
5. Middle East and Africa
- 5.1. Saudi Arabia
- 5.2. South Africa
- 5.3. Qatar
- 5.4. UAE
- 5.5. Egypt
- 5.6. Rest of Middle East and Africa
Ceramic Foundry Sand Market REPORT HIGHLIGHTS
| Aspects | Details |
|---|---|
| Study Period | 2019-2033 |
| Base Year | 2024 |
| Estimated Year | 2025 |
| Forecast Period | 2025-2033 |
| Historical Period | 2019-2024 |
| Growth Rate | CAGR of > 6.00% from 2019-2033 |
| Segmentation |
|
Table of Contents
- 1. Introduction
- 1.1. Research Scope
- 1.2. Market Segmentation
- 1.3. Research Methodology
- 1.4. Definitions and Assumptions
- 2. Executive Summary
- 2.1. Introduction
- 3. Market Dynamics
- 3.1. Introduction
- 3.2. Market Drivers
- 3.2.1. Increasing Demand from the Foundry Industry; Growing Demand from the Metal Casting Industry; Other Drivers
- 3.3. Market Restrains
- 3.3.1. Increasing Demand from the Foundry Industry; Growing Demand from the Metal Casting Industry; Other Drivers
- 3.4. Market Trends
- 3.4.1. Resin Coated Sand to Dominate the Market
- 4. Market Factor Analysis
- 4.1. Porters Five Forces
- 4.2. Supply/Value Chain
- 4.3. PESTEL analysis
- 4.4. Market Entropy
- 4.5. Patent/Trademark Analysis
- 5. Global Ceramic Foundry Sand Market Analysis, Insights and Forecast, 2019-2031
- 5.1. Market Analysis, Insights and Forecast - by Application
- 5.1.1. Resin Coated Sand
- 5.1.2. Cold Box Casting
- 5.1.3. Low Foam Casting
- 5.1.4. Facing Sand
- 5.1.5. Other Applications
- 5.2. Market Analysis, Insights and Forecast - by Region
- 5.2.1. Asia Pacific
- 5.2.2. North America
- 5.2.3. Europe
- 5.2.4. South America
- 5.2.5. Middle East and Africa
- 5.1. Market Analysis, Insights and Forecast - by Application
- 6. Asia Pacific Ceramic Foundry Sand Market Analysis, Insights and Forecast, 2019-2031
- 6.1. Market Analysis, Insights and Forecast - by Application
- 6.1.1. Resin Coated Sand
- 6.1.2. Cold Box Casting
- 6.1.3. Low Foam Casting
- 6.1.4. Facing Sand
- 6.1.5. Other Applications
- 6.1. Market Analysis, Insights and Forecast - by Application
- 7. North America Ceramic Foundry Sand Market Analysis, Insights and Forecast, 2019-2031
- 7.1. Market Analysis, Insights and Forecast - by Application
- 7.1.1. Resin Coated Sand
- 7.1.2. Cold Box Casting
- 7.1.3. Low Foam Casting
- 7.1.4. Facing Sand
- 7.1.5. Other Applications
- 7.1. Market Analysis, Insights and Forecast - by Application
- 8. Europe Ceramic Foundry Sand Market Analysis, Insights and Forecast, 2019-2031
- 8.1. Market Analysis, Insights and Forecast - by Application
- 8.1.1. Resin Coated Sand
- 8.1.2. Cold Box Casting
- 8.1.3. Low Foam Casting
- 8.1.4. Facing Sand
- 8.1.5. Other Applications
- 8.1. Market Analysis, Insights and Forecast - by Application
- 9. South America Ceramic Foundry Sand Market Analysis, Insights and Forecast, 2019-2031
- 9.1. Market Analysis, Insights and Forecast - by Application
- 9.1.1. Resin Coated Sand
- 9.1.2. Cold Box Casting
- 9.1.3. Low Foam Casting
- 9.1.4. Facing Sand
- 9.1.5. Other Applications
- 9.1. Market Analysis, Insights and Forecast - by Application
- 10. Middle East and Africa Ceramic Foundry Sand Market Analysis, Insights and Forecast, 2019-2031
- 10.1. Market Analysis, Insights and Forecast - by Application
- 10.1.1. Resin Coated Sand
- 10.1.2. Cold Box Casting
- 10.1.3. Low Foam Casting
- 10.1.4. Facing Sand
- 10.1.5. Other Applications
- 10.1. Market Analysis, Insights and Forecast - by Application
- 11. Competitive Analysis
- 11.1. Global Market Share Analysis 2024
- 11.2. Company Profiles
- 11.2.1 Chesapeake Specialty Products Inc
- 11.2.1.1. Overview
- 11.2.1.2. Products
- 11.2.1.3. SWOT Analysis
- 11.2.1.4. Recent Developments
- 11.2.1.5. Financials (Based on Availability)
- 11.2.2 CARBO Ceramics Inc
- 11.2.2.1. Overview
- 11.2.2.2. Products
- 11.2.2.3. SWOT Analysis
- 11.2.2.4. Recent Developments
- 11.2.2.5. Financials (Based on Availability)
- 11.2.3 HARIOM INDUSTRIES
- 11.2.3.1. Overview
- 11.2.3.2. Products
- 11.2.3.3. SWOT Analysis
- 11.2.3.4. Recent Developments
- 11.2.3.5. Financials (Based on Availability)
- 11.2.4 Henan Sicheng Abrasives Tech Co Ltd
- 11.2.4.1. Overview
- 11.2.4.2. Products
- 11.2.4.3. SWOT Analysis
- 11.2.4.4. Recent Developments
- 11.2.4.5. Financials (Based on Availability)
- 11.2.5 Kupper Ltd
- 11.2.5.1. Overview
- 11.2.5.2. Products
- 11.2.5.3. SWOT Analysis
- 11.2.5.4. Recent Developments
- 11.2.5.5. Financials (Based on Availability)
- 11.2.6 Kailin Foundry
- 11.2.6.1. Overview
- 11.2.6.2. Products
- 11.2.6.3. SWOT Analysis
- 11.2.6.4. Recent Developments
- 11.2.6.5. Financials (Based on Availability)
- 11.2.7 Qingdao Duoyuan New Materials Co Ltd
- 11.2.7.1. Overview
- 11.2.7.2. Products
- 11.2.7.3. SWOT Analysis
- 11.2.7.4. Recent Developments
- 11.2.7.5. Financials (Based on Availability)
- 11.2.8 Samarth Metallurgicals
- 11.2.8.1. Overview
- 11.2.8.2. Products
- 11.2.8.3. SWOT Analysis
- 11.2.8.4. Recent Developments
- 11.2.8.5. Financials (Based on Availability)
- 11.2.9 Hebei Shenghuo New Material Technology Co Ltd (SHXK)
- 11.2.9.1. Overview
- 11.2.9.2. Products
- 11.2.9.3. SWOT Analysis
- 11.2.9.4. Recent Developments
- 11.2.9.5. Financials (Based on Availability)
- 11.2.10 ZHENGZHOU HAIXU ABRASIVES CO LTD*List Not Exhaustive
- 11.2.10.1. Overview
- 11.2.10.2. Products
- 11.2.10.3. SWOT Analysis
- 11.2.10.4. Recent Developments
- 11.2.10.5. Financials (Based on Availability)
- 11.2.1 Chesapeake Specialty Products Inc
List of Figures
- Figure 1: Global Ceramic Foundry Sand Market Revenue Breakdown (Million, %) by Region 2024 & 2032
- Figure 2: Global Ceramic Foundry Sand Market Volume Breakdown (Million, %) by Region 2024 & 2032
- Figure 3: Asia Pacific Ceramic Foundry Sand Market Revenue (Million), by Application 2024 & 2032
- Figure 4: Asia Pacific Ceramic Foundry Sand Market Volume (Million), by Application 2024 & 2032
- Figure 5: Asia Pacific Ceramic Foundry Sand Market Revenue Share (%), by Application 2024 & 2032
- Figure 6: Asia Pacific Ceramic Foundry Sand Market Volume Share (%), by Application 2024 & 2032
- Figure 7: Asia Pacific Ceramic Foundry Sand Market Revenue (Million), by Country 2024 & 2032
- Figure 8: Asia Pacific Ceramic Foundry Sand Market Volume (Million), by Country 2024 & 2032
- Figure 9: Asia Pacific Ceramic Foundry Sand Market Revenue Share (%), by Country 2024 & 2032
- Figure 10: Asia Pacific Ceramic Foundry Sand Market Volume Share (%), by Country 2024 & 2032
- Figure 11: North America Ceramic Foundry Sand Market Revenue (Million), by Application 2024 & 2032
- Figure 12: North America Ceramic Foundry Sand Market Volume (Million), by Application 2024 & 2032
- Figure 13: North America Ceramic Foundry Sand Market Revenue Share (%), by Application 2024 & 2032
- Figure 14: North America Ceramic Foundry Sand Market Volume Share (%), by Application 2024 & 2032
- Figure 15: North America Ceramic Foundry Sand Market Revenue (Million), by Country 2024 & 2032
- Figure 16: North America Ceramic Foundry Sand Market Volume (Million), by Country 2024 & 2032
- Figure 17: North America Ceramic Foundry Sand Market Revenue Share (%), by Country 2024 & 2032
- Figure 18: North America Ceramic Foundry Sand Market Volume Share (%), by Country 2024 & 2032
- Figure 19: Europe Ceramic Foundry Sand Market Revenue (Million), by Application 2024 & 2032
- Figure 20: Europe Ceramic Foundry Sand Market Volume (Million), by Application 2024 & 2032
- Figure 21: Europe Ceramic Foundry Sand Market Revenue Share (%), by Application 2024 & 2032
- Figure 22: Europe Ceramic Foundry Sand Market Volume Share (%), by Application 2024 & 2032
- Figure 23: Europe Ceramic Foundry Sand Market Revenue (Million), by Country 2024 & 2032
- Figure 24: Europe Ceramic Foundry Sand Market Volume (Million), by Country 2024 & 2032
- Figure 25: Europe Ceramic Foundry Sand Market Revenue Share (%), by Country 2024 & 2032
- Figure 26: Europe Ceramic Foundry Sand Market Volume Share (%), by Country 2024 & 2032
- Figure 27: South America Ceramic Foundry Sand Market Revenue (Million), by Application 2024 & 2032
- Figure 28: South America Ceramic Foundry Sand Market Volume (Million), by Application 2024 & 2032
- Figure 29: South America Ceramic Foundry Sand Market Revenue Share (%), by Application 2024 & 2032
- Figure 30: South America Ceramic Foundry Sand Market Volume Share (%), by Application 2024 & 2032
- Figure 31: South America Ceramic Foundry Sand Market Revenue (Million), by Country 2024 & 2032
- Figure 32: South America Ceramic Foundry Sand Market Volume (Million), by Country 2024 & 2032
- Figure 33: South America Ceramic Foundry Sand Market Revenue Share (%), by Country 2024 & 2032
- Figure 34: South America Ceramic Foundry Sand Market Volume Share (%), by Country 2024 & 2032
- Figure 35: Middle East and Africa Ceramic Foundry Sand Market Revenue (Million), by Application 2024 & 2032
- Figure 36: Middle East and Africa Ceramic Foundry Sand Market Volume (Million), by Application 2024 & 2032
- Figure 37: Middle East and Africa Ceramic Foundry Sand Market Revenue Share (%), by Application 2024 & 2032
- Figure 38: Middle East and Africa Ceramic Foundry Sand Market Volume Share (%), by Application 2024 & 2032
- Figure 39: Middle East and Africa Ceramic Foundry Sand Market Revenue (Million), by Country 2024 & 2032
- Figure 40: Middle East and Africa Ceramic Foundry Sand Market Volume (Million), by Country 2024 & 2032
- Figure 41: Middle East and Africa Ceramic Foundry Sand Market Revenue Share (%), by Country 2024 & 2032
- Figure 42: Middle East and Africa Ceramic Foundry Sand Market Volume Share (%), by Country 2024 & 2032
List of Tables
- Table 1: Global Ceramic Foundry Sand Market Revenue Million Forecast, by Region 2019 & 2032
- Table 2: Global Ceramic Foundry Sand Market Volume Million Forecast, by Region 2019 & 2032
- Table 3: Global Ceramic Foundry Sand Market Revenue Million Forecast, by Application 2019 & 2032
- Table 4: Global Ceramic Foundry Sand Market Volume Million Forecast, by Application 2019 & 2032
- Table 5: Global Ceramic Foundry Sand Market Revenue Million Forecast, by Region 2019 & 2032
- Table 6: Global Ceramic Foundry Sand Market Volume Million Forecast, by Region 2019 & 2032
- Table 7: Global Ceramic Foundry Sand Market Revenue Million Forecast, by Application 2019 & 2032
- Table 8: Global Ceramic Foundry Sand Market Volume Million Forecast, by Application 2019 & 2032
- Table 9: Global Ceramic Foundry Sand Market Revenue Million Forecast, by Country 2019 & 2032
- Table 10: Global Ceramic Foundry Sand Market Volume Million Forecast, by Country 2019 & 2032
- Table 11: China Ceramic Foundry Sand Market Revenue (Million) Forecast, by Application 2019 & 2032
- Table 12: China Ceramic Foundry Sand Market Volume (Million) Forecast, by Application 2019 & 2032
- Table 13: India Ceramic Foundry Sand Market Revenue (Million) Forecast, by Application 2019 & 2032
- Table 14: India Ceramic Foundry Sand Market Volume (Million) Forecast, by Application 2019 & 2032
- Table 15: Japan Ceramic Foundry Sand Market Revenue (Million) Forecast, by Application 2019 & 2032
- Table 16: Japan Ceramic Foundry Sand Market Volume (Million) Forecast, by Application 2019 & 2032
- Table 17: South Korea Ceramic Foundry Sand Market Revenue (Million) Forecast, by Application 2019 & 2032
- Table 18: South Korea Ceramic Foundry Sand Market Volume (Million) Forecast, by Application 2019 & 2032
- Table 19: Indonesia Ceramic Foundry Sand Market Revenue (Million) Forecast, by Application 2019 & 2032
- Table 20: Indonesia Ceramic Foundry Sand Market Volume (Million) Forecast, by Application 2019 & 2032
- Table 21: Malaysia Ceramic Foundry Sand Market Revenue (Million) Forecast, by Application 2019 & 2032
- Table 22: Malaysia Ceramic Foundry Sand Market Volume (Million) Forecast, by Application 2019 & 2032
- Table 23: Thailand Ceramic Foundry Sand Market Revenue (Million) Forecast, by Application 2019 & 2032
- Table 24: Thailand Ceramic Foundry Sand Market Volume (Million) Forecast, by Application 2019 & 2032
- Table 25: Vietnam Ceramic Foundry Sand Market Revenue (Million) Forecast, by Application 2019 & 2032
- Table 26: Vietnam Ceramic Foundry Sand Market Volume (Million) Forecast, by Application 2019 & 2032
- Table 27: Rest of Asia Pacific Ceramic Foundry Sand Market Revenue (Million) Forecast, by Application 2019 & 2032
- Table 28: Rest of Asia Pacific Ceramic Foundry Sand Market Volume (Million) Forecast, by Application 2019 & 2032
- Table 29: Global Ceramic Foundry Sand Market Revenue Million Forecast, by Application 2019 & 2032
- Table 30: Global Ceramic Foundry Sand Market Volume Million Forecast, by Application 2019 & 2032
- Table 31: Global Ceramic Foundry Sand Market Revenue Million Forecast, by Country 2019 & 2032
- Table 32: Global Ceramic Foundry Sand Market Volume Million Forecast, by Country 2019 & 2032
- Table 33: United States Ceramic Foundry Sand Market Revenue (Million) Forecast, by Application 2019 & 2032
- Table 34: United States Ceramic Foundry Sand Market Volume (Million) Forecast, by Application 2019 & 2032
- Table 35: Canada Ceramic Foundry Sand Market Revenue (Million) Forecast, by Application 2019 & 2032
- Table 36: Canada Ceramic Foundry Sand Market Volume (Million) Forecast, by Application 2019 & 2032
- Table 37: Mexico Ceramic Foundry Sand Market Revenue (Million) Forecast, by Application 2019 & 2032
- Table 38: Mexico Ceramic Foundry Sand Market Volume (Million) Forecast, by Application 2019 & 2032
- Table 39: Global Ceramic Foundry Sand Market Revenue Million Forecast, by Application 2019 & 2032
- Table 40: Global Ceramic Foundry Sand Market Volume Million Forecast, by Application 2019 & 2032
- Table 41: Global Ceramic Foundry Sand Market Revenue Million Forecast, by Country 2019 & 2032
- Table 42: Global Ceramic Foundry Sand Market Volume Million Forecast, by Country 2019 & 2032
- Table 43: Germany Ceramic Foundry Sand Market Revenue (Million) Forecast, by Application 2019 & 2032
- Table 44: Germany Ceramic Foundry Sand Market Volume (Million) Forecast, by Application 2019 & 2032
- Table 45: United Kingdom Ceramic Foundry Sand Market Revenue (Million) Forecast, by Application 2019 & 2032
- Table 46: United Kingdom Ceramic Foundry Sand Market Volume (Million) Forecast, by Application 2019 & 2032
- Table 47: Italy Ceramic Foundry Sand Market Revenue (Million) Forecast, by Application 2019 & 2032
- Table 48: Italy Ceramic Foundry Sand Market Volume (Million) Forecast, by Application 2019 & 2032
- Table 49: France Ceramic Foundry Sand Market Revenue (Million) Forecast, by Application 2019 & 2032
- Table 50: France Ceramic Foundry Sand Market Volume (Million) Forecast, by Application 2019 & 2032
- Table 51: Spain Ceramic Foundry Sand Market Revenue (Million) Forecast, by Application 2019 & 2032
- Table 52: Spain Ceramic Foundry Sand Market Volume (Million) Forecast, by Application 2019 & 2032
- Table 53: Russia Ceramic Foundry Sand Market Revenue (Million) Forecast, by Application 2019 & 2032
- Table 54: Russia Ceramic Foundry Sand Market Volume (Million) Forecast, by Application 2019 & 2032
- Table 55: NORDIC Countries Ceramic Foundry Sand Market Revenue (Million) Forecast, by Application 2019 & 2032
- Table 56: NORDIC Countries Ceramic Foundry Sand Market Volume (Million) Forecast, by Application 2019 & 2032
- Table 57: Turkey Ceramic Foundry Sand Market Revenue (Million) Forecast, by Application 2019 & 2032
- Table 58: Turkey Ceramic Foundry Sand Market Volume (Million) Forecast, by Application 2019 & 2032
- Table 59: Rest of Europe Ceramic Foundry Sand Market Revenue (Million) Forecast, by Application 2019 & 2032
- Table 60: Rest of Europe Ceramic Foundry Sand Market Volume (Million) Forecast, by Application 2019 & 2032
- Table 61: Global Ceramic Foundry Sand Market Revenue Million Forecast, by Application 2019 & 2032
- Table 62: Global Ceramic Foundry Sand Market Volume Million Forecast, by Application 2019 & 2032
- Table 63: Global Ceramic Foundry Sand Market Revenue Million Forecast, by Country 2019 & 2032
- Table 64: Global Ceramic Foundry Sand Market Volume Million Forecast, by Country 2019 & 2032
- Table 65: Brazil Ceramic Foundry Sand Market Revenue (Million) Forecast, by Application 2019 & 2032
- Table 66: Brazil Ceramic Foundry Sand Market Volume (Million) Forecast, by Application 2019 & 2032
- Table 67: Argentina Ceramic Foundry Sand Market Revenue (Million) Forecast, by Application 2019 & 2032
- Table 68: Argentina Ceramic Foundry Sand Market Volume (Million) Forecast, by Application 2019 & 2032
- Table 69: Colombia Ceramic Foundry Sand Market Revenue (Million) Forecast, by Application 2019 & 2032
- Table 70: Colombia Ceramic Foundry Sand Market Volume (Million) Forecast, by Application 2019 & 2032
- Table 71: Rest of South America Ceramic Foundry Sand Market Revenue (Million) Forecast, by Application 2019 & 2032
- Table 72: Rest of South America Ceramic Foundry Sand Market Volume (Million) Forecast, by Application 2019 & 2032
- Table 73: Global Ceramic Foundry Sand Market Revenue Million Forecast, by Application 2019 & 2032
- Table 74: Global Ceramic Foundry Sand Market Volume Million Forecast, by Application 2019 & 2032
- Table 75: Global Ceramic Foundry Sand Market Revenue Million Forecast, by Country 2019 & 2032
- Table 76: Global Ceramic Foundry Sand Market Volume Million Forecast, by Country 2019 & 2032
- Table 77: Saudi Arabia Ceramic Foundry Sand Market Revenue (Million) Forecast, by Application 2019 & 2032
- Table 78: Saudi Arabia Ceramic Foundry Sand Market Volume (Million) Forecast, by Application 2019 & 2032
- Table 79: South Africa Ceramic Foundry Sand Market Revenue (Million) Forecast, by Application 2019 & 2032
- Table 80: South Africa Ceramic Foundry Sand Market Volume (Million) Forecast, by Application 2019 & 2032
- Table 81: Qatar Ceramic Foundry Sand Market Revenue (Million) Forecast, by Application 2019 & 2032
- Table 82: Qatar Ceramic Foundry Sand Market Volume (Million) Forecast, by Application 2019 & 2032
- Table 83: UAE Ceramic Foundry Sand Market Revenue (Million) Forecast, by Application 2019 & 2032
- Table 84: UAE Ceramic Foundry Sand Market Volume (Million) Forecast, by Application 2019 & 2032
- Table 85: Egypt Ceramic Foundry Sand Market Revenue (Million) Forecast, by Application 2019 & 2032
- Table 86: Egypt Ceramic Foundry Sand Market Volume (Million) Forecast, by Application 2019 & 2032
- Table 87: Rest of Middle East and Africa Ceramic Foundry Sand Market Revenue (Million) Forecast, by Application 2019 & 2032
- Table 88: Rest of Middle East and Africa Ceramic Foundry Sand Market Volume (Million) Forecast, by Application 2019 & 2032
Frequently Asked Questions
1. What is the projected Compound Annual Growth Rate (CAGR) of the Ceramic Foundry Sand Market?
The projected CAGR is approximately > 6.00%.
2. Which companies are prominent players in the Ceramic Foundry Sand Market?
Key companies in the market include Chesapeake Specialty Products Inc, CARBO Ceramics Inc, HARIOM INDUSTRIES, Henan Sicheng Abrasives Tech Co Ltd, Kupper Ltd, Kailin Foundry, Qingdao Duoyuan New Materials Co Ltd, Samarth Metallurgicals, Hebei Shenghuo New Material Technology Co Ltd (SHXK), ZHENGZHOU HAIXU ABRASIVES CO LTD*List Not Exhaustive.
3. What are the main segments of the Ceramic Foundry Sand Market?
The market segments include Application.
4. Can you provide details about the market size?
The market size is estimated to be USD 220.12 Million as of 2022.
5. What are some drivers contributing to market growth?
Increasing Demand from the Foundry Industry; Growing Demand from the Metal Casting Industry; Other Drivers.
6. What are the notable trends driving market growth?
Resin Coated Sand to Dominate the Market.
7. Are there any restraints impacting market growth?
Increasing Demand from the Foundry Industry; Growing Demand from the Metal Casting Industry; Other Drivers.
8. Can you provide examples of recent developments in the market?
The recent developments pertaining to the major players in the market are being covered in the complete study.
9. What pricing options are available for accessing the report?
Pricing options include single-user, multi-user, and enterprise licenses priced at USD 4750, USD 5250, and USD 8750 respectively.
10. Is the market size provided in terms of value or volume?
The market size is provided in terms of value, measured in Million and volume, measured in Million.
11. Are there any specific market keywords associated with the report?
Yes, the market keyword associated with the report is "Ceramic Foundry Sand Market," which aids in identifying and referencing the specific market segment covered.
12. How do I determine which pricing option suits my needs best?
The pricing options vary based on user requirements and access needs. Individual users may opt for single-user licenses, while businesses requiring broader access may choose multi-user or enterprise licenses for cost-effective access to the report.
13. Are there any additional resources or data provided in the Ceramic Foundry Sand Market report?
While the report offers comprehensive insights, it's advisable to review the specific contents or supplementary materials provided to ascertain if additional resources or data are available.
14. How can I stay updated on further developments or reports in the Ceramic Foundry Sand Market?
To stay informed about further developments, trends, and reports in the Ceramic Foundry Sand Market, consider subscribing to industry newsletters, following relevant companies and organizations, or regularly checking reputable industry news sources and publications.
Methodology
Step 1 - Identification of Relevant Samples Size from Population Database


Step 2 - Approaches for Defining Global Market Size (Value, Volume* & Price*)

Note*: In applicable scenarios
Step 3 - Data Sources
Primary Research
- Web Analytics
- Survey Reports
- Research Institute
- Latest Research Reports
- Opinion Leaders
Secondary Research
- Annual Reports
- White Paper
- Latest Press Release
- Industry Association
- Paid Database
- Investor Presentations

Step 4 - Data Triangulation
Involves using different sources of information in order to increase the validity of a study
These sources are likely to be stakeholders in a program - participants, other researchers, program staff, other community members, and so on.
Then we put all data in single framework & apply various statistical tools to find out the dynamic on the market.
During the analysis stage, feedback from the stakeholder groups would be compared to determine areas of agreement as well as areas of divergence


