
Key Insights
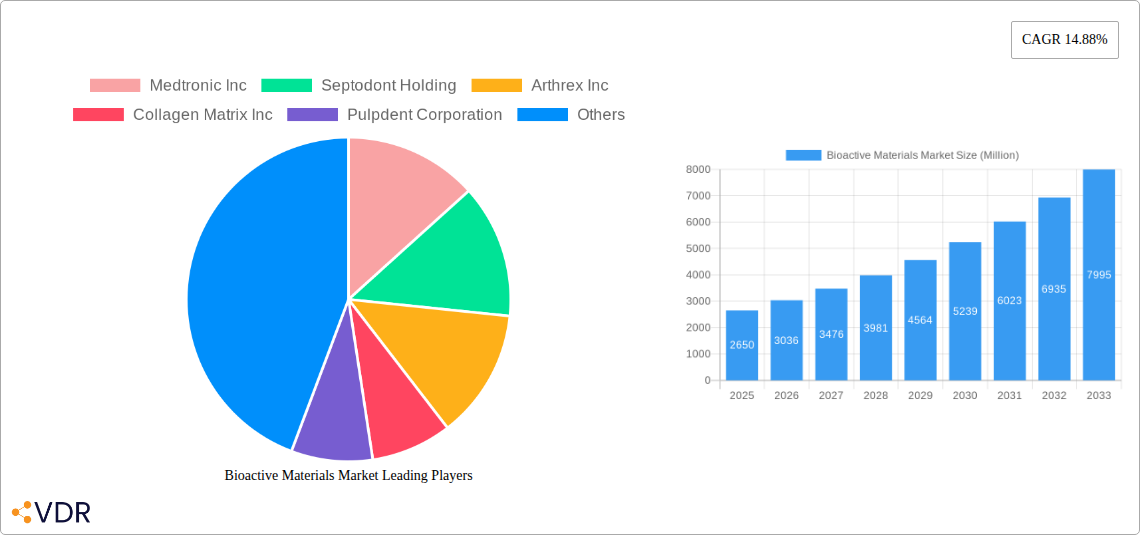
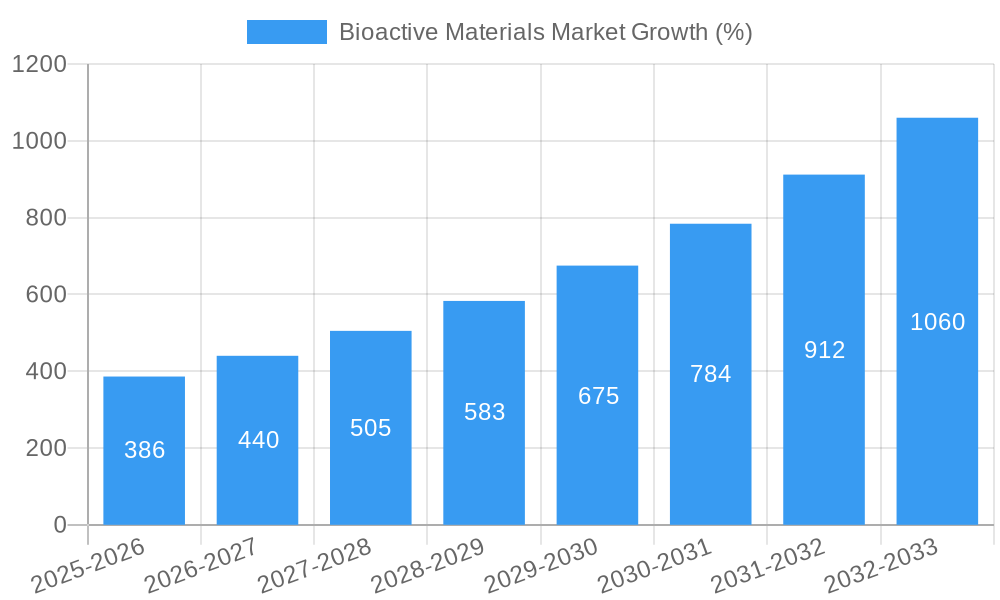
The bioactive materials market, valued at $2.65 billion in 2025, is projected to experience robust growth, driven by a compound annual growth rate (CAGR) of 14.88% from 2025 to 2033. This expansion is fueled by several key factors. The increasing prevalence of orthopedic injuries and dental procedures globally is significantly boosting demand for bioactive materials in implants and restorative treatments. Advancements in nanomedicine and biotechnology are also creating new applications for these materials in drug delivery systems and tissue engineering, further propelling market growth. The rising geriatric population, susceptible to age-related bone and joint issues, contributes significantly to the market's expansion. Furthermore, ongoing research and development efforts focused on improving biocompatibility, strength, and functionality of bioactive materials are continuously expanding the market's potential. Specific material types like bioactive glass and bioactive ceramics are witnessing significant traction due to their superior properties and versatility.
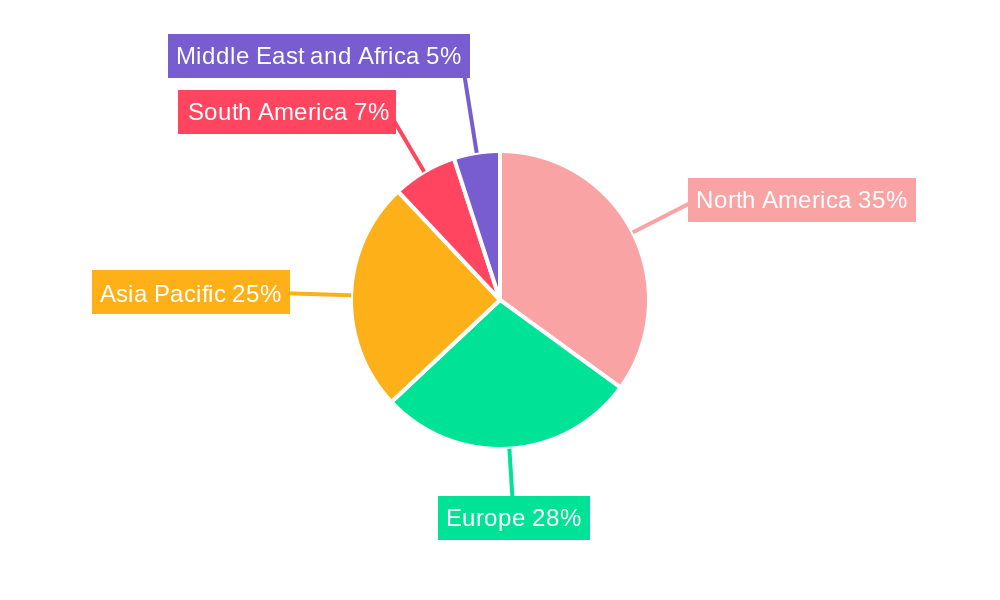
However, the market faces some challenges. High manufacturing costs associated with advanced bioactive materials can limit their accessibility, particularly in developing regions. Stringent regulatory approvals and extensive clinical trials needed for new products can also impede faster market penetration. Nevertheless, the overall market outlook remains positive, driven by the continuous innovation in material science and the growing healthcare expenditure globally. The market segmentation by material type (Bioactive Glass, Bioactive Ceramics, Bioactive Composites, Other Material Types) and application (Orthopedics, Dental Care, Nanomedicines and Biotechnology, Other Applications) provides a granular understanding of specific market opportunities and growth drivers. The regional breakdown reveals a dynamic landscape, with the Asia Pacific region anticipated to witness strong growth owing to its expanding healthcare infrastructure and rising disposable incomes. North America, due to its advanced medical technology sector, is also expected to remain a dominant regional market.
Bioactive Materials Market Report: A Comprehensive Analysis (2019-2033)
This comprehensive report provides an in-depth analysis of the Bioactive Materials market, encompassing its current state, future trajectory, and key players. We delve into market segmentation by material type (Bioactive Glass, Bioactive Ceramics, Bioactive Composites, Other Material Types) and application (Orthopedics, Dental Care, Nanomedicines and Biotechnology, Other Applications), offering a granular understanding of this dynamic industry. The study period covers 2019-2033, with a base year of 2025 and a forecast period of 2025-2033. The market is projected to reach xx Million by 2033.
Bioactive Materials Market Dynamics & Structure
This section analyzes the Bioactive Materials market's competitive landscape, technological advancements, regulatory environment, and market trends. We examine market concentration, revealing the market share held by key players like Medtronic Inc, Zimmer Holdings Inc, and Stryker Corporation. The report further explores the impact of mergers and acquisitions (M&A) activities on market consolidation, estimating xx M&A deals within the analyzed period.
- Market Concentration: Highly fragmented with a few dominant players holding xx% of the market share in 2024.
- Technological Innovation: Significant advancements in biomaterial design and manufacturing processes are driving market growth, with a focus on improved biocompatibility and efficacy.
- Regulatory Frameworks: Stringent regulatory approvals impacting time-to-market and market entry barriers.
- Competitive Product Substitutes: Competition from traditional materials limits market penetration, particularly in cost-sensitive segments.
- End-User Demographics: Growing geriatric population and rising prevalence of chronic diseases fueling demand for bioactive materials in healthcare applications.
- M&A Trends: Consolidation expected to continue, driven by strategic partnerships and acquisitions of smaller companies by larger players. Innovation barriers include high R&D costs and regulatory hurdles, hindering smaller players' growth.
Bioactive Materials Market Growth Trends & Insights
The Bioactive Materials market exhibits robust growth, driven by increasing demand for minimally invasive surgical procedures, rising prevalence of orthopedic conditions, and advancements in nanomedicine. The market size is estimated at xx Million in 2025 and is projected to experience a Compound Annual Growth Rate (CAGR) of xx% from 2025 to 2033. Adoption rates are increasing steadily across various applications, particularly in orthopedics and dental care, fueled by technological advancements resulting in improved patient outcomes. Consumer behavior is shifting towards minimally invasive procedures and personalized medicine, further driving demand for sophisticated bioactive materials. Market penetration is highest in developed economies like the US and Europe, with significant growth potential in emerging markets.
Dominant Regions, Countries, or Segments in Bioactive Materials Market
The North American region is currently the largest market for bioactive materials, holding a xx% share in 2025, followed by Europe and Asia Pacific. Within material types, Bioactive Ceramics dominate, accounting for xx% of the market share, driven by their widespread use in orthopedic implants and dental applications. The Orthopedics segment is the largest application area, representing xx% of the total market, while the Nanomedicines and Biotechnology segments are expected to witness the highest growth in the forecast period.
- Orthopedics: High demand due to the increasing prevalence of osteoarthritis and other musculoskeletal disorders.
- Dental Care: Growing demand for aesthetically pleasing and biocompatible dental materials.
- North America: High healthcare expenditure and technological advancements are key drivers.
- Europe: Stringent regulatory environment but high adoption rate of advanced technologies.
- Asia Pacific: Growing awareness and adoption, along with rising disposable incomes, are boosting growth.
Bioactive Materials Market Product Landscape
The bioactive materials market is characterized by continuous innovation, with new products offering enhanced biocompatibility, improved mechanical strength, and customized designs tailored to specific applications. Companies are focusing on developing biodegradable materials with controlled degradation rates to minimize the need for revision surgeries. Advancements in surface modification technologies are also improving the integration of materials with surrounding tissues, leading to faster healing and reduced inflammation.
Key Drivers, Barriers & Challenges in Bioactive Materials Market
Key Drivers: Increasing prevalence of chronic diseases, rising geriatric population, advancements in minimally invasive surgical techniques, and technological breakthroughs in material science are key drivers. Government initiatives promoting healthcare infrastructure development also contribute to market growth.
Key Challenges: Stringent regulatory approvals, high R&D costs, and competition from traditional materials pose significant challenges. Supply chain disruptions and price fluctuations of raw materials also impact profitability. Estimated xx% decrease in profit margin due to raw material price fluctuations in 2024.
Emerging Opportunities in Bioactive Materials Market
Untapped opportunities exist in emerging markets with growing healthcare infrastructure, personalized medicine, and the development of novel bioactive materials with unique properties. Expansion into new applications such as tissue engineering, drug delivery systems, and regenerative medicine presents significant potential. The use of 3D printing to create customized implants also offers a promising opportunity for growth.
Growth Accelerators in the Bioactive Materials Market Industry
Strategic partnerships and collaborations between material science companies and medical device manufacturers are driving market growth. Technological breakthroughs such as the development of biocompatible polymers and advanced surface modification techniques enhance product performance. Market expansion strategies, including geographic expansion into emerging markets and product diversification, are also contributing to the overall growth.
Key Players Shaping the Bioactive Materials Market Market
- Medtronic Inc
- Septodont Holding
- Arthrex Inc
- Collagen Matrix Inc
- Pulpdent Corporation
- Biomatlante
- Ceraver
- Bioactive Bone Substitutes OyJ
- DSM
- Cam Bioceramics
- Zimmer Holdings Inc
- BTG (Boston Scientific)
- OSARTIS GmbH
- Stryker Corporation
- DePuy Synthes (Johnson and Johnson)
- Evonik Industries
- Noraker
Notable Milestones in Bioactive Materials Market Sector
- September 2022: DSM partnered with NutriLeads to develop BeniCaros, a bioactive polysaccharide ingredient, expanding DSM's product portfolio in the supplement ingredient manufacturing market. This partnership signifies a diversification strategy within the bioactive materials sector, impacting market dynamics by introducing a new application area.
In-Depth Bioactive Materials Market Market Outlook
The bioactive materials market is poised for significant growth in the coming years, driven by technological advancements, increasing healthcare expenditure, and a growing need for advanced medical solutions. Strategic acquisitions, strategic partnerships focusing on research and development, and geographical expansion into emerging markets will be crucial to capture the significant opportunities that lie ahead. The focus will continue to be on innovation, leading to the development of more biocompatible, durable, and functional materials that meet the evolving needs of the healthcare sector.
Bioactive Materials Market Segmentation
-
1. Material Type
- 1.1. Bioactive Glass
- 1.2. Bioactive Ceramics
- 1.3. Bioactive Composites
- 1.4. Other Material Types
-
2. Application
- 2.1. Orthopedics
- 2.2. Dental Care
- 2.3. Nanomedicines and Biotechnology
- 2.4. Other Applications
Bioactive Materials Market Segmentation By Geography
-
1. Asia Pacific
- 1.1. China
- 1.2. India
- 1.3. Japan
- 1.4. South Korea
- 1.5. Rest of Asia Pacific
-
2. North America
- 2.1. United States
- 2.2. Canada
- 2.3. Mexico
-
3. Europe
- 3.1. Germany
- 3.2. United Kingdom
- 3.3. France
- 3.4. Italy
- 3.5. Rest of Europe
-
4. South America
- 4.1. Brazil
- 4.2. Argentina
- 4.3. Rest of South America
-
5. Middle East and Africa
- 5.1. Saudi Arabia
- 5.2. South Africa
- 5.3. Rest of Middle East and Africa
Bioactive Materials Market REPORT HIGHLIGHTS
| Aspects | Details |
|---|---|
| Study Period | 2019-2033 |
| Base Year | 2024 |
| Estimated Year | 2025 |
| Forecast Period | 2025-2033 |
| Historical Period | 2019-2024 |
| Growth Rate | CAGR of 14.88% from 2019-2033 |
| Segmentation |
|
Table of Contents
- 1. Introduction
- 1.1. Research Scope
- 1.2. Market Segmentation
- 1.3. Research Methodology
- 1.4. Definitions and Assumptions
- 2. Executive Summary
- 2.1. Introduction
- 3. Market Dynamics
- 3.1. Introduction
- 3.2. Market Drivers
- 3.2.1. Growing Demand for Dental Care and Root Canal Treatment; Increasing Applications in Medical Industry
- 3.3. Market Restrains
- 3.3.1 High Cost
- 3.3.2 Regulations
- 3.3.3 and Probable Toxicity
- 3.4. Market Trends
- 3.4.1. Growing Demand from Orthopedics
- 4. Market Factor Analysis
- 4.1. Porters Five Forces
- 4.2. Supply/Value Chain
- 4.3. PESTEL analysis
- 4.4. Market Entropy
- 4.5. Patent/Trademark Analysis
- 5. Global Bioactive Materials Market Analysis, Insights and Forecast, 2019-2031
- 5.1. Market Analysis, Insights and Forecast - by Material Type
- 5.1.1. Bioactive Glass
- 5.1.2. Bioactive Ceramics
- 5.1.3. Bioactive Composites
- 5.1.4. Other Material Types
- 5.2. Market Analysis, Insights and Forecast - by Application
- 5.2.1. Orthopedics
- 5.2.2. Dental Care
- 5.2.3. Nanomedicines and Biotechnology
- 5.2.4. Other Applications
- 5.3. Market Analysis, Insights and Forecast - by Region
- 5.3.1. Asia Pacific
- 5.3.2. North America
- 5.3.3. Europe
- 5.3.4. South America
- 5.3.5. Middle East and Africa
- 5.1. Market Analysis, Insights and Forecast - by Material Type
- 6. Asia Pacific Bioactive Materials Market Analysis, Insights and Forecast, 2019-2031
- 6.1. Market Analysis, Insights and Forecast - by Material Type
- 6.1.1. Bioactive Glass
- 6.1.2. Bioactive Ceramics
- 6.1.3. Bioactive Composites
- 6.1.4. Other Material Types
- 6.2. Market Analysis, Insights and Forecast - by Application
- 6.2.1. Orthopedics
- 6.2.2. Dental Care
- 6.2.3. Nanomedicines and Biotechnology
- 6.2.4. Other Applications
- 6.1. Market Analysis, Insights and Forecast - by Material Type
- 7. North America Bioactive Materials Market Analysis, Insights and Forecast, 2019-2031
- 7.1. Market Analysis, Insights and Forecast - by Material Type
- 7.1.1. Bioactive Glass
- 7.1.2. Bioactive Ceramics
- 7.1.3. Bioactive Composites
- 7.1.4. Other Material Types
- 7.2. Market Analysis, Insights and Forecast - by Application
- 7.2.1. Orthopedics
- 7.2.2. Dental Care
- 7.2.3. Nanomedicines and Biotechnology
- 7.2.4. Other Applications
- 7.1. Market Analysis, Insights and Forecast - by Material Type
- 8. Europe Bioactive Materials Market Analysis, Insights and Forecast, 2019-2031
- 8.1. Market Analysis, Insights and Forecast - by Material Type
- 8.1.1. Bioactive Glass
- 8.1.2. Bioactive Ceramics
- 8.1.3. Bioactive Composites
- 8.1.4. Other Material Types
- 8.2. Market Analysis, Insights and Forecast - by Application
- 8.2.1. Orthopedics
- 8.2.2. Dental Care
- 8.2.3. Nanomedicines and Biotechnology
- 8.2.4. Other Applications
- 8.1. Market Analysis, Insights and Forecast - by Material Type
- 9. South America Bioactive Materials Market Analysis, Insights and Forecast, 2019-2031
- 9.1. Market Analysis, Insights and Forecast - by Material Type
- 9.1.1. Bioactive Glass
- 9.1.2. Bioactive Ceramics
- 9.1.3. Bioactive Composites
- 9.1.4. Other Material Types
- 9.2. Market Analysis, Insights and Forecast - by Application
- 9.2.1. Orthopedics
- 9.2.2. Dental Care
- 9.2.3. Nanomedicines and Biotechnology
- 9.2.4. Other Applications
- 9.1. Market Analysis, Insights and Forecast - by Material Type
- 10. Middle East and Africa Bioactive Materials Market Analysis, Insights and Forecast, 2019-2031
- 10.1. Market Analysis, Insights and Forecast - by Material Type
- 10.1.1. Bioactive Glass
- 10.1.2. Bioactive Ceramics
- 10.1.3. Bioactive Composites
- 10.1.4. Other Material Types
- 10.2. Market Analysis, Insights and Forecast - by Application
- 10.2.1. Orthopedics
- 10.2.2. Dental Care
- 10.2.3. Nanomedicines and Biotechnology
- 10.2.4. Other Applications
- 10.1. Market Analysis, Insights and Forecast - by Material Type
- 11. Asia Pacific Bioactive Materials Market Analysis, Insights and Forecast, 2019-2031
- 11.1. Market Analysis, Insights and Forecast - By Country/Sub-region
- 11.1.1 China
- 11.1.2 India
- 11.1.3 Japan
- 11.1.4 South Korea
- 11.1.5 Rest of Asia Pacific
- 12. North America Bioactive Materials Market Analysis, Insights and Forecast, 2019-2031
- 12.1. Market Analysis, Insights and Forecast - By Country/Sub-region
- 12.1.1 United States
- 12.1.2 Canada
- 12.1.3 Mexico
- 13. Europe Bioactive Materials Market Analysis, Insights and Forecast, 2019-2031
- 13.1. Market Analysis, Insights and Forecast - By Country/Sub-region
- 13.1.1 Germany
- 13.1.2 United Kingdom
- 13.1.3 France
- 13.1.4 Italy
- 13.1.5 Rest of Europe
- 14. South America Bioactive Materials Market Analysis, Insights and Forecast, 2019-2031
- 14.1. Market Analysis, Insights and Forecast - By Country/Sub-region
- 14.1.1 Brazil
- 14.1.2 Argentina
- 14.1.3 Rest of South America
- 15. Middle East and Africa Bioactive Materials Market Analysis, Insights and Forecast, 2019-2031
- 15.1. Market Analysis, Insights and Forecast - By Country/Sub-region
- 15.1.1 Saudi Arabia
- 15.1.2 South Africa
- 15.1.3 Rest of Middle East and Africa
- 16. Competitive Analysis
- 16.1. Global Market Share Analysis 2024
- 16.2. Company Profiles
- 16.2.1 Medtronic Inc
- 16.2.1.1. Overview
- 16.2.1.2. Products
- 16.2.1.3. SWOT Analysis
- 16.2.1.4. Recent Developments
- 16.2.1.5. Financials (Based on Availability)
- 16.2.2 Septodont Holding
- 16.2.2.1. Overview
- 16.2.2.2. Products
- 16.2.2.3. SWOT Analysis
- 16.2.2.4. Recent Developments
- 16.2.2.5. Financials (Based on Availability)
- 16.2.3 Arthrex Inc
- 16.2.3.1. Overview
- 16.2.3.2. Products
- 16.2.3.3. SWOT Analysis
- 16.2.3.4. Recent Developments
- 16.2.3.5. Financials (Based on Availability)
- 16.2.4 Collagen Matrix Inc
- 16.2.4.1. Overview
- 16.2.4.2. Products
- 16.2.4.3. SWOT Analysis
- 16.2.4.4. Recent Developments
- 16.2.4.5. Financials (Based on Availability)
- 16.2.5 Pulpdent Corporation
- 16.2.5.1. Overview
- 16.2.5.2. Products
- 16.2.5.3. SWOT Analysis
- 16.2.5.4. Recent Developments
- 16.2.5.5. Financials (Based on Availability)
- 16.2.6 Biomatlante
- 16.2.6.1. Overview
- 16.2.6.2. Products
- 16.2.6.3. SWOT Analysis
- 16.2.6.4. Recent Developments
- 16.2.6.5. Financials (Based on Availability)
- 16.2.7 Ceraver
- 16.2.7.1. Overview
- 16.2.7.2. Products
- 16.2.7.3. SWOT Analysis
- 16.2.7.4. Recent Developments
- 16.2.7.5. Financials (Based on Availability)
- 16.2.8 Bioactive Bone Substitutes OyJ
- 16.2.8.1. Overview
- 16.2.8.2. Products
- 16.2.8.3. SWOT Analysis
- 16.2.8.4. Recent Developments
- 16.2.8.5. Financials (Based on Availability)
- 16.2.9 DSM
- 16.2.9.1. Overview
- 16.2.9.2. Products
- 16.2.9.3. SWOT Analysis
- 16.2.9.4. Recent Developments
- 16.2.9.5. Financials (Based on Availability)
- 16.2.10 Cam Bioceramics
- 16.2.10.1. Overview
- 16.2.10.2. Products
- 16.2.10.3. SWOT Analysis
- 16.2.10.4. Recent Developments
- 16.2.10.5. Financials (Based on Availability)
- 16.2.11 Zimmer Holdings Inc *List Not Exhaustive
- 16.2.11.1. Overview
- 16.2.11.2. Products
- 16.2.11.3. SWOT Analysis
- 16.2.11.4. Recent Developments
- 16.2.11.5. Financials (Based on Availability)
- 16.2.12 BTG (Boston Scientific)
- 16.2.12.1. Overview
- 16.2.12.2. Products
- 16.2.12.3. SWOT Analysis
- 16.2.12.4. Recent Developments
- 16.2.12.5. Financials (Based on Availability)
- 16.2.13 OSARTIS GmbH
- 16.2.13.1. Overview
- 16.2.13.2. Products
- 16.2.13.3. SWOT Analysis
- 16.2.13.4. Recent Developments
- 16.2.13.5. Financials (Based on Availability)
- 16.2.14 Stryker Corporation
- 16.2.14.1. Overview
- 16.2.14.2. Products
- 16.2.14.3. SWOT Analysis
- 16.2.14.4. Recent Developments
- 16.2.14.5. Financials (Based on Availability)
- 16.2.15 DePuy Synthes (Johnson and Johnson)
- 16.2.15.1. Overview
- 16.2.15.2. Products
- 16.2.15.3. SWOT Analysis
- 16.2.15.4. Recent Developments
- 16.2.15.5. Financials (Based on Availability)
- 16.2.16 Evonik Industries
- 16.2.16.1. Overview
- 16.2.16.2. Products
- 16.2.16.3. SWOT Analysis
- 16.2.16.4. Recent Developments
- 16.2.16.5. Financials (Based on Availability)
- 16.2.17 Noraker
- 16.2.17.1. Overview
- 16.2.17.2. Products
- 16.2.17.3. SWOT Analysis
- 16.2.17.4. Recent Developments
- 16.2.17.5. Financials (Based on Availability)
- 16.2.1 Medtronic Inc
List of Figures
- Figure 1: Global Bioactive Materials Market Revenue Breakdown (Million, %) by Region 2024 & 2032
- Figure 2: Asia Pacific Bioactive Materials Market Revenue (Million), by Country 2024 & 2032
- Figure 3: Asia Pacific Bioactive Materials Market Revenue Share (%), by Country 2024 & 2032
- Figure 4: North America Bioactive Materials Market Revenue (Million), by Country 2024 & 2032
- Figure 5: North America Bioactive Materials Market Revenue Share (%), by Country 2024 & 2032
- Figure 6: Europe Bioactive Materials Market Revenue (Million), by Country 2024 & 2032
- Figure 7: Europe Bioactive Materials Market Revenue Share (%), by Country 2024 & 2032
- Figure 8: South America Bioactive Materials Market Revenue (Million), by Country 2024 & 2032
- Figure 9: South America Bioactive Materials Market Revenue Share (%), by Country 2024 & 2032
- Figure 10: Middle East and Africa Bioactive Materials Market Revenue (Million), by Country 2024 & 2032
- Figure 11: Middle East and Africa Bioactive Materials Market Revenue Share (%), by Country 2024 & 2032
- Figure 12: Asia Pacific Bioactive Materials Market Revenue (Million), by Material Type 2024 & 2032
- Figure 13: Asia Pacific Bioactive Materials Market Revenue Share (%), by Material Type 2024 & 2032
- Figure 14: Asia Pacific Bioactive Materials Market Revenue (Million), by Application 2024 & 2032
- Figure 15: Asia Pacific Bioactive Materials Market Revenue Share (%), by Application 2024 & 2032
- Figure 16: Asia Pacific Bioactive Materials Market Revenue (Million), by Country 2024 & 2032
- Figure 17: Asia Pacific Bioactive Materials Market Revenue Share (%), by Country 2024 & 2032
- Figure 18: North America Bioactive Materials Market Revenue (Million), by Material Type 2024 & 2032
- Figure 19: North America Bioactive Materials Market Revenue Share (%), by Material Type 2024 & 2032
- Figure 20: North America Bioactive Materials Market Revenue (Million), by Application 2024 & 2032
- Figure 21: North America Bioactive Materials Market Revenue Share (%), by Application 2024 & 2032
- Figure 22: North America Bioactive Materials Market Revenue (Million), by Country 2024 & 2032
- Figure 23: North America Bioactive Materials Market Revenue Share (%), by Country 2024 & 2032
- Figure 24: Europe Bioactive Materials Market Revenue (Million), by Material Type 2024 & 2032
- Figure 25: Europe Bioactive Materials Market Revenue Share (%), by Material Type 2024 & 2032
- Figure 26: Europe Bioactive Materials Market Revenue (Million), by Application 2024 & 2032
- Figure 27: Europe Bioactive Materials Market Revenue Share (%), by Application 2024 & 2032
- Figure 28: Europe Bioactive Materials Market Revenue (Million), by Country 2024 & 2032
- Figure 29: Europe Bioactive Materials Market Revenue Share (%), by Country 2024 & 2032
- Figure 30: South America Bioactive Materials Market Revenue (Million), by Material Type 2024 & 2032
- Figure 31: South America Bioactive Materials Market Revenue Share (%), by Material Type 2024 & 2032
- Figure 32: South America Bioactive Materials Market Revenue (Million), by Application 2024 & 2032
- Figure 33: South America Bioactive Materials Market Revenue Share (%), by Application 2024 & 2032
- Figure 34: South America Bioactive Materials Market Revenue (Million), by Country 2024 & 2032
- Figure 35: South America Bioactive Materials Market Revenue Share (%), by Country 2024 & 2032
- Figure 36: Middle East and Africa Bioactive Materials Market Revenue (Million), by Material Type 2024 & 2032
- Figure 37: Middle East and Africa Bioactive Materials Market Revenue Share (%), by Material Type 2024 & 2032
- Figure 38: Middle East and Africa Bioactive Materials Market Revenue (Million), by Application 2024 & 2032
- Figure 39: Middle East and Africa Bioactive Materials Market Revenue Share (%), by Application 2024 & 2032
- Figure 40: Middle East and Africa Bioactive Materials Market Revenue (Million), by Country 2024 & 2032
- Figure 41: Middle East and Africa Bioactive Materials Market Revenue Share (%), by Country 2024 & 2032
List of Tables
- Table 1: Global Bioactive Materials Market Revenue Million Forecast, by Region 2019 & 2032
- Table 2: Global Bioactive Materials Market Revenue Million Forecast, by Material Type 2019 & 2032
- Table 3: Global Bioactive Materials Market Revenue Million Forecast, by Application 2019 & 2032
- Table 4: Global Bioactive Materials Market Revenue Million Forecast, by Region 2019 & 2032
- Table 5: Global Bioactive Materials Market Revenue Million Forecast, by Country 2019 & 2032
- Table 6: China Bioactive Materials Market Revenue (Million) Forecast, by Application 2019 & 2032
- Table 7: India Bioactive Materials Market Revenue (Million) Forecast, by Application 2019 & 2032
- Table 8: Japan Bioactive Materials Market Revenue (Million) Forecast, by Application 2019 & 2032
- Table 9: South Korea Bioactive Materials Market Revenue (Million) Forecast, by Application 2019 & 2032
- Table 10: Rest of Asia Pacific Bioactive Materials Market Revenue (Million) Forecast, by Application 2019 & 2032
- Table 11: Global Bioactive Materials Market Revenue Million Forecast, by Country 2019 & 2032
- Table 12: United States Bioactive Materials Market Revenue (Million) Forecast, by Application 2019 & 2032
- Table 13: Canada Bioactive Materials Market Revenue (Million) Forecast, by Application 2019 & 2032
- Table 14: Mexico Bioactive Materials Market Revenue (Million) Forecast, by Application 2019 & 2032
- Table 15: Global Bioactive Materials Market Revenue Million Forecast, by Country 2019 & 2032
- Table 16: Germany Bioactive Materials Market Revenue (Million) Forecast, by Application 2019 & 2032
- Table 17: United Kingdom Bioactive Materials Market Revenue (Million) Forecast, by Application 2019 & 2032
- Table 18: France Bioactive Materials Market Revenue (Million) Forecast, by Application 2019 & 2032
- Table 19: Italy Bioactive Materials Market Revenue (Million) Forecast, by Application 2019 & 2032
- Table 20: Rest of Europe Bioactive Materials Market Revenue (Million) Forecast, by Application 2019 & 2032
- Table 21: Global Bioactive Materials Market Revenue Million Forecast, by Country 2019 & 2032
- Table 22: Brazil Bioactive Materials Market Revenue (Million) Forecast, by Application 2019 & 2032
- Table 23: Argentina Bioactive Materials Market Revenue (Million) Forecast, by Application 2019 & 2032
- Table 24: Rest of South America Bioactive Materials Market Revenue (Million) Forecast, by Application 2019 & 2032
- Table 25: Global Bioactive Materials Market Revenue Million Forecast, by Country 2019 & 2032
- Table 26: Saudi Arabia Bioactive Materials Market Revenue (Million) Forecast, by Application 2019 & 2032
- Table 27: South Africa Bioactive Materials Market Revenue (Million) Forecast, by Application 2019 & 2032
- Table 28: Rest of Middle East and Africa Bioactive Materials Market Revenue (Million) Forecast, by Application 2019 & 2032
- Table 29: Global Bioactive Materials Market Revenue Million Forecast, by Material Type 2019 & 2032
- Table 30: Global Bioactive Materials Market Revenue Million Forecast, by Application 2019 & 2032
- Table 31: Global Bioactive Materials Market Revenue Million Forecast, by Country 2019 & 2032
- Table 32: China Bioactive Materials Market Revenue (Million) Forecast, by Application 2019 & 2032
- Table 33: India Bioactive Materials Market Revenue (Million) Forecast, by Application 2019 & 2032
- Table 34: Japan Bioactive Materials Market Revenue (Million) Forecast, by Application 2019 & 2032
- Table 35: South Korea Bioactive Materials Market Revenue (Million) Forecast, by Application 2019 & 2032
- Table 36: Rest of Asia Pacific Bioactive Materials Market Revenue (Million) Forecast, by Application 2019 & 2032
- Table 37: Global Bioactive Materials Market Revenue Million Forecast, by Material Type 2019 & 2032
- Table 38: Global Bioactive Materials Market Revenue Million Forecast, by Application 2019 & 2032
- Table 39: Global Bioactive Materials Market Revenue Million Forecast, by Country 2019 & 2032
- Table 40: United States Bioactive Materials Market Revenue (Million) Forecast, by Application 2019 & 2032
- Table 41: Canada Bioactive Materials Market Revenue (Million) Forecast, by Application 2019 & 2032
- Table 42: Mexico Bioactive Materials Market Revenue (Million) Forecast, by Application 2019 & 2032
- Table 43: Global Bioactive Materials Market Revenue Million Forecast, by Material Type 2019 & 2032
- Table 44: Global Bioactive Materials Market Revenue Million Forecast, by Application 2019 & 2032
- Table 45: Global Bioactive Materials Market Revenue Million Forecast, by Country 2019 & 2032
- Table 46: Germany Bioactive Materials Market Revenue (Million) Forecast, by Application 2019 & 2032
- Table 47: United Kingdom Bioactive Materials Market Revenue (Million) Forecast, by Application 2019 & 2032
- Table 48: France Bioactive Materials Market Revenue (Million) Forecast, by Application 2019 & 2032
- Table 49: Italy Bioactive Materials Market Revenue (Million) Forecast, by Application 2019 & 2032
- Table 50: Rest of Europe Bioactive Materials Market Revenue (Million) Forecast, by Application 2019 & 2032
- Table 51: Global Bioactive Materials Market Revenue Million Forecast, by Material Type 2019 & 2032
- Table 52: Global Bioactive Materials Market Revenue Million Forecast, by Application 2019 & 2032
- Table 53: Global Bioactive Materials Market Revenue Million Forecast, by Country 2019 & 2032
- Table 54: Brazil Bioactive Materials Market Revenue (Million) Forecast, by Application 2019 & 2032
- Table 55: Argentina Bioactive Materials Market Revenue (Million) Forecast, by Application 2019 & 2032
- Table 56: Rest of South America Bioactive Materials Market Revenue (Million) Forecast, by Application 2019 & 2032
- Table 57: Global Bioactive Materials Market Revenue Million Forecast, by Material Type 2019 & 2032
- Table 58: Global Bioactive Materials Market Revenue Million Forecast, by Application 2019 & 2032
- Table 59: Global Bioactive Materials Market Revenue Million Forecast, by Country 2019 & 2032
- Table 60: Saudi Arabia Bioactive Materials Market Revenue (Million) Forecast, by Application 2019 & 2032
- Table 61: South Africa Bioactive Materials Market Revenue (Million) Forecast, by Application 2019 & 2032
- Table 62: Rest of Middle East and Africa Bioactive Materials Market Revenue (Million) Forecast, by Application 2019 & 2032
Frequently Asked Questions
1. What is the projected Compound Annual Growth Rate (CAGR) of the Bioactive Materials Market?
The projected CAGR is approximately 14.88%.
2. Which companies are prominent players in the Bioactive Materials Market?
Key companies in the market include Medtronic Inc, Septodont Holding, Arthrex Inc, Collagen Matrix Inc, Pulpdent Corporation, Biomatlante, Ceraver, Bioactive Bone Substitutes OyJ, DSM, Cam Bioceramics, Zimmer Holdings Inc *List Not Exhaustive, BTG (Boston Scientific), OSARTIS GmbH, Stryker Corporation, DePuy Synthes (Johnson and Johnson), Evonik Industries, Noraker.
3. What are the main segments of the Bioactive Materials Market?
The market segments include Material Type, Application.
4. Can you provide details about the market size?
The market size is estimated to be USD 2.65 Million as of 2022.
5. What are some drivers contributing to market growth?
Growing Demand for Dental Care and Root Canal Treatment; Increasing Applications in Medical Industry.
6. What are the notable trends driving market growth?
Growing Demand from Orthopedics.
7. Are there any restraints impacting market growth?
High Cost. Regulations. and Probable Toxicity.
8. Can you provide examples of recent developments in the market?
In September 2022, DSM partnered with NutriLeads to develop BeniCaros, a bioactive polysaccharide ingredient that will expand DSM's product portfolio in the supplement ingredient manufacturing market.
9. What pricing options are available for accessing the report?
Pricing options include single-user, multi-user, and enterprise licenses priced at USD 4750, USD 5250, and USD 8750 respectively.
10. Is the market size provided in terms of value or volume?
The market size is provided in terms of value, measured in Million.
11. Are there any specific market keywords associated with the report?
Yes, the market keyword associated with the report is "Bioactive Materials Market," which aids in identifying and referencing the specific market segment covered.
12. How do I determine which pricing option suits my needs best?
The pricing options vary based on user requirements and access needs. Individual users may opt for single-user licenses, while businesses requiring broader access may choose multi-user or enterprise licenses for cost-effective access to the report.
13. Are there any additional resources or data provided in the Bioactive Materials Market report?
While the report offers comprehensive insights, it's advisable to review the specific contents or supplementary materials provided to ascertain if additional resources or data are available.
14. How can I stay updated on further developments or reports in the Bioactive Materials Market?
To stay informed about further developments, trends, and reports in the Bioactive Materials Market, consider subscribing to industry newsletters, following relevant companies and organizations, or regularly checking reputable industry news sources and publications.
Methodology
Step 1 - Identification of Relevant Samples Size from Population Database


Step 2 - Approaches for Defining Global Market Size (Value, Volume* & Price*)

Note*: In applicable scenarios
Step 3 - Data Sources
Primary Research
- Web Analytics
- Survey Reports
- Research Institute
- Latest Research Reports
- Opinion Leaders
Secondary Research
- Annual Reports
- White Paper
- Latest Press Release
- Industry Association
- Paid Database
- Investor Presentations

Step 4 - Data Triangulation
Involves using different sources of information in order to increase the validity of a study
These sources are likely to be stakeholders in a program - participants, other researchers, program staff, other community members, and so on.
Then we put all data in single framework & apply various statistical tools to find out the dynamic on the market.
During the analysis stage, feedback from the stakeholder groups would be compared to determine areas of agreement as well as areas of divergence


