
Key Insights
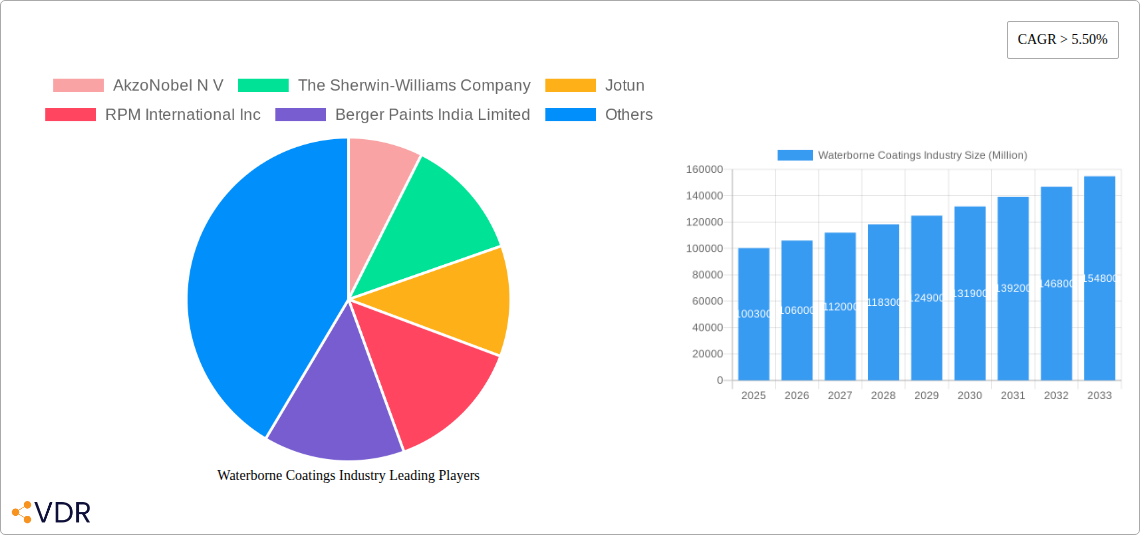
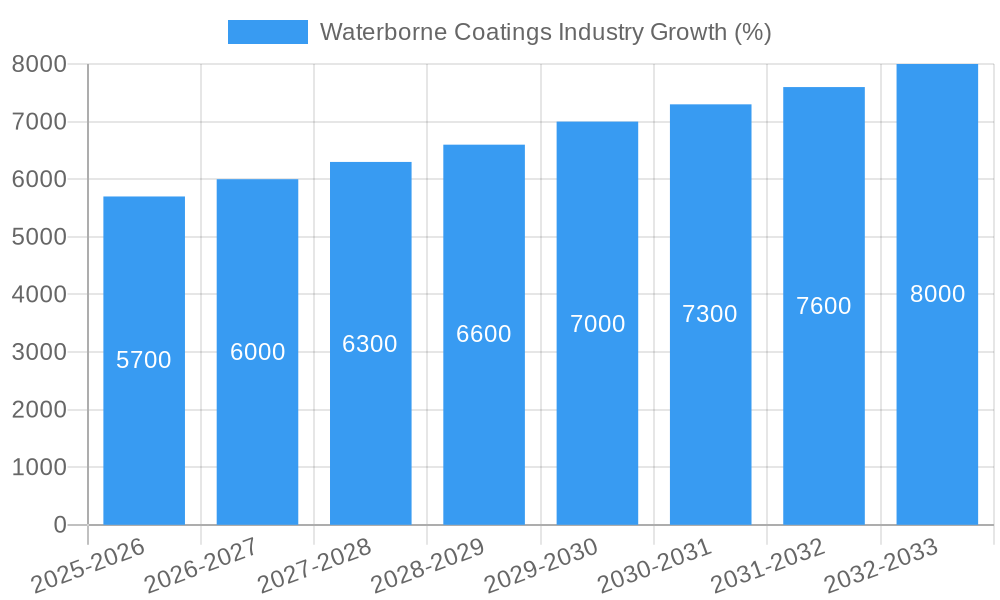
The global waterborne coatings market, valued at $100,300 million in 2025, is projected to experience robust growth, exhibiting a Compound Annual Growth Rate (CAGR) exceeding 5.50% from 2025 to 2033. This expansion is driven by several key factors. Increasing environmental regulations favoring low-VOC (volatile organic compound) coatings are significantly boosting demand. The construction industry, a major end-user, is witnessing a surge in activity globally, further fueling market growth. Furthermore, the rising popularity of sustainable and eco-friendly building materials is creating strong demand for waterborne coatings in residential, commercial, and infrastructure projects. The automotive sector's adoption of lightweight and fuel-efficient vehicles also contributes to market expansion, as waterborne coatings are well-suited for these applications. Innovation in resin types, such as the development of high-performance acrylics and polyurethanes, is enhancing the durability and functionality of waterborne coatings, attracting a wider range of applications.
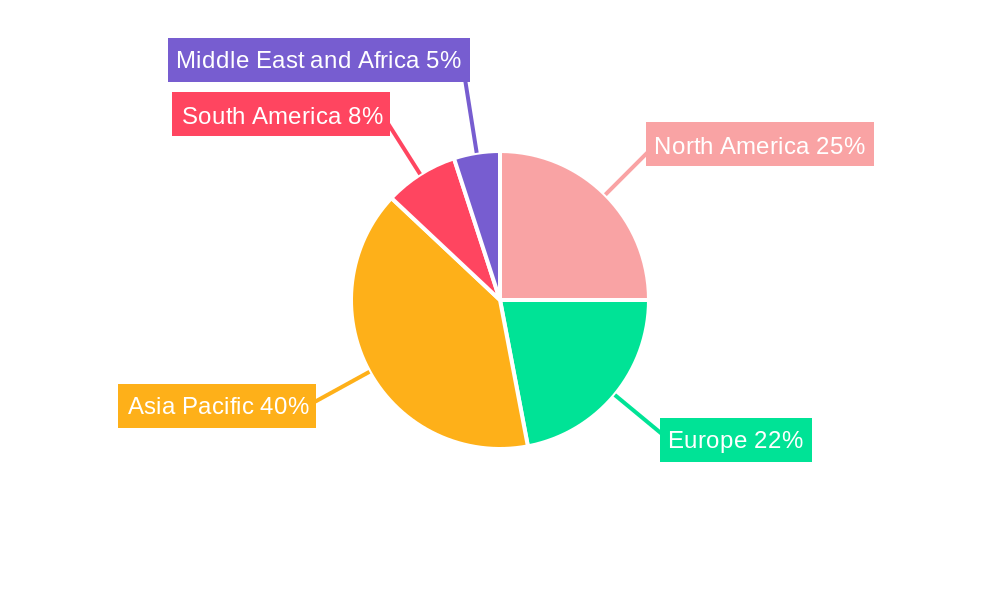
However, the market faces certain challenges. Price fluctuations in raw materials, particularly resins and pigments, can impact profitability. Competition from solvent-based coatings, especially in price-sensitive markets, remains a significant factor. Furthermore, the development and adoption of advanced coating technologies, such as powder coatings and radiation-cured coatings, could pose potential competition in certain niche segments. Nevertheless, the long-term outlook for the waterborne coatings market remains positive, driven by the aforementioned growth drivers and ongoing research and development efforts focused on enhancing performance and sustainability. Key players like AkzoNobel, Sherwin-Williams, and PPG Industries are actively investing in research and expanding their product portfolios to cater to the evolving demands of this dynamic market. Regional growth will be particularly strong in the Asia-Pacific region, fueled by rapid urbanization and industrialization in countries like China and India.
Waterborne Coatings Industry: A Comprehensive Market Analysis Report (2019-2033)
This comprehensive report provides an in-depth analysis of the global waterborne coatings industry, encompassing market dynamics, growth trends, regional segmentation, product landscape, key players, and future outlook. The report covers the period from 2019 to 2033, with 2025 as the base year and forecast extending to 2033. This detailed study is essential for industry professionals, investors, and stakeholders seeking to understand and capitalize on the opportunities within this rapidly evolving market. The report includes parent market analysis of the coatings industry and child market segments, allowing for a granular understanding of market dynamics.
Waterborne Coatings Industry Market Dynamics & Structure
The waterborne coatings market is characterized by moderate concentration, with several major players holding significant market share. The market is witnessing substantial technological innovation, driven by the increasing demand for environmentally friendly and high-performance coatings. Stringent environmental regulations are shaping product development, favoring waterborne solutions over solvent-based alternatives. Competitive pressures from substitute products, particularly powder coatings in certain applications, remain a factor. End-user demographics are shifting, with growth fueled by the expanding construction and automotive sectors, especially in developing economies. M&A activity has been moderate, with strategic acquisitions aimed at expanding product portfolios and geographical reach. The study period (2019-2024) saw approximately xx M&A deals, contributing to market consolidation.
- Market Concentration: Moderately concentrated, with top 5 players holding approximately 60% market share (2025 Estimate).
- Technological Innovation: Focus on low-VOC, high-performance formulations, bio-based resins, and smart coatings.
- Regulatory Framework: Stringent environmental regulations driving adoption of waterborne coatings globally.
- Competitive Substitutes: Powder coatings, solvent-based coatings pose competitive challenges in specific segments.
- End-User Demographics: Growth driven by building & construction, automotive, and industrial sectors; significant potential in developing markets.
- M&A Trends: Strategic acquisitions for portfolio expansion and geographical reach; xx million USD invested in M&A (2019-2024).
Waterborne Coatings Industry Growth Trends & Insights
The global waterborne coatings market exhibited robust growth during the historical period (2019-2024), with a CAGR of xx%. This growth is primarily attributed to the rising demand from the construction and automotive sectors, coupled with increasing awareness of environmental concerns. Technological advancements, such as the development of advanced resin chemistries and improved application techniques, have further fueled market expansion. Consumer preferences are shifting towards sustainable and eco-friendly products, boosting the adoption of waterborne coatings. The market is expected to maintain a healthy growth trajectory during the forecast period (2025-2033), driven by continued infrastructure development, expanding urbanization, and increasing automotive production, particularly in emerging economies. Market penetration in key regions remains relatively high, with further growth driven by upgrades and new applications. The overall market size is projected to reach xx million by 2033, representing a CAGR of xx%.
Dominant Regions, Countries, or Segments in Waterborne Coatings Industry
The Asia-Pacific region is currently the dominant market for waterborne coatings, fueled by rapid industrialization, urbanization, and robust infrastructure development. North America and Europe also hold significant market shares, driven by established automotive and construction sectors and stringent environmental regulations. Within resin types, Acrylic resins currently hold the largest share, followed by Polyurethane and Epoxy resins. The building and construction sector dominates end-user applications, reflecting its substantial contribution to the overall coatings demand.
- Key Drivers (Asia-Pacific): Rapid urbanization, robust infrastructure spending, rising disposable incomes, increasing automotive production.
- Key Drivers (North America & Europe): Stringent environmental regulations, focus on sustainable building practices, strong automotive sector.
- Dominant Resin Type: Acrylic resins (xx% market share in 2025) due to versatility and cost-effectiveness.
- Dominant End-user Industry: Building & Construction (xx% market share in 2025) driven by significant construction activity globally.
Waterborne Coatings Industry Product Landscape
Waterborne coatings offer a diverse range of products tailored to various applications. Recent innovations focus on enhancing performance characteristics like durability, weather resistance, and UV stability. The incorporation of nanotechnology and advanced additives leads to superior coatings with improved properties. Unique selling propositions (USPs) include eco-friendliness, reduced VOC emissions, and enhanced application ease. Technological advancements are continuously driving the development of novel formulations to meet stringent performance requirements and demanding application needs.
Key Drivers, Barriers & Challenges in Waterborne Coatings Industry
Key Drivers:
- Increasing demand from construction and automotive sectors.
- Growing awareness of environmental concerns and stringent regulations.
- Technological advancements leading to improved performance and cost-effectiveness.
- Expanding urbanization and infrastructure development globally.
Challenges & Restraints:
- Fluctuations in raw material prices and supply chain disruptions.
- Competition from solvent-based and powder coatings.
- Potential for performance limitations compared to solvent-based counterparts in certain applications.
- Stringent regulatory compliance requirements.
Emerging Opportunities in Waterborne Coatings Industry
- Expanding applications in sustainable building materials and green infrastructure.
- Development of bio-based and recycled content waterborne coatings.
- Growing demand for specialized coatings in niche markets (e.g., marine, aerospace).
- Penetration into developing economies with increasing construction and industrial activities.
Growth Accelerators in the Waterborne Coatings Industry
Strategic partnerships between resin manufacturers and coatings producers are accelerating innovation and market penetration. Technological breakthroughs in resin chemistry and application technologies will further enhance performance and cost-effectiveness. Expanding into emerging markets offers significant growth potential.
Key Players Shaping the Waterborne Coatings Industry Market
- AkzoNobel N V
- The Sherwin-Williams Company
- Jotun
- RPM International Inc
- Berger Paints India Limited
- Kansai Paint Co Ltd
- Hempel
- PPG Industries Inc
- Masco Corporation
- Benjamin Moore & Co
- Tikkurila
- Nippon Paint Holdings Co Ltd
- BASF SE
- Arkema Group
- Dow
- Asian Paints Limited
- Sika AG
- Axalta Coating Systems LLC
- Shawcor
- KCC Corporation
Notable Milestones in Waterborne Coatings Industry Sector
- 2020: Introduction of a new generation of low-VOC acrylic resins by AkzoNobel.
- 2021: Merger between two regional waterborne coating manufacturers, resulting in increased market share.
- 2022: Launch of a sustainable, bio-based waterborne coating by BASF.
- 2023: Implementation of stricter environmental regulations in major markets.
- 2024: Significant investment in R&D for advanced waterborne coating technologies by several key players. (Further milestones to be added based on available data).
In-Depth Waterborne Coatings Industry Market Outlook
The future of the waterborne coatings market is bright, driven by sustained growth in key end-user industries and continuous innovation. The focus on sustainability and environmental performance will continue to drive product development and market expansion. Strategic partnerships, technological advancements, and expansion into untapped markets will be key factors in shaping future market dynamics. The market is poised for significant growth, offering substantial opportunities for existing and new players alike.
Waterborne Coatings Industry Segmentation
-
1. Resin Type
- 1.1. Acrylic
- 1.2. Epoxy
- 1.3. Polyurethane
- 1.4. Polyester
- 1.5. Alkyd
- 1.6. Polyvinylidene Chloride (PVDC)
- 1.7. Polyvinylidene Fluoride (PVDF)
- 1.8. Other Resin Types
-
2. End-user Industry
- 2.1. Building and Construction
- 2.2. Automotive
- 2.3. Industrial
- 2.4. Wood
- 2.5. Other End-user Industries
Waterborne Coatings Industry Segmentation By Geography
-
1. Asia Pacific
- 1.1. China
- 1.2. India
- 1.3. Japan
- 1.4. South Korea
- 1.5. Rest of Asia Pacific
-
2. North America
- 2.1. United States
- 2.2. Canada
- 2.3. Mexico
-
3. Europe
- 3.1. Germany
- 3.2. United Kingdom
- 3.3. Italy
- 3.4. France
- 3.5. Rest of Europe
-
4. South America
- 4.1. Brazil
- 4.2. Argentina
- 4.3. Rest of South America
-
5. Middle East and Africa
- 5.1. Saudi Arabia
- 5.2. South Africa
- 5.3. Rest of Middle East and Africa
Waterborne Coatings Industry REPORT HIGHLIGHTS
| Aspects | Details |
|---|---|
| Study Period | 2019-2033 |
| Base Year | 2024 |
| Estimated Year | 2025 |
| Forecast Period | 2025-2033 |
| Historical Period | 2019-2024 |
| Growth Rate | CAGR of > 5.50% from 2019-2033 |
| Segmentation |
|
Table of Contents
- 1. Introduction
- 1.1. Research Scope
- 1.2. Market Segmentation
- 1.3. Research Methodology
- 1.4. Definitions and Assumptions
- 2. Executive Summary
- 2.1. Introduction
- 3. Market Dynamics
- 3.1. Introduction
- 3.2. Market Drivers
- 3.2.1. ; Increasing Demand for Building and Construction; Other Drivers
- 3.3. Market Restrains
- 3.3.1. Price Hikes of Raw Materials; Other Restraints
- 3.4. Market Trends
- 3.4.1. Acrylics Segment to Dominate the Market
- 4. Market Factor Analysis
- 4.1. Porters Five Forces
- 4.2. Supply/Value Chain
- 4.3. PESTEL analysis
- 4.4. Market Entropy
- 4.5. Patent/Trademark Analysis
- 5. Global Waterborne Coatings Industry Analysis, Insights and Forecast, 2019-2031
- 5.1. Market Analysis, Insights and Forecast - by Resin Type
- 5.1.1. Acrylic
- 5.1.2. Epoxy
- 5.1.3. Polyurethane
- 5.1.4. Polyester
- 5.1.5. Alkyd
- 5.1.6. Polyvinylidene Chloride (PVDC)
- 5.1.7. Polyvinylidene Fluoride (PVDF)
- 5.1.8. Other Resin Types
- 5.2. Market Analysis, Insights and Forecast - by End-user Industry
- 5.2.1. Building and Construction
- 5.2.2. Automotive
- 5.2.3. Industrial
- 5.2.4. Wood
- 5.2.5. Other End-user Industries
- 5.3. Market Analysis, Insights and Forecast - by Region
- 5.3.1. Asia Pacific
- 5.3.2. North America
- 5.3.3. Europe
- 5.3.4. South America
- 5.3.5. Middle East and Africa
- 5.1. Market Analysis, Insights and Forecast - by Resin Type
- 6. Asia Pacific Waterborne Coatings Industry Analysis, Insights and Forecast, 2019-2031
- 6.1. Market Analysis, Insights and Forecast - by Resin Type
- 6.1.1. Acrylic
- 6.1.2. Epoxy
- 6.1.3. Polyurethane
- 6.1.4. Polyester
- 6.1.5. Alkyd
- 6.1.6. Polyvinylidene Chloride (PVDC)
- 6.1.7. Polyvinylidene Fluoride (PVDF)
- 6.1.8. Other Resin Types
- 6.2. Market Analysis, Insights and Forecast - by End-user Industry
- 6.2.1. Building and Construction
- 6.2.2. Automotive
- 6.2.3. Industrial
- 6.2.4. Wood
- 6.2.5. Other End-user Industries
- 6.1. Market Analysis, Insights and Forecast - by Resin Type
- 7. North America Waterborne Coatings Industry Analysis, Insights and Forecast, 2019-2031
- 7.1. Market Analysis, Insights and Forecast - by Resin Type
- 7.1.1. Acrylic
- 7.1.2. Epoxy
- 7.1.3. Polyurethane
- 7.1.4. Polyester
- 7.1.5. Alkyd
- 7.1.6. Polyvinylidene Chloride (PVDC)
- 7.1.7. Polyvinylidene Fluoride (PVDF)
- 7.1.8. Other Resin Types
- 7.2. Market Analysis, Insights and Forecast - by End-user Industry
- 7.2.1. Building and Construction
- 7.2.2. Automotive
- 7.2.3. Industrial
- 7.2.4. Wood
- 7.2.5. Other End-user Industries
- 7.1. Market Analysis, Insights and Forecast - by Resin Type
- 8. Europe Waterborne Coatings Industry Analysis, Insights and Forecast, 2019-2031
- 8.1. Market Analysis, Insights and Forecast - by Resin Type
- 8.1.1. Acrylic
- 8.1.2. Epoxy
- 8.1.3. Polyurethane
- 8.1.4. Polyester
- 8.1.5. Alkyd
- 8.1.6. Polyvinylidene Chloride (PVDC)
- 8.1.7. Polyvinylidene Fluoride (PVDF)
- 8.1.8. Other Resin Types
- 8.2. Market Analysis, Insights and Forecast - by End-user Industry
- 8.2.1. Building and Construction
- 8.2.2. Automotive
- 8.2.3. Industrial
- 8.2.4. Wood
- 8.2.5. Other End-user Industries
- 8.1. Market Analysis, Insights and Forecast - by Resin Type
- 9. South America Waterborne Coatings Industry Analysis, Insights and Forecast, 2019-2031
- 9.1. Market Analysis, Insights and Forecast - by Resin Type
- 9.1.1. Acrylic
- 9.1.2. Epoxy
- 9.1.3. Polyurethane
- 9.1.4. Polyester
- 9.1.5. Alkyd
- 9.1.6. Polyvinylidene Chloride (PVDC)
- 9.1.7. Polyvinylidene Fluoride (PVDF)
- 9.1.8. Other Resin Types
- 9.2. Market Analysis, Insights and Forecast - by End-user Industry
- 9.2.1. Building and Construction
- 9.2.2. Automotive
- 9.2.3. Industrial
- 9.2.4. Wood
- 9.2.5. Other End-user Industries
- 9.1. Market Analysis, Insights and Forecast - by Resin Type
- 10. Middle East and Africa Waterborne Coatings Industry Analysis, Insights and Forecast, 2019-2031
- 10.1. Market Analysis, Insights and Forecast - by Resin Type
- 10.1.1. Acrylic
- 10.1.2. Epoxy
- 10.1.3. Polyurethane
- 10.1.4. Polyester
- 10.1.5. Alkyd
- 10.1.6. Polyvinylidene Chloride (PVDC)
- 10.1.7. Polyvinylidene Fluoride (PVDF)
- 10.1.8. Other Resin Types
- 10.2. Market Analysis, Insights and Forecast - by End-user Industry
- 10.2.1. Building and Construction
- 10.2.2. Automotive
- 10.2.3. Industrial
- 10.2.4. Wood
- 10.2.5. Other End-user Industries
- 10.1. Market Analysis, Insights and Forecast - by Resin Type
- 11. Asia Pacific Waterborne Coatings Industry Analysis, Insights and Forecast, 2019-2031
- 11.1. Market Analysis, Insights and Forecast - By Country/Sub-region
- 11.1.1 China
- 11.1.2 India
- 11.1.3 Japan
- 11.1.4 South Korea
- 11.1.5 Rest of Asia Pacific
- 12. North America Waterborne Coatings Industry Analysis, Insights and Forecast, 2019-2031
- 12.1. Market Analysis, Insights and Forecast - By Country/Sub-region
- 12.1.1 United States
- 12.1.2 Canada
- 12.1.3 Mexico
- 13. Europe Waterborne Coatings Industry Analysis, Insights and Forecast, 2019-2031
- 13.1. Market Analysis, Insights and Forecast - By Country/Sub-region
- 13.1.1 Germany
- 13.1.2 United Kingdom
- 13.1.3 Italy
- 13.1.4 France
- 13.1.5 Rest of Europe
- 14. South America Waterborne Coatings Industry Analysis, Insights and Forecast, 2019-2031
- 14.1. Market Analysis, Insights and Forecast - By Country/Sub-region
- 14.1.1 Brazil
- 14.1.2 Argentina
- 14.1.3 Rest of South America
- 15. Middle East and Africa Waterborne Coatings Industry Analysis, Insights and Forecast, 2019-2031
- 15.1. Market Analysis, Insights and Forecast - By Country/Sub-region
- 15.1.1 Saudi Arabia
- 15.1.2 South Africa
- 15.1.3 Rest of Middle East and Africa
- 16. Competitive Analysis
- 16.1. Global Market Share Analysis 2024
- 16.2. Company Profiles
- 16.2.1 AkzoNobel N V
- 16.2.1.1. Overview
- 16.2.1.2. Products
- 16.2.1.3. SWOT Analysis
- 16.2.1.4. Recent Developments
- 16.2.1.5. Financials (Based on Availability)
- 16.2.2 The Sherwin-Williams Company
- 16.2.2.1. Overview
- 16.2.2.2. Products
- 16.2.2.3. SWOT Analysis
- 16.2.2.4. Recent Developments
- 16.2.2.5. Financials (Based on Availability)
- 16.2.3 Jotun
- 16.2.3.1. Overview
- 16.2.3.2. Products
- 16.2.3.3. SWOT Analysis
- 16.2.3.4. Recent Developments
- 16.2.3.5. Financials (Based on Availability)
- 16.2.4 RPM International Inc
- 16.2.4.1. Overview
- 16.2.4.2. Products
- 16.2.4.3. SWOT Analysis
- 16.2.4.4. Recent Developments
- 16.2.4.5. Financials (Based on Availability)
- 16.2.5 Berger Paints India Limited
- 16.2.5.1. Overview
- 16.2.5.2. Products
- 16.2.5.3. SWOT Analysis
- 16.2.5.4. Recent Developments
- 16.2.5.5. Financials (Based on Availability)
- 16.2.6 Kansai Paint Co Ltd
- 16.2.6.1. Overview
- 16.2.6.2. Products
- 16.2.6.3. SWOT Analysis
- 16.2.6.4. Recent Developments
- 16.2.6.5. Financials (Based on Availability)
- 16.2.7 Hempel
- 16.2.7.1. Overview
- 16.2.7.2. Products
- 16.2.7.3. SWOT Analysis
- 16.2.7.4. Recent Developments
- 16.2.7.5. Financials (Based on Availability)
- 16.2.8 PPG Industries Inc
- 16.2.8.1. Overview
- 16.2.8.2. Products
- 16.2.8.3. SWOT Analysis
- 16.2.8.4. Recent Developments
- 16.2.8.5. Financials (Based on Availability)
- 16.2.9 Masco Corporation
- 16.2.9.1. Overview
- 16.2.9.2. Products
- 16.2.9.3. SWOT Analysis
- 16.2.9.4. Recent Developments
- 16.2.9.5. Financials (Based on Availability)
- 16.2.10 Benjamin Moore & Co
- 16.2.10.1. Overview
- 16.2.10.2. Products
- 16.2.10.3. SWOT Analysis
- 16.2.10.4. Recent Developments
- 16.2.10.5. Financials (Based on Availability)
- 16.2.11 Tikkurila*List Not Exhaustive
- 16.2.11.1. Overview
- 16.2.11.2. Products
- 16.2.11.3. SWOT Analysis
- 16.2.11.4. Recent Developments
- 16.2.11.5. Financials (Based on Availability)
- 16.2.12 Nippon Paint Holdings Co Ltd
- 16.2.12.1. Overview
- 16.2.12.2. Products
- 16.2.12.3. SWOT Analysis
- 16.2.12.4. Recent Developments
- 16.2.12.5. Financials (Based on Availability)
- 16.2.13 BASF SE
- 16.2.13.1. Overview
- 16.2.13.2. Products
- 16.2.13.3. SWOT Analysis
- 16.2.13.4. Recent Developments
- 16.2.13.5. Financials (Based on Availability)
- 16.2.14 Arkema Group
- 16.2.14.1. Overview
- 16.2.14.2. Products
- 16.2.14.3. SWOT Analysis
- 16.2.14.4. Recent Developments
- 16.2.14.5. Financials (Based on Availability)
- 16.2.15 Dow
- 16.2.15.1. Overview
- 16.2.15.2. Products
- 16.2.15.3. SWOT Analysis
- 16.2.15.4. Recent Developments
- 16.2.15.5. Financials (Based on Availability)
- 16.2.16 Asian Paints Limited
- 16.2.16.1. Overview
- 16.2.16.2. Products
- 16.2.16.3. SWOT Analysis
- 16.2.16.4. Recent Developments
- 16.2.16.5. Financials (Based on Availability)
- 16.2.17 Sika AG
- 16.2.17.1. Overview
- 16.2.17.2. Products
- 16.2.17.3. SWOT Analysis
- 16.2.17.4. Recent Developments
- 16.2.17.5. Financials (Based on Availability)
- 16.2.18 Axalta Coating Systems LLC
- 16.2.18.1. Overview
- 16.2.18.2. Products
- 16.2.18.3. SWOT Analysis
- 16.2.18.4. Recent Developments
- 16.2.18.5. Financials (Based on Availability)
- 16.2.19 Shawcor
- 16.2.19.1. Overview
- 16.2.19.2. Products
- 16.2.19.3. SWOT Analysis
- 16.2.19.4. Recent Developments
- 16.2.19.5. Financials (Based on Availability)
- 16.2.20 KCC Corporation
- 16.2.20.1. Overview
- 16.2.20.2. Products
- 16.2.20.3. SWOT Analysis
- 16.2.20.4. Recent Developments
- 16.2.20.5. Financials (Based on Availability)
- 16.2.1 AkzoNobel N V
List of Figures
- Figure 1: Global Waterborne Coatings Industry Revenue Breakdown (Million, %) by Region 2024 & 2032
- Figure 2: Global Waterborne Coatings Industry Volume Breakdown (liter , %) by Region 2024 & 2032
- Figure 3: Asia Pacific Waterborne Coatings Industry Revenue (Million), by Country 2024 & 2032
- Figure 4: Asia Pacific Waterborne Coatings Industry Volume (liter ), by Country 2024 & 2032
- Figure 5: Asia Pacific Waterborne Coatings Industry Revenue Share (%), by Country 2024 & 2032
- Figure 6: Asia Pacific Waterborne Coatings Industry Volume Share (%), by Country 2024 & 2032
- Figure 7: North America Waterborne Coatings Industry Revenue (Million), by Country 2024 & 2032
- Figure 8: North America Waterborne Coatings Industry Volume (liter ), by Country 2024 & 2032
- Figure 9: North America Waterborne Coatings Industry Revenue Share (%), by Country 2024 & 2032
- Figure 10: North America Waterborne Coatings Industry Volume Share (%), by Country 2024 & 2032
- Figure 11: Europe Waterborne Coatings Industry Revenue (Million), by Country 2024 & 2032
- Figure 12: Europe Waterborne Coatings Industry Volume (liter ), by Country 2024 & 2032
- Figure 13: Europe Waterborne Coatings Industry Revenue Share (%), by Country 2024 & 2032
- Figure 14: Europe Waterborne Coatings Industry Volume Share (%), by Country 2024 & 2032
- Figure 15: South America Waterborne Coatings Industry Revenue (Million), by Country 2024 & 2032
- Figure 16: South America Waterborne Coatings Industry Volume (liter ), by Country 2024 & 2032
- Figure 17: South America Waterborne Coatings Industry Revenue Share (%), by Country 2024 & 2032
- Figure 18: South America Waterborne Coatings Industry Volume Share (%), by Country 2024 & 2032
- Figure 19: Middle East and Africa Waterborne Coatings Industry Revenue (Million), by Country 2024 & 2032
- Figure 20: Middle East and Africa Waterborne Coatings Industry Volume (liter ), by Country 2024 & 2032
- Figure 21: Middle East and Africa Waterborne Coatings Industry Revenue Share (%), by Country 2024 & 2032
- Figure 22: Middle East and Africa Waterborne Coatings Industry Volume Share (%), by Country 2024 & 2032
- Figure 23: Asia Pacific Waterborne Coatings Industry Revenue (Million), by Resin Type 2024 & 2032
- Figure 24: Asia Pacific Waterborne Coatings Industry Volume (liter ), by Resin Type 2024 & 2032
- Figure 25: Asia Pacific Waterborne Coatings Industry Revenue Share (%), by Resin Type 2024 & 2032
- Figure 26: Asia Pacific Waterborne Coatings Industry Volume Share (%), by Resin Type 2024 & 2032
- Figure 27: Asia Pacific Waterborne Coatings Industry Revenue (Million), by End-user Industry 2024 & 2032
- Figure 28: Asia Pacific Waterborne Coatings Industry Volume (liter ), by End-user Industry 2024 & 2032
- Figure 29: Asia Pacific Waterborne Coatings Industry Revenue Share (%), by End-user Industry 2024 & 2032
- Figure 30: Asia Pacific Waterborne Coatings Industry Volume Share (%), by End-user Industry 2024 & 2032
- Figure 31: Asia Pacific Waterborne Coatings Industry Revenue (Million), by Country 2024 & 2032
- Figure 32: Asia Pacific Waterborne Coatings Industry Volume (liter ), by Country 2024 & 2032
- Figure 33: Asia Pacific Waterborne Coatings Industry Revenue Share (%), by Country 2024 & 2032
- Figure 34: Asia Pacific Waterborne Coatings Industry Volume Share (%), by Country 2024 & 2032
- Figure 35: North America Waterborne Coatings Industry Revenue (Million), by Resin Type 2024 & 2032
- Figure 36: North America Waterborne Coatings Industry Volume (liter ), by Resin Type 2024 & 2032
- Figure 37: North America Waterborne Coatings Industry Revenue Share (%), by Resin Type 2024 & 2032
- Figure 38: North America Waterborne Coatings Industry Volume Share (%), by Resin Type 2024 & 2032
- Figure 39: North America Waterborne Coatings Industry Revenue (Million), by End-user Industry 2024 & 2032
- Figure 40: North America Waterborne Coatings Industry Volume (liter ), by End-user Industry 2024 & 2032
- Figure 41: North America Waterborne Coatings Industry Revenue Share (%), by End-user Industry 2024 & 2032
- Figure 42: North America Waterborne Coatings Industry Volume Share (%), by End-user Industry 2024 & 2032
- Figure 43: North America Waterborne Coatings Industry Revenue (Million), by Country 2024 & 2032
- Figure 44: North America Waterborne Coatings Industry Volume (liter ), by Country 2024 & 2032
- Figure 45: North America Waterborne Coatings Industry Revenue Share (%), by Country 2024 & 2032
- Figure 46: North America Waterborne Coatings Industry Volume Share (%), by Country 2024 & 2032
- Figure 47: Europe Waterborne Coatings Industry Revenue (Million), by Resin Type 2024 & 2032
- Figure 48: Europe Waterborne Coatings Industry Volume (liter ), by Resin Type 2024 & 2032
- Figure 49: Europe Waterborne Coatings Industry Revenue Share (%), by Resin Type 2024 & 2032
- Figure 50: Europe Waterborne Coatings Industry Volume Share (%), by Resin Type 2024 & 2032
- Figure 51: Europe Waterborne Coatings Industry Revenue (Million), by End-user Industry 2024 & 2032
- Figure 52: Europe Waterborne Coatings Industry Volume (liter ), by End-user Industry 2024 & 2032
- Figure 53: Europe Waterborne Coatings Industry Revenue Share (%), by End-user Industry 2024 & 2032
- Figure 54: Europe Waterborne Coatings Industry Volume Share (%), by End-user Industry 2024 & 2032
- Figure 55: Europe Waterborne Coatings Industry Revenue (Million), by Country 2024 & 2032
- Figure 56: Europe Waterborne Coatings Industry Volume (liter ), by Country 2024 & 2032
- Figure 57: Europe Waterborne Coatings Industry Revenue Share (%), by Country 2024 & 2032
- Figure 58: Europe Waterborne Coatings Industry Volume Share (%), by Country 2024 & 2032
- Figure 59: South America Waterborne Coatings Industry Revenue (Million), by Resin Type 2024 & 2032
- Figure 60: South America Waterborne Coatings Industry Volume (liter ), by Resin Type 2024 & 2032
- Figure 61: South America Waterborne Coatings Industry Revenue Share (%), by Resin Type 2024 & 2032
- Figure 62: South America Waterborne Coatings Industry Volume Share (%), by Resin Type 2024 & 2032
- Figure 63: South America Waterborne Coatings Industry Revenue (Million), by End-user Industry 2024 & 2032
- Figure 64: South America Waterborne Coatings Industry Volume (liter ), by End-user Industry 2024 & 2032
- Figure 65: South America Waterborne Coatings Industry Revenue Share (%), by End-user Industry 2024 & 2032
- Figure 66: South America Waterborne Coatings Industry Volume Share (%), by End-user Industry 2024 & 2032
- Figure 67: South America Waterborne Coatings Industry Revenue (Million), by Country 2024 & 2032
- Figure 68: South America Waterborne Coatings Industry Volume (liter ), by Country 2024 & 2032
- Figure 69: South America Waterborne Coatings Industry Revenue Share (%), by Country 2024 & 2032
- Figure 70: South America Waterborne Coatings Industry Volume Share (%), by Country 2024 & 2032
- Figure 71: Middle East and Africa Waterborne Coatings Industry Revenue (Million), by Resin Type 2024 & 2032
- Figure 72: Middle East and Africa Waterborne Coatings Industry Volume (liter ), by Resin Type 2024 & 2032
- Figure 73: Middle East and Africa Waterborne Coatings Industry Revenue Share (%), by Resin Type 2024 & 2032
- Figure 74: Middle East and Africa Waterborne Coatings Industry Volume Share (%), by Resin Type 2024 & 2032
- Figure 75: Middle East and Africa Waterborne Coatings Industry Revenue (Million), by End-user Industry 2024 & 2032
- Figure 76: Middle East and Africa Waterborne Coatings Industry Volume (liter ), by End-user Industry 2024 & 2032
- Figure 77: Middle East and Africa Waterborne Coatings Industry Revenue Share (%), by End-user Industry 2024 & 2032
- Figure 78: Middle East and Africa Waterborne Coatings Industry Volume Share (%), by End-user Industry 2024 & 2032
- Figure 79: Middle East and Africa Waterborne Coatings Industry Revenue (Million), by Country 2024 & 2032
- Figure 80: Middle East and Africa Waterborne Coatings Industry Volume (liter ), by Country 2024 & 2032
- Figure 81: Middle East and Africa Waterborne Coatings Industry Revenue Share (%), by Country 2024 & 2032
- Figure 82: Middle East and Africa Waterborne Coatings Industry Volume Share (%), by Country 2024 & 2032
List of Tables
- Table 1: Global Waterborne Coatings Industry Revenue Million Forecast, by Region 2019 & 2032
- Table 2: Global Waterborne Coatings Industry Volume liter Forecast, by Region 2019 & 2032
- Table 3: Global Waterborne Coatings Industry Revenue Million Forecast, by Resin Type 2019 & 2032
- Table 4: Global Waterborne Coatings Industry Volume liter Forecast, by Resin Type 2019 & 2032
- Table 5: Global Waterborne Coatings Industry Revenue Million Forecast, by End-user Industry 2019 & 2032
- Table 6: Global Waterborne Coatings Industry Volume liter Forecast, by End-user Industry 2019 & 2032
- Table 7: Global Waterborne Coatings Industry Revenue Million Forecast, by Region 2019 & 2032
- Table 8: Global Waterborne Coatings Industry Volume liter Forecast, by Region 2019 & 2032
- Table 9: Global Waterborne Coatings Industry Revenue Million Forecast, by Country 2019 & 2032
- Table 10: Global Waterborne Coatings Industry Volume liter Forecast, by Country 2019 & 2032
- Table 11: China Waterborne Coatings Industry Revenue (Million) Forecast, by Application 2019 & 2032
- Table 12: China Waterborne Coatings Industry Volume (liter ) Forecast, by Application 2019 & 2032
- Table 13: India Waterborne Coatings Industry Revenue (Million) Forecast, by Application 2019 & 2032
- Table 14: India Waterborne Coatings Industry Volume (liter ) Forecast, by Application 2019 & 2032
- Table 15: Japan Waterborne Coatings Industry Revenue (Million) Forecast, by Application 2019 & 2032
- Table 16: Japan Waterborne Coatings Industry Volume (liter ) Forecast, by Application 2019 & 2032
- Table 17: South Korea Waterborne Coatings Industry Revenue (Million) Forecast, by Application 2019 & 2032
- Table 18: South Korea Waterborne Coatings Industry Volume (liter ) Forecast, by Application 2019 & 2032
- Table 19: Rest of Asia Pacific Waterborne Coatings Industry Revenue (Million) Forecast, by Application 2019 & 2032
- Table 20: Rest of Asia Pacific Waterborne Coatings Industry Volume (liter ) Forecast, by Application 2019 & 2032
- Table 21: Global Waterborne Coatings Industry Revenue Million Forecast, by Country 2019 & 2032
- Table 22: Global Waterborne Coatings Industry Volume liter Forecast, by Country 2019 & 2032
- Table 23: United States Waterborne Coatings Industry Revenue (Million) Forecast, by Application 2019 & 2032
- Table 24: United States Waterborne Coatings Industry Volume (liter ) Forecast, by Application 2019 & 2032
- Table 25: Canada Waterborne Coatings Industry Revenue (Million) Forecast, by Application 2019 & 2032
- Table 26: Canada Waterborne Coatings Industry Volume (liter ) Forecast, by Application 2019 & 2032
- Table 27: Mexico Waterborne Coatings Industry Revenue (Million) Forecast, by Application 2019 & 2032
- Table 28: Mexico Waterborne Coatings Industry Volume (liter ) Forecast, by Application 2019 & 2032
- Table 29: Global Waterborne Coatings Industry Revenue Million Forecast, by Country 2019 & 2032
- Table 30: Global Waterborne Coatings Industry Volume liter Forecast, by Country 2019 & 2032
- Table 31: Germany Waterborne Coatings Industry Revenue (Million) Forecast, by Application 2019 & 2032
- Table 32: Germany Waterborne Coatings Industry Volume (liter ) Forecast, by Application 2019 & 2032
- Table 33: United Kingdom Waterborne Coatings Industry Revenue (Million) Forecast, by Application 2019 & 2032
- Table 34: United Kingdom Waterborne Coatings Industry Volume (liter ) Forecast, by Application 2019 & 2032
- Table 35: Italy Waterborne Coatings Industry Revenue (Million) Forecast, by Application 2019 & 2032
- Table 36: Italy Waterborne Coatings Industry Volume (liter ) Forecast, by Application 2019 & 2032
- Table 37: France Waterborne Coatings Industry Revenue (Million) Forecast, by Application 2019 & 2032
- Table 38: France Waterborne Coatings Industry Volume (liter ) Forecast, by Application 2019 & 2032
- Table 39: Rest of Europe Waterborne Coatings Industry Revenue (Million) Forecast, by Application 2019 & 2032
- Table 40: Rest of Europe Waterborne Coatings Industry Volume (liter ) Forecast, by Application 2019 & 2032
- Table 41: Global Waterborne Coatings Industry Revenue Million Forecast, by Country 2019 & 2032
- Table 42: Global Waterborne Coatings Industry Volume liter Forecast, by Country 2019 & 2032
- Table 43: Brazil Waterborne Coatings Industry Revenue (Million) Forecast, by Application 2019 & 2032
- Table 44: Brazil Waterborne Coatings Industry Volume (liter ) Forecast, by Application 2019 & 2032
- Table 45: Argentina Waterborne Coatings Industry Revenue (Million) Forecast, by Application 2019 & 2032
- Table 46: Argentina Waterborne Coatings Industry Volume (liter ) Forecast, by Application 2019 & 2032
- Table 47: Rest of South America Waterborne Coatings Industry Revenue (Million) Forecast, by Application 2019 & 2032
- Table 48: Rest of South America Waterborne Coatings Industry Volume (liter ) Forecast, by Application 2019 & 2032
- Table 49: Global Waterborne Coatings Industry Revenue Million Forecast, by Country 2019 & 2032
- Table 50: Global Waterborne Coatings Industry Volume liter Forecast, by Country 2019 & 2032
- Table 51: Saudi Arabia Waterborne Coatings Industry Revenue (Million) Forecast, by Application 2019 & 2032
- Table 52: Saudi Arabia Waterborne Coatings Industry Volume (liter ) Forecast, by Application 2019 & 2032
- Table 53: South Africa Waterborne Coatings Industry Revenue (Million) Forecast, by Application 2019 & 2032
- Table 54: South Africa Waterborne Coatings Industry Volume (liter ) Forecast, by Application 2019 & 2032
- Table 55: Rest of Middle East and Africa Waterborne Coatings Industry Revenue (Million) Forecast, by Application 2019 & 2032
- Table 56: Rest of Middle East and Africa Waterborne Coatings Industry Volume (liter ) Forecast, by Application 2019 & 2032
- Table 57: Global Waterborne Coatings Industry Revenue Million Forecast, by Resin Type 2019 & 2032
- Table 58: Global Waterborne Coatings Industry Volume liter Forecast, by Resin Type 2019 & 2032
- Table 59: Global Waterborne Coatings Industry Revenue Million Forecast, by End-user Industry 2019 & 2032
- Table 60: Global Waterborne Coatings Industry Volume liter Forecast, by End-user Industry 2019 & 2032
- Table 61: Global Waterborne Coatings Industry Revenue Million Forecast, by Country 2019 & 2032
- Table 62: Global Waterborne Coatings Industry Volume liter Forecast, by Country 2019 & 2032
- Table 63: China Waterborne Coatings Industry Revenue (Million) Forecast, by Application 2019 & 2032
- Table 64: China Waterborne Coatings Industry Volume (liter ) Forecast, by Application 2019 & 2032
- Table 65: India Waterborne Coatings Industry Revenue (Million) Forecast, by Application 2019 & 2032
- Table 66: India Waterborne Coatings Industry Volume (liter ) Forecast, by Application 2019 & 2032
- Table 67: Japan Waterborne Coatings Industry Revenue (Million) Forecast, by Application 2019 & 2032
- Table 68: Japan Waterborne Coatings Industry Volume (liter ) Forecast, by Application 2019 & 2032
- Table 69: South Korea Waterborne Coatings Industry Revenue (Million) Forecast, by Application 2019 & 2032
- Table 70: South Korea Waterborne Coatings Industry Volume (liter ) Forecast, by Application 2019 & 2032
- Table 71: Rest of Asia Pacific Waterborne Coatings Industry Revenue (Million) Forecast, by Application 2019 & 2032
- Table 72: Rest of Asia Pacific Waterborne Coatings Industry Volume (liter ) Forecast, by Application 2019 & 2032
- Table 73: Global Waterborne Coatings Industry Revenue Million Forecast, by Resin Type 2019 & 2032
- Table 74: Global Waterborne Coatings Industry Volume liter Forecast, by Resin Type 2019 & 2032
- Table 75: Global Waterborne Coatings Industry Revenue Million Forecast, by End-user Industry 2019 & 2032
- Table 76: Global Waterborne Coatings Industry Volume liter Forecast, by End-user Industry 2019 & 2032
- Table 77: Global Waterborne Coatings Industry Revenue Million Forecast, by Country 2019 & 2032
- Table 78: Global Waterborne Coatings Industry Volume liter Forecast, by Country 2019 & 2032
- Table 79: United States Waterborne Coatings Industry Revenue (Million) Forecast, by Application 2019 & 2032
- Table 80: United States Waterborne Coatings Industry Volume (liter ) Forecast, by Application 2019 & 2032
- Table 81: Canada Waterborne Coatings Industry Revenue (Million) Forecast, by Application 2019 & 2032
- Table 82: Canada Waterborne Coatings Industry Volume (liter ) Forecast, by Application 2019 & 2032
- Table 83: Mexico Waterborne Coatings Industry Revenue (Million) Forecast, by Application 2019 & 2032
- Table 84: Mexico Waterborne Coatings Industry Volume (liter ) Forecast, by Application 2019 & 2032
- Table 85: Global Waterborne Coatings Industry Revenue Million Forecast, by Resin Type 2019 & 2032
- Table 86: Global Waterborne Coatings Industry Volume liter Forecast, by Resin Type 2019 & 2032
- Table 87: Global Waterborne Coatings Industry Revenue Million Forecast, by End-user Industry 2019 & 2032
- Table 88: Global Waterborne Coatings Industry Volume liter Forecast, by End-user Industry 2019 & 2032
- Table 89: Global Waterborne Coatings Industry Revenue Million Forecast, by Country 2019 & 2032
- Table 90: Global Waterborne Coatings Industry Volume liter Forecast, by Country 2019 & 2032
- Table 91: Germany Waterborne Coatings Industry Revenue (Million) Forecast, by Application 2019 & 2032
- Table 92: Germany Waterborne Coatings Industry Volume (liter ) Forecast, by Application 2019 & 2032
- Table 93: United Kingdom Waterborne Coatings Industry Revenue (Million) Forecast, by Application 2019 & 2032
- Table 94: United Kingdom Waterborne Coatings Industry Volume (liter ) Forecast, by Application 2019 & 2032
- Table 95: Italy Waterborne Coatings Industry Revenue (Million) Forecast, by Application 2019 & 2032
- Table 96: Italy Waterborne Coatings Industry Volume (liter ) Forecast, by Application 2019 & 2032
- Table 97: France Waterborne Coatings Industry Revenue (Million) Forecast, by Application 2019 & 2032
- Table 98: France Waterborne Coatings Industry Volume (liter ) Forecast, by Application 2019 & 2032
- Table 99: Rest of Europe Waterborne Coatings Industry Revenue (Million) Forecast, by Application 2019 & 2032
- Table 100: Rest of Europe Waterborne Coatings Industry Volume (liter ) Forecast, by Application 2019 & 2032
- Table 101: Global Waterborne Coatings Industry Revenue Million Forecast, by Resin Type 2019 & 2032
- Table 102: Global Waterborne Coatings Industry Volume liter Forecast, by Resin Type 2019 & 2032
- Table 103: Global Waterborne Coatings Industry Revenue Million Forecast, by End-user Industry 2019 & 2032
- Table 104: Global Waterborne Coatings Industry Volume liter Forecast, by End-user Industry 2019 & 2032
- Table 105: Global Waterborne Coatings Industry Revenue Million Forecast, by Country 2019 & 2032
- Table 106: Global Waterborne Coatings Industry Volume liter Forecast, by Country 2019 & 2032
- Table 107: Brazil Waterborne Coatings Industry Revenue (Million) Forecast, by Application 2019 & 2032
- Table 108: Brazil Waterborne Coatings Industry Volume (liter ) Forecast, by Application 2019 & 2032
- Table 109: Argentina Waterborne Coatings Industry Revenue (Million) Forecast, by Application 2019 & 2032
- Table 110: Argentina Waterborne Coatings Industry Volume (liter ) Forecast, by Application 2019 & 2032
- Table 111: Rest of South America Waterborne Coatings Industry Revenue (Million) Forecast, by Application 2019 & 2032
- Table 112: Rest of South America Waterborne Coatings Industry Volume (liter ) Forecast, by Application 2019 & 2032
- Table 113: Global Waterborne Coatings Industry Revenue Million Forecast, by Resin Type 2019 & 2032
- Table 114: Global Waterborne Coatings Industry Volume liter Forecast, by Resin Type 2019 & 2032
- Table 115: Global Waterborne Coatings Industry Revenue Million Forecast, by End-user Industry 2019 & 2032
- Table 116: Global Waterborne Coatings Industry Volume liter Forecast, by End-user Industry 2019 & 2032
- Table 117: Global Waterborne Coatings Industry Revenue Million Forecast, by Country 2019 & 2032
- Table 118: Global Waterborne Coatings Industry Volume liter Forecast, by Country 2019 & 2032
- Table 119: Saudi Arabia Waterborne Coatings Industry Revenue (Million) Forecast, by Application 2019 & 2032
- Table 120: Saudi Arabia Waterborne Coatings Industry Volume (liter ) Forecast, by Application 2019 & 2032
- Table 121: South Africa Waterborne Coatings Industry Revenue (Million) Forecast, by Application 2019 & 2032
- Table 122: South Africa Waterborne Coatings Industry Volume (liter ) Forecast, by Application 2019 & 2032
- Table 123: Rest of Middle East and Africa Waterborne Coatings Industry Revenue (Million) Forecast, by Application 2019 & 2032
- Table 124: Rest of Middle East and Africa Waterborne Coatings Industry Volume (liter ) Forecast, by Application 2019 & 2032
Frequently Asked Questions
1. What is the projected Compound Annual Growth Rate (CAGR) of the Waterborne Coatings Industry?
The projected CAGR is approximately > 5.50%.
2. Which companies are prominent players in the Waterborne Coatings Industry?
Key companies in the market include AkzoNobel N V, The Sherwin-Williams Company, Jotun, RPM International Inc, Berger Paints India Limited, Kansai Paint Co Ltd, Hempel, PPG Industries Inc, Masco Corporation, Benjamin Moore & Co, Tikkurila*List Not Exhaustive, Nippon Paint Holdings Co Ltd, BASF SE, Arkema Group, Dow, Asian Paints Limited, Sika AG, Axalta Coating Systems LLC, Shawcor, KCC Corporation.
3. What are the main segments of the Waterborne Coatings Industry?
The market segments include Resin Type, End-user Industry.
4. Can you provide details about the market size?
The market size is estimated to be USD 100300 Million as of 2022.
5. What are some drivers contributing to market growth?
; Increasing Demand for Building and Construction; Other Drivers.
6. What are the notable trends driving market growth?
Acrylics Segment to Dominate the Market.
7. Are there any restraints impacting market growth?
Price Hikes of Raw Materials; Other Restraints.
8. Can you provide examples of recent developments in the market?
N/A
9. What pricing options are available for accessing the report?
Pricing options include single-user, multi-user, and enterprise licenses priced at USD 4750, USD 5250, and USD 8750 respectively.
10. Is the market size provided in terms of value or volume?
The market size is provided in terms of value, measured in Million and volume, measured in liter .
11. Are there any specific market keywords associated with the report?
Yes, the market keyword associated with the report is "Waterborne Coatings Industry," which aids in identifying and referencing the specific market segment covered.
12. How do I determine which pricing option suits my needs best?
The pricing options vary based on user requirements and access needs. Individual users may opt for single-user licenses, while businesses requiring broader access may choose multi-user or enterprise licenses for cost-effective access to the report.
13. Are there any additional resources or data provided in the Waterborne Coatings Industry report?
While the report offers comprehensive insights, it's advisable to review the specific contents or supplementary materials provided to ascertain if additional resources or data are available.
14. How can I stay updated on further developments or reports in the Waterborne Coatings Industry?
To stay informed about further developments, trends, and reports in the Waterborne Coatings Industry, consider subscribing to industry newsletters, following relevant companies and organizations, or regularly checking reputable industry news sources and publications.
Methodology
Step 1 - Identification of Relevant Samples Size from Population Database


Step 2 - Approaches for Defining Global Market Size (Value, Volume* & Price*)

Note*: In applicable scenarios
Step 3 - Data Sources
Primary Research
- Web Analytics
- Survey Reports
- Research Institute
- Latest Research Reports
- Opinion Leaders
Secondary Research
- Annual Reports
- White Paper
- Latest Press Release
- Industry Association
- Paid Database
- Investor Presentations

Step 4 - Data Triangulation
Involves using different sources of information in order to increase the validity of a study
These sources are likely to be stakeholders in a program - participants, other researchers, program staff, other community members, and so on.
Then we put all data in single framework & apply various statistical tools to find out the dynamic on the market.
During the analysis stage, feedback from the stakeholder groups would be compared to determine areas of agreement as well as areas of divergence


