
Key Insights
The global Stone Surface Plate market is poised for significant expansion, projected to reach a substantial market size of approximately $500 million by 2025, with an anticipated Compound Annual Growth Rate (CAGR) of around 6%. This growth is underpinned by robust demand from the industrial manufacturing sector, where precision is paramount for quality control and assembly processes. The increasing adoption of advanced manufacturing techniques, such as lean manufacturing and Industry 4.0 initiatives, further fuels the need for highly accurate and stable work surfaces offered by stone surface plates. Laboratory environments, critical for research and development, calibration, and scientific experiments, also represent a substantial and growing segment, driven by the expanding healthcare, electronics, and aerospace industries. The inherent properties of stone surface plates – their non-magnetic nature, resistance to wear and corrosion, and exceptional flatness – make them indispensable tools for ensuring the precision and reliability of various industrial and scientific endeavors.
Key market drivers for the Stone Surface Plate industry include the escalating demand for high-precision metrology equipment across diverse manufacturing sectors and a heightened emphasis on quality assurance protocols. Emerging trends indicate a growing preference for custom-designed stone surface plates tailored to specific application needs, alongside innovations in material science leading to enhanced durability and performance. However, the market faces certain restraints, including the initial high cost of investment for premium quality stone surface plates and the availability of alternative materials. Despite these challenges, the market's trajectory remains positive, propelled by continuous technological advancements and the unwavering requirement for precision in critical industrial and scientific applications. The competitive landscape features key players like Grizzly Industrial, CNC Specialty Store, and Precision Granite, actively innovating to meet evolving market demands across regions such as North America and Europe.
Stone Surface Plate Market Dynamics & Structure
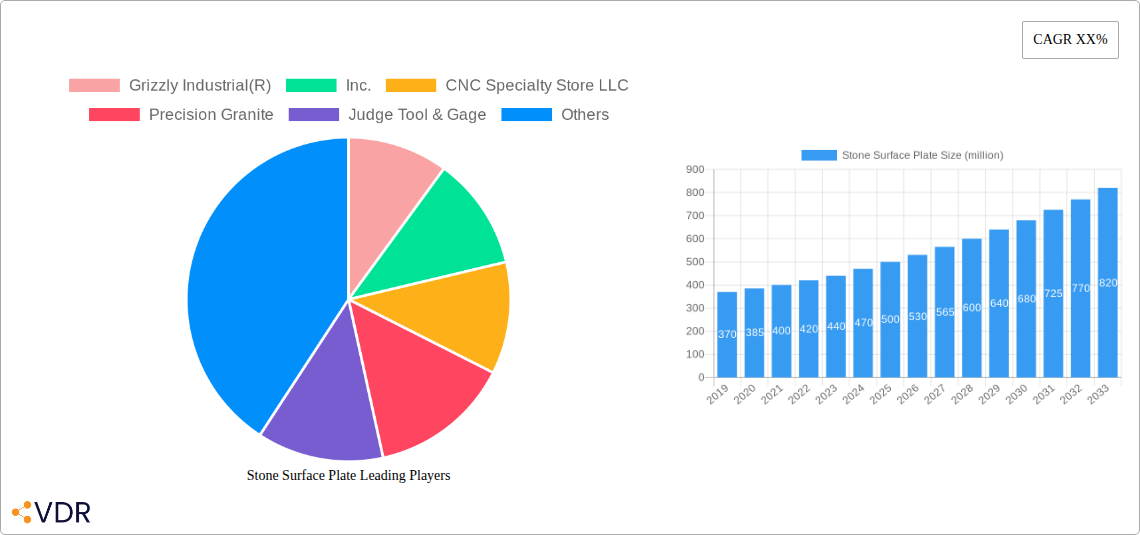
The global stone surface plate market exhibits a moderately concentrated structure, with key players like Grizzly Industrial(R),Inc., CNC Specialty Store LLC, and Precision Granite holding significant market shares. Technological innovation is a primary driver, with advancements in material science leading to enhanced accuracy, durability, and thermal stability of granite and other stone surface plates. Stringent regulatory frameworks, particularly concerning quality control and metrology standards in industries like aerospace and automotive, further shape market demands. Competitive product substitutes, such as cast iron surface plates and ceramic alternatives, pose a challenge, though stone plates generally offer superior flatness and resistance to warping. End-user demographics are diverse, spanning industrial manufacturing, laboratory environments, and precision engineering sectors. Merger and acquisition (M&A) trends are relatively low, indicating a stable competitive landscape, though strategic partnerships for distribution and technological integration are observed. The market for stone surface plates is projected to reach approximately $1,250 million by 2025, with a projected CAGR of around 4.8% from 2025-2033.
- Market Concentration: Moderately concentrated with dominant players and several regional manufacturers.
- Technological Innovation: Driven by material advancements, improved manufacturing techniques, and digital integration.
- Regulatory Frameworks: Standards such as ISO and DIN ensure product quality and performance.
- Competitive Substitutes: Cast iron, ceramic, and composite materials.
- End-User Demographics: Industrial manufacturing (approx. 60% of market), laboratory environments (approx. 30%), and others (approx. 10%).
- M&A Trends: Limited, but strategic partnerships are on the rise.
Stone Surface Plate Growth Trends & Insights
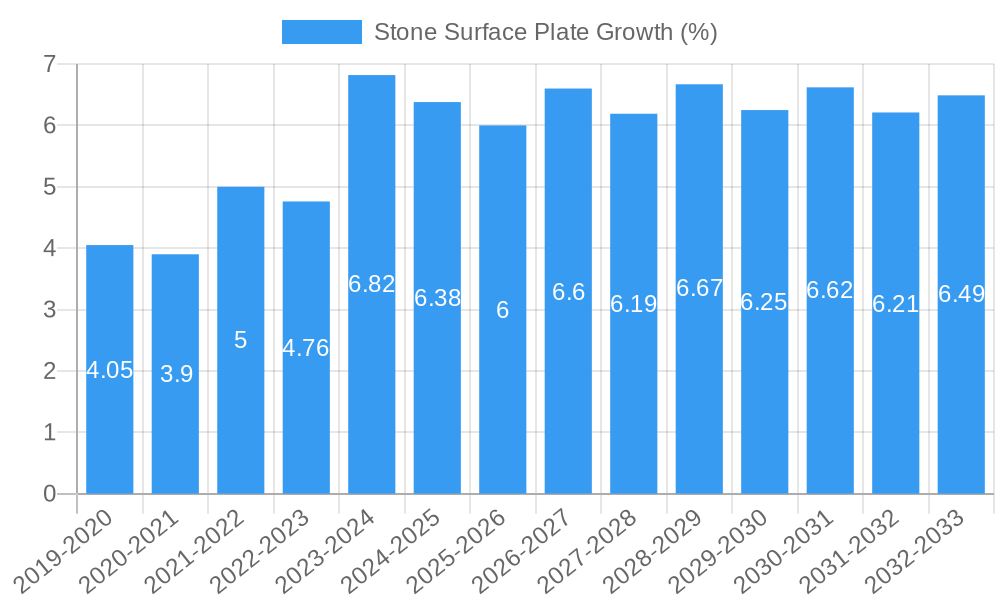
The global stone surface plate market is poised for robust growth, fueled by the increasing demand for precision measurement and quality control across various industries. From an estimated $1,250 million in 2025, the market is anticipated to expand significantly over the forecast period of 2025–2033. This growth is underpinned by a steady rise in adoption rates, particularly for Laboratory Grade and Inspection Grade surface plates, driven by stringent quality assurance protocols in sectors like automotive manufacturing, aerospace, and electronics. Technological disruptions are minimal in terms of fundamental product types, but advancements lie in improved manufacturing precision, tighter tolerances, and integration with digital metrology solutions. Consumer behavior shifts towards greater emphasis on accuracy, reliability, and long-term investment in metrology equipment are also playing a crucial role. The market penetration of advanced stone surface plate solutions is expected to deepen as industries continue to invest in sophisticated inspection and manufacturing processes. Historical data from 2019–2024 indicates a consistent upward trend, with the market size growing from approximately $950 million in 2019 to an estimated $1,150 million in 2024, showcasing a healthy historical CAGR of around 3.9%. This momentum is expected to accelerate.
- Market Size Evolution: Projected to grow from an estimated $1,250 million in 2025 to potentially exceeding $1,800 million by 2033.
- Adoption Rates: Increasing demand for precision and quality control drives higher adoption of stone surface plates.
- Technological Disruptions: Focused on manufacturing precision, material improvements, and digital metrology integration, rather than entirely new product categories.
- Consumer Behavior Shifts: Growing preference for accuracy, reliability, and long-term metrology investments.
- Market Penetration: Deepening penetration in key industrial and laboratory applications.
- CAGR (Forecast Period): Estimated at 4.8% for 2025–2033.
- Historical CAGR (2019-2024): Approximately 3.9%.
Dominant Regions, Countries, or Segments in Stone Surface Plate
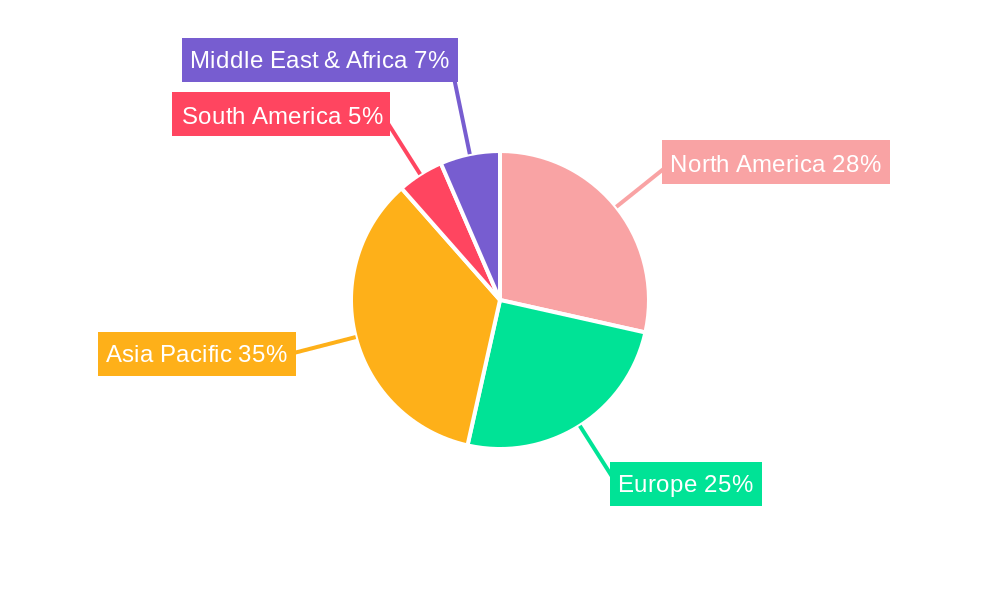
The Industrial Manufacturing segment, particularly within the Inspection Grade and Laboratory Grade types, is the dominant force driving growth in the global stone surface plate market. This dominance is primarily concentrated in regions with highly developed manufacturing bases and stringent quality control mandates. Asia-Pacific, led by countries like China, Japan, and South Korea, emerges as the leading region, accounting for an estimated 45% of the global market share in 2025. This is attributed to the massive scale of its manufacturing industry, rapid technological advancements, and increasing investments in precision engineering. The region benefits from strong government initiatives supporting industrial modernization and quality standards, alongside the presence of key manufacturers and suppliers.
In terms of countries, the United States also represents a significant market, driven by its advanced aerospace, automotive, and semiconductor industries, where precision metrology is paramount. Its market share is estimated at around 25% in 2025. Europe, particularly Germany, remains a crucial market due to its strong automotive and machinery sectors, contributing approximately 20%.
Analyzing by segment type, Inspection Grade stone surface plates are projected to hold the largest market share, estimated at 35% in 2025, followed closely by Laboratory Grade at 30%. This reflects the critical need for high-accuracy surfaces in quality inspection processes. Workshop Grade plates, while still important for general-purpose use, represent a smaller but stable segment, around 25%. Rough Grade applications, typically for less demanding tasks, constitute the remaining 10%.
- Dominant Application Segment: Industrial Manufacturing (estimated 60% market share in 2025).
- Leading Region: Asia-Pacific (estimated 45% market share in 2025).
- Key Countries: United States (estimated 25%), Germany (estimated 20%).
- Dominant Type Segments: Inspection Grade (estimated 35%), Laboratory Grade (estimated 30%).
- Growth Drivers in Asia-Pacific: Large manufacturing base, technological adoption, government support for industrialization.
- Growth Drivers in USA/Europe: Aerospace, automotive, semiconductor industries, advanced R&D.
Stone Surface Plate Product Landscape
The stone surface plate product landscape is characterized by a focus on material purity, dimensional stability, and surface finish. Manufacturers are increasingly offering ultra-flat surfaces with tolerances measured in microns, crucial for high-precision metrology and manufacturing. Laboratory Grade plates, often made from black granite with excellent thermal stability and minimal porosity, are designed for sensitive measurement applications. Inspection Grade plates provide a balance of accuracy and durability for quality control environments. Workshop Grade plates offer robust performance for general machining and assembly. Innovations include enhanced edge treatments, integrated leveling systems, and anti-static coatings. The integration of digital technologies, such as embedded sensors for temperature monitoring, is also a growing trend, enabling real-time data acquisition and analysis. CHUO PRECISION INDUSTRIAL is recognized for its commitment to ultra-precision, while companies like Grizzly Industrial(R),Inc. offer a wider range of grades to cater to diverse industrial needs.
Key Drivers, Barriers & Challenges in Stone Surface Plate
The stone surface plate market is propelled by several key drivers, including the escalating demand for enhanced precision and accuracy in advanced manufacturing sectors like aerospace, automotive, and electronics. Technological advancements in material science and manufacturing processes that allow for tighter tolerances and improved surface finishes further fuel growth. Stricter quality control regulations globally necessitate the use of reliable metrology equipment, including high-quality stone surface plates.
However, the market faces significant barriers and challenges. The high initial cost of premium-grade stone surface plates can be a deterrent for smaller businesses. Supply chain disruptions and the availability of raw materials, particularly high-quality granite, can impact production and pricing. The presence of effective substitutes like cast iron and composite materials also poses a competitive challenge. Furthermore, the need for skilled labor in the precise manufacturing and handling of these plates can be a constraint. The estimated impact of these challenges could lead to a 5-8% slowdown in projected growth if not adequately addressed.
Emerging Opportunities in Stone Surface Plate
Emerging opportunities in the stone surface plate industry lie in the development of smart surface plates integrated with IoT capabilities for real-time performance monitoring and predictive maintenance. The growing demand for metrology solutions in emerging industries such as renewable energy (e.g., solar panel manufacturing) and advanced medical device production presents untapped markets. There is also an opportunity to develop more sustainable manufacturing processes for stone plates and to expand offerings for specialized applications requiring unique material properties or custom designs. Furthermore, the digitalization of manufacturing workflows creates a demand for surface plates that can seamlessly integrate with automated inspection systems and data analytics platforms.
Growth Accelerators in the Stone Surface Plate Industry
Long-term growth in the stone surface plate industry is being significantly accelerated by ongoing technological breakthroughs in material science, leading to even greater flatness and thermal stability. Strategic partnerships between surface plate manufacturers and metrology software developers are creating integrated solutions that enhance user efficiency and data management. Market expansion into developing economies with rapidly growing industrial sectors, coupled with increasing investments in quality control infrastructure, are also key growth accelerators. The continuous drive for higher precision in sectors like additive manufacturing and nanotechnology further solidifies the need for superior surface plate performance.
Key Players Shaping the Stone Surface Plate Market
- Grizzly Industrial(R),Inc.
- CNC Specialty Store LLC
- Precision Granite
- Judge Tool & Gage
- Shars Tool
- Productivity Quality Inc
- TDC CO.,LTD.
- CHUO PRECISION INDUSTRIAL
Notable Milestones in Stone Surface Plate Sector
- 2019: Increased focus on ultra-precision granite machining techniques leading to tighter tolerances.
- 2020: Introduction of advanced surface treatments for enhanced durability and resistance to chemicals in laboratory environments.
- 2021: Growing adoption of modular and portable stone surface plates for on-site inspection needs.
- 2022: Development of enhanced thermal stabilization technologies for granite plates to minimize environmental impact on measurements.
- 2023: Increased integration of digital metrology tools and software with stone surface plate systems for data analysis.
- 2024: Notable advancements in the use of composite materials as a cost-effective alternative for specific workshop-grade applications.
In-Depth Stone Surface Plate Market Outlook
The future outlook for the stone surface plate market is exceptionally positive, driven by an unyielding global push for manufacturing excellence and quality assurance. Growth accelerators such as technological innovations in material science and manufacturing precision will continue to define the premium segment, while strategic alliances will foster integrated metrology solutions. Expansion into burgeoning industrial markets and the increasing adoption of stringent quality standards across diverse sectors will ensure sustained demand. The market is set to witness a robust expansion, driven by its indispensable role in precision measurement and its continuous adaptation to the evolving needs of advanced industries. The estimated market value is expected to reach $1,800 million by 2033.
Stone Surface Plate Segmentation
-
1. Application
- 1.1. Industrial Manufacturing
- 1.2. Laboratory Environment
- 1.3. Others
-
2. Types
- 2.1. Laboratory Grade
- 2.2. Inspection Grade
- 2.3. Workshop Grade
- 2.4. Rough Grade
Stone Surface Plate Segmentation By Geography
-
1. North America
- 1.1. United States
- 1.2. Canada
- 1.3. Mexico
-
2. South America
- 2.1. Brazil
- 2.2. Argentina
- 2.3. Rest of South America
-
3. Europe
- 3.1. United Kingdom
- 3.2. Germany
- 3.3. France
- 3.4. Italy
- 3.5. Spain
- 3.6. Russia
- 3.7. Benelux
- 3.8. Nordics
- 3.9. Rest of Europe
-
4. Middle East & Africa
- 4.1. Turkey
- 4.2. Israel
- 4.3. GCC
- 4.4. North Africa
- 4.5. South Africa
- 4.6. Rest of Middle East & Africa
-
5. Asia Pacific
- 5.1. China
- 5.2. India
- 5.3. Japan
- 5.4. South Korea
- 5.5. ASEAN
- 5.6. Oceania
- 5.7. Rest of Asia Pacific
Stone Surface Plate REPORT HIGHLIGHTS
| Aspects | Details |
|---|---|
| Study Period | 2019-2033 |
| Base Year | 2024 |
| Estimated Year | 2025 |
| Forecast Period | 2025-2033 |
| Historical Period | 2019-2024 |
| Growth Rate | CAGR of XX% from 2019-2033 |
| Segmentation |
|
Table of Contents
- 1. Introduction
- 1.1. Research Scope
- 1.2. Market Segmentation
- 1.3. Research Methodology
- 1.4. Definitions and Assumptions
- 2. Executive Summary
- 2.1. Introduction
- 3. Market Dynamics
- 3.1. Introduction
- 3.2. Market Drivers
- 3.3. Market Restrains
- 3.4. Market Trends
- 4. Market Factor Analysis
- 4.1. Porters Five Forces
- 4.2. Supply/Value Chain
- 4.3. PESTEL analysis
- 4.4. Market Entropy
- 4.5. Patent/Trademark Analysis
- 5. Global Stone Surface Plate Analysis, Insights and Forecast, 2019-2031
- 5.1. Market Analysis, Insights and Forecast - by Application
- 5.1.1. Industrial Manufacturing
- 5.1.2. Laboratory Environment
- 5.1.3. Others
- 5.2. Market Analysis, Insights and Forecast - by Types
- 5.2.1. Laboratory Grade
- 5.2.2. Inspection Grade
- 5.2.3. Workshop Grade
- 5.2.4. Rough Grade
- 5.3. Market Analysis, Insights and Forecast - by Region
- 5.3.1. North America
- 5.3.2. South America
- 5.3.3. Europe
- 5.3.4. Middle East & Africa
- 5.3.5. Asia Pacific
- 5.1. Market Analysis, Insights and Forecast - by Application
- 6. North America Stone Surface Plate Analysis, Insights and Forecast, 2019-2031
- 6.1. Market Analysis, Insights and Forecast - by Application
- 6.1.1. Industrial Manufacturing
- 6.1.2. Laboratory Environment
- 6.1.3. Others
- 6.2. Market Analysis, Insights and Forecast - by Types
- 6.2.1. Laboratory Grade
- 6.2.2. Inspection Grade
- 6.2.3. Workshop Grade
- 6.2.4. Rough Grade
- 6.1. Market Analysis, Insights and Forecast - by Application
- 7. South America Stone Surface Plate Analysis, Insights and Forecast, 2019-2031
- 7.1. Market Analysis, Insights and Forecast - by Application
- 7.1.1. Industrial Manufacturing
- 7.1.2. Laboratory Environment
- 7.1.3. Others
- 7.2. Market Analysis, Insights and Forecast - by Types
- 7.2.1. Laboratory Grade
- 7.2.2. Inspection Grade
- 7.2.3. Workshop Grade
- 7.2.4. Rough Grade
- 7.1. Market Analysis, Insights and Forecast - by Application
- 8. Europe Stone Surface Plate Analysis, Insights and Forecast, 2019-2031
- 8.1. Market Analysis, Insights and Forecast - by Application
- 8.1.1. Industrial Manufacturing
- 8.1.2. Laboratory Environment
- 8.1.3. Others
- 8.2. Market Analysis, Insights and Forecast - by Types
- 8.2.1. Laboratory Grade
- 8.2.2. Inspection Grade
- 8.2.3. Workshop Grade
- 8.2.4. Rough Grade
- 8.1. Market Analysis, Insights and Forecast - by Application
- 9. Middle East & Africa Stone Surface Plate Analysis, Insights and Forecast, 2019-2031
- 9.1. Market Analysis, Insights and Forecast - by Application
- 9.1.1. Industrial Manufacturing
- 9.1.2. Laboratory Environment
- 9.1.3. Others
- 9.2. Market Analysis, Insights and Forecast - by Types
- 9.2.1. Laboratory Grade
- 9.2.2. Inspection Grade
- 9.2.3. Workshop Grade
- 9.2.4. Rough Grade
- 9.1. Market Analysis, Insights and Forecast - by Application
- 10. Asia Pacific Stone Surface Plate Analysis, Insights and Forecast, 2019-2031
- 10.1. Market Analysis, Insights and Forecast - by Application
- 10.1.1. Industrial Manufacturing
- 10.1.2. Laboratory Environment
- 10.1.3. Others
- 10.2. Market Analysis, Insights and Forecast - by Types
- 10.2.1. Laboratory Grade
- 10.2.2. Inspection Grade
- 10.2.3. Workshop Grade
- 10.2.4. Rough Grade
- 10.1. Market Analysis, Insights and Forecast - by Application
- 11. Competitive Analysis
- 11.1. Global Market Share Analysis 2024
- 11.2. Company Profiles
- 11.2.1 Grizzly Industrial(R)
- 11.2.1.1. Overview
- 11.2.1.2. Products
- 11.2.1.3. SWOT Analysis
- 11.2.1.4. Recent Developments
- 11.2.1.5. Financials (Based on Availability)
- 11.2.2 Inc.
- 11.2.2.1. Overview
- 11.2.2.2. Products
- 11.2.2.3. SWOT Analysis
- 11.2.2.4. Recent Developments
- 11.2.2.5. Financials (Based on Availability)
- 11.2.3 CNC Specialty Store LLC
- 11.2.3.1. Overview
- 11.2.3.2. Products
- 11.2.3.3. SWOT Analysis
- 11.2.3.4. Recent Developments
- 11.2.3.5. Financials (Based on Availability)
- 11.2.4 Precision Granite
- 11.2.4.1. Overview
- 11.2.4.2. Products
- 11.2.4.3. SWOT Analysis
- 11.2.4.4. Recent Developments
- 11.2.4.5. Financials (Based on Availability)
- 11.2.5 Judge Tool & Gage
- 11.2.5.1. Overview
- 11.2.5.2. Products
- 11.2.5.3. SWOT Analysis
- 11.2.5.4. Recent Developments
- 11.2.5.5. Financials (Based on Availability)
- 11.2.6 Shars Tool
- 11.2.6.1. Overview
- 11.2.6.2. Products
- 11.2.6.3. SWOT Analysis
- 11.2.6.4. Recent Developments
- 11.2.6.5. Financials (Based on Availability)
- 11.2.7 Productivity Quality Inc
- 11.2.7.1. Overview
- 11.2.7.2. Products
- 11.2.7.3. SWOT Analysis
- 11.2.7.4. Recent Developments
- 11.2.7.5. Financials (Based on Availability)
- 11.2.8 TDC CO.
- 11.2.8.1. Overview
- 11.2.8.2. Products
- 11.2.8.3. SWOT Analysis
- 11.2.8.4. Recent Developments
- 11.2.8.5. Financials (Based on Availability)
- 11.2.9 LTD.
- 11.2.9.1. Overview
- 11.2.9.2. Products
- 11.2.9.3. SWOT Analysis
- 11.2.9.4. Recent Developments
- 11.2.9.5. Financials (Based on Availability)
- 11.2.10 CHUO PRECISION INDUSTRIAL
- 11.2.10.1. Overview
- 11.2.10.2. Products
- 11.2.10.3. SWOT Analysis
- 11.2.10.4. Recent Developments
- 11.2.10.5. Financials (Based on Availability)
- 11.2.1 Grizzly Industrial(R)
List of Figures
- Figure 1: Global Stone Surface Plate Revenue Breakdown (million, %) by Region 2024 & 2032
- Figure 2: Global Stone Surface Plate Volume Breakdown (K, %) by Region 2024 & 2032
- Figure 3: North America Stone Surface Plate Revenue (million), by Application 2024 & 2032
- Figure 4: North America Stone Surface Plate Volume (K), by Application 2024 & 2032
- Figure 5: North America Stone Surface Plate Revenue Share (%), by Application 2024 & 2032
- Figure 6: North America Stone Surface Plate Volume Share (%), by Application 2024 & 2032
- Figure 7: North America Stone Surface Plate Revenue (million), by Types 2024 & 2032
- Figure 8: North America Stone Surface Plate Volume (K), by Types 2024 & 2032
- Figure 9: North America Stone Surface Plate Revenue Share (%), by Types 2024 & 2032
- Figure 10: North America Stone Surface Plate Volume Share (%), by Types 2024 & 2032
- Figure 11: North America Stone Surface Plate Revenue (million), by Country 2024 & 2032
- Figure 12: North America Stone Surface Plate Volume (K), by Country 2024 & 2032
- Figure 13: North America Stone Surface Plate Revenue Share (%), by Country 2024 & 2032
- Figure 14: North America Stone Surface Plate Volume Share (%), by Country 2024 & 2032
- Figure 15: South America Stone Surface Plate Revenue (million), by Application 2024 & 2032
- Figure 16: South America Stone Surface Plate Volume (K), by Application 2024 & 2032
- Figure 17: South America Stone Surface Plate Revenue Share (%), by Application 2024 & 2032
- Figure 18: South America Stone Surface Plate Volume Share (%), by Application 2024 & 2032
- Figure 19: South America Stone Surface Plate Revenue (million), by Types 2024 & 2032
- Figure 20: South America Stone Surface Plate Volume (K), by Types 2024 & 2032
- Figure 21: South America Stone Surface Plate Revenue Share (%), by Types 2024 & 2032
- Figure 22: South America Stone Surface Plate Volume Share (%), by Types 2024 & 2032
- Figure 23: South America Stone Surface Plate Revenue (million), by Country 2024 & 2032
- Figure 24: South America Stone Surface Plate Volume (K), by Country 2024 & 2032
- Figure 25: South America Stone Surface Plate Revenue Share (%), by Country 2024 & 2032
- Figure 26: South America Stone Surface Plate Volume Share (%), by Country 2024 & 2032
- Figure 27: Europe Stone Surface Plate Revenue (million), by Application 2024 & 2032
- Figure 28: Europe Stone Surface Plate Volume (K), by Application 2024 & 2032
- Figure 29: Europe Stone Surface Plate Revenue Share (%), by Application 2024 & 2032
- Figure 30: Europe Stone Surface Plate Volume Share (%), by Application 2024 & 2032
- Figure 31: Europe Stone Surface Plate Revenue (million), by Types 2024 & 2032
- Figure 32: Europe Stone Surface Plate Volume (K), by Types 2024 & 2032
- Figure 33: Europe Stone Surface Plate Revenue Share (%), by Types 2024 & 2032
- Figure 34: Europe Stone Surface Plate Volume Share (%), by Types 2024 & 2032
- Figure 35: Europe Stone Surface Plate Revenue (million), by Country 2024 & 2032
- Figure 36: Europe Stone Surface Plate Volume (K), by Country 2024 & 2032
- Figure 37: Europe Stone Surface Plate Revenue Share (%), by Country 2024 & 2032
- Figure 38: Europe Stone Surface Plate Volume Share (%), by Country 2024 & 2032
- Figure 39: Middle East & Africa Stone Surface Plate Revenue (million), by Application 2024 & 2032
- Figure 40: Middle East & Africa Stone Surface Plate Volume (K), by Application 2024 & 2032
- Figure 41: Middle East & Africa Stone Surface Plate Revenue Share (%), by Application 2024 & 2032
- Figure 42: Middle East & Africa Stone Surface Plate Volume Share (%), by Application 2024 & 2032
- Figure 43: Middle East & Africa Stone Surface Plate Revenue (million), by Types 2024 & 2032
- Figure 44: Middle East & Africa Stone Surface Plate Volume (K), by Types 2024 & 2032
- Figure 45: Middle East & Africa Stone Surface Plate Revenue Share (%), by Types 2024 & 2032
- Figure 46: Middle East & Africa Stone Surface Plate Volume Share (%), by Types 2024 & 2032
- Figure 47: Middle East & Africa Stone Surface Plate Revenue (million), by Country 2024 & 2032
- Figure 48: Middle East & Africa Stone Surface Plate Volume (K), by Country 2024 & 2032
- Figure 49: Middle East & Africa Stone Surface Plate Revenue Share (%), by Country 2024 & 2032
- Figure 50: Middle East & Africa Stone Surface Plate Volume Share (%), by Country 2024 & 2032
- Figure 51: Asia Pacific Stone Surface Plate Revenue (million), by Application 2024 & 2032
- Figure 52: Asia Pacific Stone Surface Plate Volume (K), by Application 2024 & 2032
- Figure 53: Asia Pacific Stone Surface Plate Revenue Share (%), by Application 2024 & 2032
- Figure 54: Asia Pacific Stone Surface Plate Volume Share (%), by Application 2024 & 2032
- Figure 55: Asia Pacific Stone Surface Plate Revenue (million), by Types 2024 & 2032
- Figure 56: Asia Pacific Stone Surface Plate Volume (K), by Types 2024 & 2032
- Figure 57: Asia Pacific Stone Surface Plate Revenue Share (%), by Types 2024 & 2032
- Figure 58: Asia Pacific Stone Surface Plate Volume Share (%), by Types 2024 & 2032
- Figure 59: Asia Pacific Stone Surface Plate Revenue (million), by Country 2024 & 2032
- Figure 60: Asia Pacific Stone Surface Plate Volume (K), by Country 2024 & 2032
- Figure 61: Asia Pacific Stone Surface Plate Revenue Share (%), by Country 2024 & 2032
- Figure 62: Asia Pacific Stone Surface Plate Volume Share (%), by Country 2024 & 2032
List of Tables
- Table 1: Global Stone Surface Plate Revenue million Forecast, by Region 2019 & 2032
- Table 2: Global Stone Surface Plate Volume K Forecast, by Region 2019 & 2032
- Table 3: Global Stone Surface Plate Revenue million Forecast, by Application 2019 & 2032
- Table 4: Global Stone Surface Plate Volume K Forecast, by Application 2019 & 2032
- Table 5: Global Stone Surface Plate Revenue million Forecast, by Types 2019 & 2032
- Table 6: Global Stone Surface Plate Volume K Forecast, by Types 2019 & 2032
- Table 7: Global Stone Surface Plate Revenue million Forecast, by Region 2019 & 2032
- Table 8: Global Stone Surface Plate Volume K Forecast, by Region 2019 & 2032
- Table 9: Global Stone Surface Plate Revenue million Forecast, by Application 2019 & 2032
- Table 10: Global Stone Surface Plate Volume K Forecast, by Application 2019 & 2032
- Table 11: Global Stone Surface Plate Revenue million Forecast, by Types 2019 & 2032
- Table 12: Global Stone Surface Plate Volume K Forecast, by Types 2019 & 2032
- Table 13: Global Stone Surface Plate Revenue million Forecast, by Country 2019 & 2032
- Table 14: Global Stone Surface Plate Volume K Forecast, by Country 2019 & 2032
- Table 15: United States Stone Surface Plate Revenue (million) Forecast, by Application 2019 & 2032
- Table 16: United States Stone Surface Plate Volume (K) Forecast, by Application 2019 & 2032
- Table 17: Canada Stone Surface Plate Revenue (million) Forecast, by Application 2019 & 2032
- Table 18: Canada Stone Surface Plate Volume (K) Forecast, by Application 2019 & 2032
- Table 19: Mexico Stone Surface Plate Revenue (million) Forecast, by Application 2019 & 2032
- Table 20: Mexico Stone Surface Plate Volume (K) Forecast, by Application 2019 & 2032
- Table 21: Global Stone Surface Plate Revenue million Forecast, by Application 2019 & 2032
- Table 22: Global Stone Surface Plate Volume K Forecast, by Application 2019 & 2032
- Table 23: Global Stone Surface Plate Revenue million Forecast, by Types 2019 & 2032
- Table 24: Global Stone Surface Plate Volume K Forecast, by Types 2019 & 2032
- Table 25: Global Stone Surface Plate Revenue million Forecast, by Country 2019 & 2032
- Table 26: Global Stone Surface Plate Volume K Forecast, by Country 2019 & 2032
- Table 27: Brazil Stone Surface Plate Revenue (million) Forecast, by Application 2019 & 2032
- Table 28: Brazil Stone Surface Plate Volume (K) Forecast, by Application 2019 & 2032
- Table 29: Argentina Stone Surface Plate Revenue (million) Forecast, by Application 2019 & 2032
- Table 30: Argentina Stone Surface Plate Volume (K) Forecast, by Application 2019 & 2032
- Table 31: Rest of South America Stone Surface Plate Revenue (million) Forecast, by Application 2019 & 2032
- Table 32: Rest of South America Stone Surface Plate Volume (K) Forecast, by Application 2019 & 2032
- Table 33: Global Stone Surface Plate Revenue million Forecast, by Application 2019 & 2032
- Table 34: Global Stone Surface Plate Volume K Forecast, by Application 2019 & 2032
- Table 35: Global Stone Surface Plate Revenue million Forecast, by Types 2019 & 2032
- Table 36: Global Stone Surface Plate Volume K Forecast, by Types 2019 & 2032
- Table 37: Global Stone Surface Plate Revenue million Forecast, by Country 2019 & 2032
- Table 38: Global Stone Surface Plate Volume K Forecast, by Country 2019 & 2032
- Table 39: United Kingdom Stone Surface Plate Revenue (million) Forecast, by Application 2019 & 2032
- Table 40: United Kingdom Stone Surface Plate Volume (K) Forecast, by Application 2019 & 2032
- Table 41: Germany Stone Surface Plate Revenue (million) Forecast, by Application 2019 & 2032
- Table 42: Germany Stone Surface Plate Volume (K) Forecast, by Application 2019 & 2032
- Table 43: France Stone Surface Plate Revenue (million) Forecast, by Application 2019 & 2032
- Table 44: France Stone Surface Plate Volume (K) Forecast, by Application 2019 & 2032
- Table 45: Italy Stone Surface Plate Revenue (million) Forecast, by Application 2019 & 2032
- Table 46: Italy Stone Surface Plate Volume (K) Forecast, by Application 2019 & 2032
- Table 47: Spain Stone Surface Plate Revenue (million) Forecast, by Application 2019 & 2032
- Table 48: Spain Stone Surface Plate Volume (K) Forecast, by Application 2019 & 2032
- Table 49: Russia Stone Surface Plate Revenue (million) Forecast, by Application 2019 & 2032
- Table 50: Russia Stone Surface Plate Volume (K) Forecast, by Application 2019 & 2032
- Table 51: Benelux Stone Surface Plate Revenue (million) Forecast, by Application 2019 & 2032
- Table 52: Benelux Stone Surface Plate Volume (K) Forecast, by Application 2019 & 2032
- Table 53: Nordics Stone Surface Plate Revenue (million) Forecast, by Application 2019 & 2032
- Table 54: Nordics Stone Surface Plate Volume (K) Forecast, by Application 2019 & 2032
- Table 55: Rest of Europe Stone Surface Plate Revenue (million) Forecast, by Application 2019 & 2032
- Table 56: Rest of Europe Stone Surface Plate Volume (K) Forecast, by Application 2019 & 2032
- Table 57: Global Stone Surface Plate Revenue million Forecast, by Application 2019 & 2032
- Table 58: Global Stone Surface Plate Volume K Forecast, by Application 2019 & 2032
- Table 59: Global Stone Surface Plate Revenue million Forecast, by Types 2019 & 2032
- Table 60: Global Stone Surface Plate Volume K Forecast, by Types 2019 & 2032
- Table 61: Global Stone Surface Plate Revenue million Forecast, by Country 2019 & 2032
- Table 62: Global Stone Surface Plate Volume K Forecast, by Country 2019 & 2032
- Table 63: Turkey Stone Surface Plate Revenue (million) Forecast, by Application 2019 & 2032
- Table 64: Turkey Stone Surface Plate Volume (K) Forecast, by Application 2019 & 2032
- Table 65: Israel Stone Surface Plate Revenue (million) Forecast, by Application 2019 & 2032
- Table 66: Israel Stone Surface Plate Volume (K) Forecast, by Application 2019 & 2032
- Table 67: GCC Stone Surface Plate Revenue (million) Forecast, by Application 2019 & 2032
- Table 68: GCC Stone Surface Plate Volume (K) Forecast, by Application 2019 & 2032
- Table 69: North Africa Stone Surface Plate Revenue (million) Forecast, by Application 2019 & 2032
- Table 70: North Africa Stone Surface Plate Volume (K) Forecast, by Application 2019 & 2032
- Table 71: South Africa Stone Surface Plate Revenue (million) Forecast, by Application 2019 & 2032
- Table 72: South Africa Stone Surface Plate Volume (K) Forecast, by Application 2019 & 2032
- Table 73: Rest of Middle East & Africa Stone Surface Plate Revenue (million) Forecast, by Application 2019 & 2032
- Table 74: Rest of Middle East & Africa Stone Surface Plate Volume (K) Forecast, by Application 2019 & 2032
- Table 75: Global Stone Surface Plate Revenue million Forecast, by Application 2019 & 2032
- Table 76: Global Stone Surface Plate Volume K Forecast, by Application 2019 & 2032
- Table 77: Global Stone Surface Plate Revenue million Forecast, by Types 2019 & 2032
- Table 78: Global Stone Surface Plate Volume K Forecast, by Types 2019 & 2032
- Table 79: Global Stone Surface Plate Revenue million Forecast, by Country 2019 & 2032
- Table 80: Global Stone Surface Plate Volume K Forecast, by Country 2019 & 2032
- Table 81: China Stone Surface Plate Revenue (million) Forecast, by Application 2019 & 2032
- Table 82: China Stone Surface Plate Volume (K) Forecast, by Application 2019 & 2032
- Table 83: India Stone Surface Plate Revenue (million) Forecast, by Application 2019 & 2032
- Table 84: India Stone Surface Plate Volume (K) Forecast, by Application 2019 & 2032
- Table 85: Japan Stone Surface Plate Revenue (million) Forecast, by Application 2019 & 2032
- Table 86: Japan Stone Surface Plate Volume (K) Forecast, by Application 2019 & 2032
- Table 87: South Korea Stone Surface Plate Revenue (million) Forecast, by Application 2019 & 2032
- Table 88: South Korea Stone Surface Plate Volume (K) Forecast, by Application 2019 & 2032
- Table 89: ASEAN Stone Surface Plate Revenue (million) Forecast, by Application 2019 & 2032
- Table 90: ASEAN Stone Surface Plate Volume (K) Forecast, by Application 2019 & 2032
- Table 91: Oceania Stone Surface Plate Revenue (million) Forecast, by Application 2019 & 2032
- Table 92: Oceania Stone Surface Plate Volume (K) Forecast, by Application 2019 & 2032
- Table 93: Rest of Asia Pacific Stone Surface Plate Revenue (million) Forecast, by Application 2019 & 2032
- Table 94: Rest of Asia Pacific Stone Surface Plate Volume (K) Forecast, by Application 2019 & 2032
Frequently Asked Questions
1. What is the projected Compound Annual Growth Rate (CAGR) of the Stone Surface Plate?
The projected CAGR is approximately XX%.
2. Which companies are prominent players in the Stone Surface Plate?
Key companies in the market include Grizzly Industrial(R), Inc., CNC Specialty Store LLC, Precision Granite, Judge Tool & Gage, Shars Tool, Productivity Quality Inc, TDC CO., LTD., CHUO PRECISION INDUSTRIAL.
3. What are the main segments of the Stone Surface Plate?
The market segments include Application, Types.
4. Can you provide details about the market size?
The market size is estimated to be USD XXX million as of 2022.
5. What are some drivers contributing to market growth?
N/A
6. What are the notable trends driving market growth?
N/A
7. Are there any restraints impacting market growth?
N/A
8. Can you provide examples of recent developments in the market?
N/A
9. What pricing options are available for accessing the report?
Pricing options include single-user, multi-user, and enterprise licenses priced at USD 4350.00, USD 6525.00, and USD 8700.00 respectively.
10. Is the market size provided in terms of value or volume?
The market size is provided in terms of value, measured in million and volume, measured in K.
11. Are there any specific market keywords associated with the report?
Yes, the market keyword associated with the report is "Stone Surface Plate," which aids in identifying and referencing the specific market segment covered.
12. How do I determine which pricing option suits my needs best?
The pricing options vary based on user requirements and access needs. Individual users may opt for single-user licenses, while businesses requiring broader access may choose multi-user or enterprise licenses for cost-effective access to the report.
13. Are there any additional resources or data provided in the Stone Surface Plate report?
While the report offers comprehensive insights, it's advisable to review the specific contents or supplementary materials provided to ascertain if additional resources or data are available.
14. How can I stay updated on further developments or reports in the Stone Surface Plate?
To stay informed about further developments, trends, and reports in the Stone Surface Plate, consider subscribing to industry newsletters, following relevant companies and organizations, or regularly checking reputable industry news sources and publications.
Methodology
Step 1 - Identification of Relevant Samples Size from Population Database


Step 2 - Approaches for Defining Global Market Size (Value, Volume* & Price*)

Note*: In applicable scenarios
Step 3 - Data Sources
Primary Research
- Web Analytics
- Survey Reports
- Research Institute
- Latest Research Reports
- Opinion Leaders
Secondary Research
- Annual Reports
- White Paper
- Latest Press Release
- Industry Association
- Paid Database
- Investor Presentations

Step 4 - Data Triangulation
Involves using different sources of information in order to increase the validity of a study
These sources are likely to be stakeholders in a program - participants, other researchers, program staff, other community members, and so on.
Then we put all data in single framework & apply various statistical tools to find out the dynamic on the market.
During the analysis stage, feedback from the stakeholder groups would be compared to determine areas of agreement as well as areas of divergence


