
Key Insights
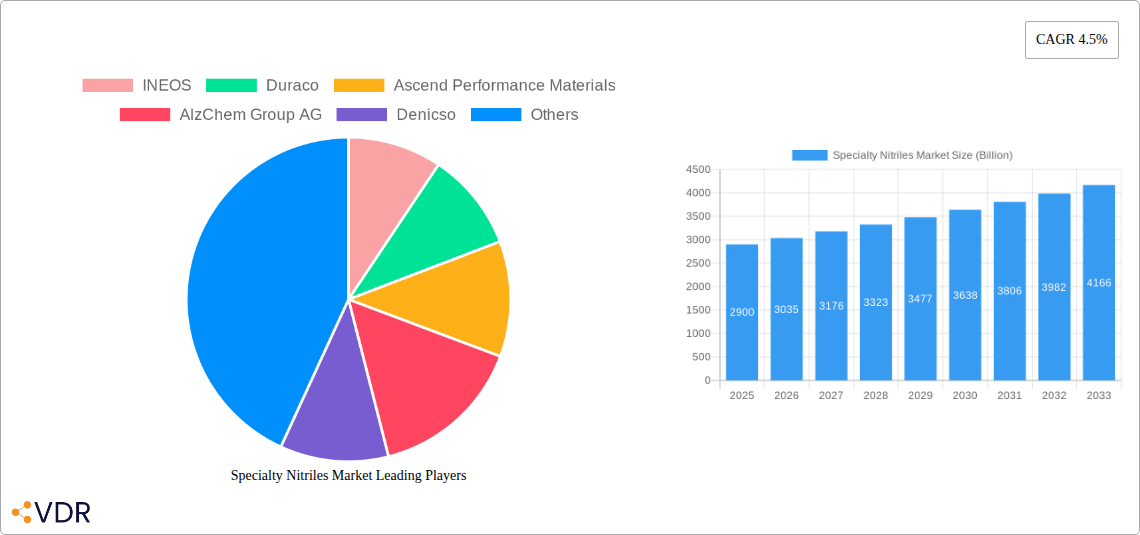
The global specialty nitriles market, valued at $2.9 billion in 2025, is projected to experience robust growth, driven by increasing demand across diverse sectors. A compound annual growth rate (CAGR) of 4.5% from 2025 to 2033 signifies a substantial expansion, primarily fueled by the burgeoning automotive and electronics industries. The rise of electric vehicles (EVs) and advanced electronics necessitates high-performance nitrile-based components like seals, gaskets, and protective coatings, contributing significantly to market growth. Furthermore, the expanding oil and gas exploration activities are boosting demand for specialty nitriles in oilfield applications. The manufacturing processes employed, such as ammoxidation and hydrocyanation, are continuously being optimized for efficiency and sustainability, impacting production costs and market competitiveness. Hydrogenated nitrile butadiene rubber (HNBR), known for its superior resistance to oils and chemicals, commands a significant share of the market, surpassing nitrile butadiene rubber (NBR) in specific high-performance applications. However, stringent environmental regulations and fluctuating raw material prices pose challenges to sustained market growth. Geographic segmentation reveals North America and Asia-Pacific as leading regions, driven by robust industrial activity and established manufacturing bases. Competitive dynamics are shaped by key players such as INEOS, Duraco, and Ascend Performance Materials, who are investing in research and development to cater to evolving market needs and expanding product portfolios.
The forecast period (2025-2033) anticipates significant market penetration in emerging economies, particularly in Asia-Pacific, driven by industrialization and rising disposable incomes. Market segmentation based on application (protective gloves, automotive components, electronics, adhesives & sealants, and oilfield applications) highlights the versatility of specialty nitriles. The ongoing development of new formulations and improved manufacturing techniques promises to further enhance the properties of specialty nitriles, making them ideal for next-generation applications in aerospace, medical devices, and renewable energy. Strategic partnerships and mergers and acquisitions are likely to shape the competitive landscape in the coming years. However, the market remains susceptible to global economic fluctuations and potential supply chain disruptions, which could impact production and pricing.
Specialty Nitriles Market: A Comprehensive Market Report (2019-2033)
This in-depth report provides a comprehensive analysis of the global Specialty Nitriles Market, encompassing market dynamics, growth trends, regional segmentation, product landscape, key players, and future outlook. The report covers the period from 2019 to 2033, with 2025 serving as the base year and estimated year. The market is segmented by manufacturing process (Ammoxidation, Hydrocyanation), type (Nitrile Butadiene Rubber, Hydrogenated Nitrile Butadiene Rubber, Others), and application (Protective Gloves, Automotive Components, Electronic Components, Adhesives & Sealants, Oilfield Applications, Others). The total market size is projected to reach XX Billion by 2033. This report serves as an invaluable resource for industry professionals, investors, and researchers seeking to understand and capitalize on the opportunities within this dynamic market.
Specialty Nitriles Market Dynamics & Structure
The global Specialty Nitriles market is characterized by a moderately concentrated structure, with key players holding significant market shares. The market size in 2025 is estimated at $XX Billion. Technological innovation, primarily in improving the efficiency and sustainability of manufacturing processes, is a major driver. Stringent regulatory frameworks related to environmental protection and worker safety influence production methods and material usage. The market also faces competition from substitute materials, impacting the demand for certain specialty nitrile applications. End-user demographics play a crucial role, particularly in sectors like automotive and healthcare, which show strong demand for high-performance nitrile products. M&A activity has been moderate in recent years, with approximately XX deals concluded between 2019 and 2024, primarily focused on consolidating market share and expanding product portfolios.
- Market Concentration: Moderately concentrated, with top 5 players holding approximately XX% market share in 2025.
- Technological Innovation: Focus on enhancing process efficiency, reducing environmental impact (e.g., minimizing waste generation), and developing specialized nitrile compounds with improved properties.
- Regulatory Framework: Compliance with environmental regulations (e.g., regarding emissions and waste disposal) and worker safety standards (e.g., concerning exposure to hazardous chemicals).
- Competitive Substitutes: Competition from other elastomers, including silicone, polyurethane, and other synthetic rubbers, depending on specific applications.
- End-User Demographics: Growing demand from the automotive, healthcare, and electronics industries driving market growth.
- M&A Trends: Moderate consolidation activity, with a focus on acquiring specialized product lines and expanding geographical reach.
Specialty Nitriles Market Growth Trends & Insights
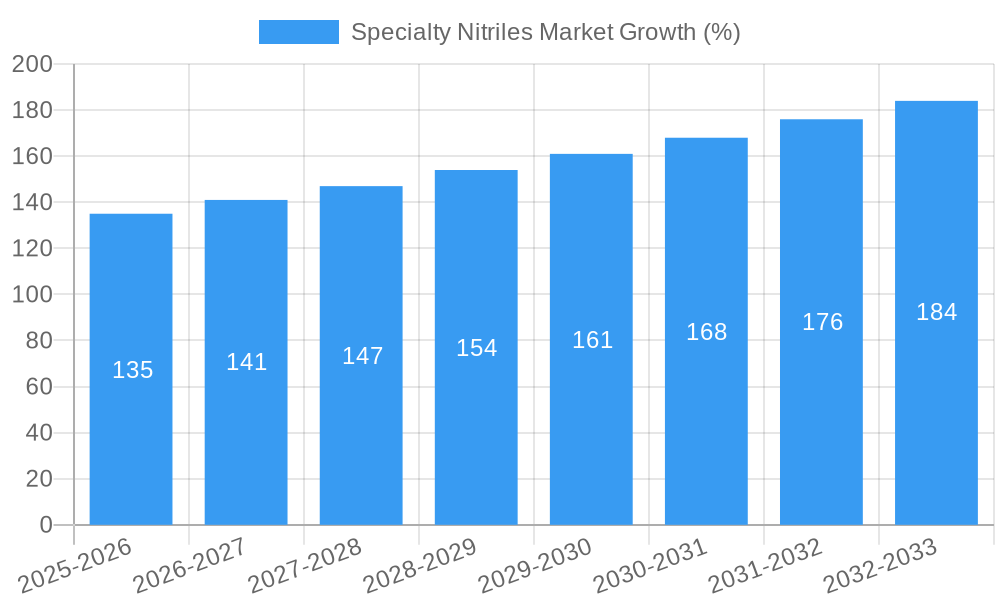
The Specialty Nitriles market has experienced steady growth over the historical period (2019-2024), with a CAGR of approximately XX%. This growth is attributed to several factors, including the increasing demand for high-performance materials in diverse applications, technological advancements leading to improved product properties, and expanding end-use sectors. The market is expected to maintain a healthy growth trajectory during the forecast period (2025-2033), driven by factors such as the rising adoption of advanced materials in various industries (particularly automotive and electronics), the development of new nitrile-based products with enhanced functionalities, and the increasing focus on safety and protection in diverse applications. The market penetration rate for specialty nitriles in key applications like protective gloves and automotive components is expected to increase significantly over the forecast period, further fueling market growth. Technological disruptions, such as the development of novel manufacturing processes and improved material formulations, are contributing to enhancing product properties and expanding applications. Shifts in consumer behavior, particularly an increasing preference for durable and high-quality products, are also driving demand for specialty nitriles.
Dominant Regions, Countries, or Segments in Specialty Nitriles Market
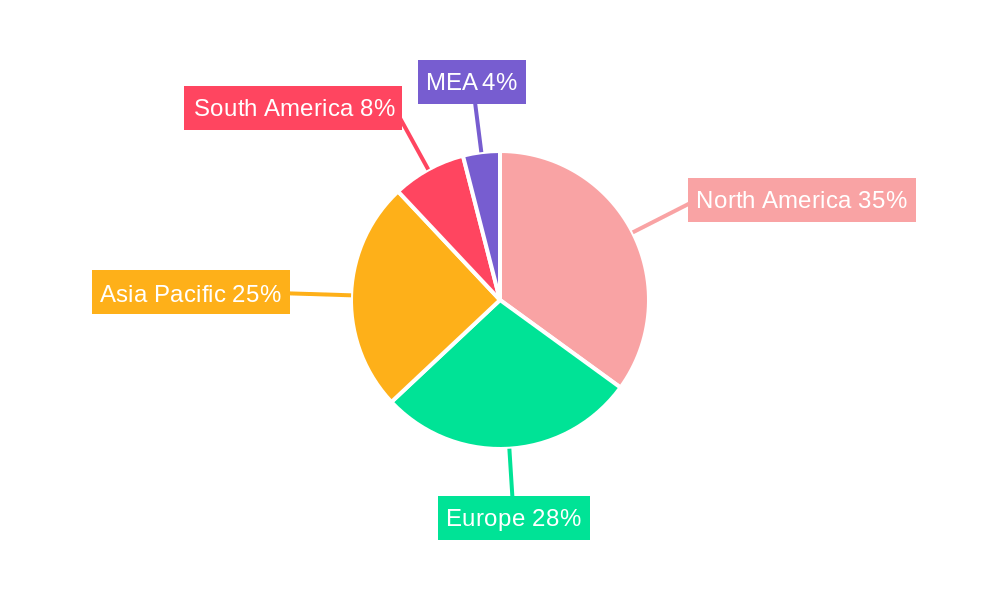
The North American region currently holds the largest market share in the specialty nitriles market, driven by robust demand from the automotive and healthcare sectors, and strong presence of major manufacturers. However, the Asia-Pacific region is expected to exhibit the fastest growth rate during the forecast period, fueled by rapid industrialization, increasing investments in infrastructure projects, and rising disposable incomes.
By Manufacturing Process:
- Ammoxidation: This process holds a larger market share due to its cost-effectiveness and established production capacity.
- Hydrocyanation: This process is gaining traction due to its ability to produce specialty nitriles with specific properties not easily achievable via ammoxidation.
By Type:
- Nitrile Butadiene Rubber (NBR): Dominates the market due to its versatility and wide range of applications.
- Hydrogenated Nitrile Butadiene Rubber (HNBR): Growing segment driven by the demand for higher resistance to heat, oil, and chemicals.
By Application:
- Protective Gloves: Significant market share due to the rising demand for personal protective equipment in various industries.
- Automotive Components: Growing applications in seals, gaskets, and other automotive parts driven by the increase in vehicle production and advanced materials adoption.
Key Drivers:
- Strong demand from automotive and healthcare industries.
- Technological advancements in manufacturing processes and material properties.
- Increasing focus on safety and protection in various applications.
- Government regulations promoting the use of environmentally friendly materials.
Specialty Nitriles Market Product Landscape
The specialty nitriles market offers a diverse range of products, each tailored to specific applications. Recent innovations have focused on improving the mechanical properties of nitrile compounds, such as tensile strength, elongation, and tear resistance. This has led to the development of high-performance specialty nitriles suited for demanding applications in sectors like aerospace and oil & gas. The emphasis on sustainability has driven the development of environmentally friendly nitrile compounds with reduced carbon footprint. These advanced products offer unique selling propositions in terms of enhanced performance, durability, and eco-friendliness, thus driving market growth.
Key Drivers, Barriers & Challenges in Specialty Nitriles Market
Key Drivers:
- Growing demand for high-performance materials in automotive, healthcare, and electronics sectors.
- Technological advancements in manufacturing processes leading to higher efficiency and reduced costs.
- Favorable government regulations supporting the use of specialty nitriles in certain applications.
Challenges:
- Fluctuations in raw material prices, impacting production costs.
- Stringent environmental regulations impacting manufacturing processes and waste management.
- Intense competition from substitute materials and other elastomers.
- Supply chain disruptions impacting the availability of raw materials and finished products. This impacted the market by approximately XX% in 2022.
Emerging Opportunities in Specialty Nitriles Market
Emerging opportunities include the expansion into new applications in renewable energy sectors, development of biodegradable and recyclable nitrile compounds, and customization of nitrile products to meet specific customer requirements. Untapped markets in developing countries offer significant growth potential. The increasing demand for specialized nitriles in medical devices, advanced electronics, and aerospace also creates numerous opportunities.
Growth Accelerators in the Specialty Nitriles Market Industry
Technological breakthroughs in polymer chemistry and manufacturing processes are key growth catalysts. Strategic partnerships between specialty nitrile manufacturers and end-use industries are accelerating product development and market penetration. Expansion into new geographical regions, particularly in developing economies with growing industrialization, offers considerable growth potential.
Key Players Shaping the Specialty Nitriles Market Market
- INEOS
- Duraco
- Ascend Performance Materials
- AlzChem Group AG
- Denicso
- Speciality Tapes
- TIDI Products LLC
- Emerald Performance Materials
- Parchem fine & specialty chemicals
- Marco Rubber & Plastics LLC
- Zeon Chemicals L P
Notable Milestones in Specialty Nitriles Market Sector
- 2020, Q4: Ascend Performance Materials launched a new line of high-performance specialty nitriles.
- 2022, Q1: INEOS acquired a smaller specialty nitrile producer, expanding its market share.
- 2023, Q2: Several new patents were filed relating to sustainable specialty nitrile manufacturing processes.
In-Depth Specialty Nitriles Market Market Outlook
The Specialty Nitriles market is poised for continued growth, driven by technological innovation, expanding applications, and favorable economic conditions. Strategic investments in R&D and capacity expansion will further enhance market competitiveness. Focus on sustainable manufacturing practices and development of eco-friendly products will play a significant role in shaping the future of the industry. The market offers lucrative opportunities for both established players and new entrants.
Specialty Nitriles Market Segmentation
-
1. Manufacturing Process
- 1.1. Ammoxidation
- 1.2. Hydrocyanation
-
2. Types
- 2.1. Nitrile Butadiene Rubber
- 2.2. Hydrogenated Nitrile Butadiene Rubber
- 2.3. Others
-
3. Application
- 3.1. Protective Gloves
- 3.2. Automotive Components
- 3.3. Electronic Components
- 3.4. Adhesives & Sealants
- 3.5. Oilfield Applications
- 3.6. Others
Specialty Nitriles Market Segmentation By Geography
-
1. Asia Pacific
- 1.1. China
- 1.2. India
- 1.3. Japan
- 1.4. South Korea
- 1.5. Rest of Asia Pacific
-
2. North America
- 2.1. United States
- 2.2. Canada
- 2.3. Mexico
-
3. Europe
- 3.1. Germany
- 3.2. United Kingdom
- 3.3. France
- 3.4. Italy
- 3.5. Rest of Europe
-
4. South America
- 4.1. Brazil
- 4.2. Argentina
- 4.3. Rest of South America
-
5. Middle East and Africa
- 5.1. Saudi Arabia
- 5.2. South Africa
- 5.3. Rest of Middle East and Africa
Specialty Nitriles Market REPORT HIGHLIGHTS
| Aspects | Details |
|---|---|
| Study Period | 2019-2033 |
| Base Year | 2024 |
| Estimated Year | 2025 |
| Forecast Period | 2025-2033 |
| Historical Period | 2019-2024 |
| Growth Rate | CAGR of 4.5% from 2019-2033 |
| Segmentation |
|
Table of Contents
- 1. Introduction
- 1.1. Research Scope
- 1.2. Market Segmentation
- 1.3. Research Methodology
- 1.4. Definitions and Assumptions
- 2. Executive Summary
- 2.1. Introduction
- 3. Market Dynamics
- 3.1. Introduction
- 3.2. Market Drivers
- 3.2.1. ; Growing Applications in Automotive Industry; Others Drivers
- 3.3. Market Restrains
- 3.3.1. ; Health Hazard related to Nitrile Fumes; Unfavorable Conditions Arising Due to COVID-19 Outbreak
- 3.4. Market Trends
- 3.4.1. Automotive Components to Dominate the Market
- 4. Market Factor Analysis
- 4.1. Porters Five Forces
- 4.2. Supply/Value Chain
- 4.3. PESTEL analysis
- 4.4. Market Entropy
- 4.5. Patent/Trademark Analysis
- 5. Global Specialty Nitriles Market Analysis, Insights and Forecast, 2019-2031
- 5.1. Market Analysis, Insights and Forecast - by Manufacturing Process
- 5.1.1. Ammoxidation
- 5.1.2. Hydrocyanation
- 5.2. Market Analysis, Insights and Forecast - by Types
- 5.2.1. Nitrile Butadiene Rubber
- 5.2.2. Hydrogenated Nitrile Butadiene Rubber
- 5.2.3. Others
- 5.3. Market Analysis, Insights and Forecast - by Application
- 5.3.1. Protective Gloves
- 5.3.2. Automotive Components
- 5.3.3. Electronic Components
- 5.3.4. Adhesives & Sealants
- 5.3.5. Oilfield Applications
- 5.3.6. Others
- 5.4. Market Analysis, Insights and Forecast - by Region
- 5.4.1. Asia Pacific
- 5.4.2. North America
- 5.4.3. Europe
- 5.4.4. South America
- 5.4.5. Middle East and Africa
- 5.1. Market Analysis, Insights and Forecast - by Manufacturing Process
- 6. Asia Pacific Specialty Nitriles Market Analysis, Insights and Forecast, 2019-2031
- 6.1. Market Analysis, Insights and Forecast - by Manufacturing Process
- 6.1.1. Ammoxidation
- 6.1.2. Hydrocyanation
- 6.2. Market Analysis, Insights and Forecast - by Types
- 6.2.1. Nitrile Butadiene Rubber
- 6.2.2. Hydrogenated Nitrile Butadiene Rubber
- 6.2.3. Others
- 6.3. Market Analysis, Insights and Forecast - by Application
- 6.3.1. Protective Gloves
- 6.3.2. Automotive Components
- 6.3.3. Electronic Components
- 6.3.4. Adhesives & Sealants
- 6.3.5. Oilfield Applications
- 6.3.6. Others
- 6.1. Market Analysis, Insights and Forecast - by Manufacturing Process
- 7. North America Specialty Nitriles Market Analysis, Insights and Forecast, 2019-2031
- 7.1. Market Analysis, Insights and Forecast - by Manufacturing Process
- 7.1.1. Ammoxidation
- 7.1.2. Hydrocyanation
- 7.2. Market Analysis, Insights and Forecast - by Types
- 7.2.1. Nitrile Butadiene Rubber
- 7.2.2. Hydrogenated Nitrile Butadiene Rubber
- 7.2.3. Others
- 7.3. Market Analysis, Insights and Forecast - by Application
- 7.3.1. Protective Gloves
- 7.3.2. Automotive Components
- 7.3.3. Electronic Components
- 7.3.4. Adhesives & Sealants
- 7.3.5. Oilfield Applications
- 7.3.6. Others
- 7.1. Market Analysis, Insights and Forecast - by Manufacturing Process
- 8. Europe Specialty Nitriles Market Analysis, Insights and Forecast, 2019-2031
- 8.1. Market Analysis, Insights and Forecast - by Manufacturing Process
- 8.1.1. Ammoxidation
- 8.1.2. Hydrocyanation
- 8.2. Market Analysis, Insights and Forecast - by Types
- 8.2.1. Nitrile Butadiene Rubber
- 8.2.2. Hydrogenated Nitrile Butadiene Rubber
- 8.2.3. Others
- 8.3. Market Analysis, Insights and Forecast - by Application
- 8.3.1. Protective Gloves
- 8.3.2. Automotive Components
- 8.3.3. Electronic Components
- 8.3.4. Adhesives & Sealants
- 8.3.5. Oilfield Applications
- 8.3.6. Others
- 8.1. Market Analysis, Insights and Forecast - by Manufacturing Process
- 9. South America Specialty Nitriles Market Analysis, Insights and Forecast, 2019-2031
- 9.1. Market Analysis, Insights and Forecast - by Manufacturing Process
- 9.1.1. Ammoxidation
- 9.1.2. Hydrocyanation
- 9.2. Market Analysis, Insights and Forecast - by Types
- 9.2.1. Nitrile Butadiene Rubber
- 9.2.2. Hydrogenated Nitrile Butadiene Rubber
- 9.2.3. Others
- 9.3. Market Analysis, Insights and Forecast - by Application
- 9.3.1. Protective Gloves
- 9.3.2. Automotive Components
- 9.3.3. Electronic Components
- 9.3.4. Adhesives & Sealants
- 9.3.5. Oilfield Applications
- 9.3.6. Others
- 9.1. Market Analysis, Insights and Forecast - by Manufacturing Process
- 10. Middle East and Africa Specialty Nitriles Market Analysis, Insights and Forecast, 2019-2031
- 10.1. Market Analysis, Insights and Forecast - by Manufacturing Process
- 10.1.1. Ammoxidation
- 10.1.2. Hydrocyanation
- 10.2. Market Analysis, Insights and Forecast - by Types
- 10.2.1. Nitrile Butadiene Rubber
- 10.2.2. Hydrogenated Nitrile Butadiene Rubber
- 10.2.3. Others
- 10.3. Market Analysis, Insights and Forecast - by Application
- 10.3.1. Protective Gloves
- 10.3.2. Automotive Components
- 10.3.3. Electronic Components
- 10.3.4. Adhesives & Sealants
- 10.3.5. Oilfield Applications
- 10.3.6. Others
- 10.1. Market Analysis, Insights and Forecast - by Manufacturing Process
- 11. North America Specialty Nitriles Market Analysis, Insights and Forecast, 2019-2031
- 11.1. Market Analysis, Insights and Forecast - By Country/Sub-region
- 11.1.1 United States
- 11.1.2 Canada
- 11.1.3 Mexico
- 12. Europe Specialty Nitriles Market Analysis, Insights and Forecast, 2019-2031
- 12.1. Market Analysis, Insights and Forecast - By Country/Sub-region
- 12.1.1 Germany
- 12.1.2 France
- 12.1.3 Italy
- 12.1.4 United Kingdom
- 12.1.5 Netherlands
- 12.1.6 Rest of Europe
- 13. Asia Pacific Specialty Nitriles Market Analysis, Insights and Forecast, 2019-2031
- 13.1. Market Analysis, Insights and Forecast - By Country/Sub-region
- 13.1.1 China
- 13.1.2 Japan
- 13.1.3 India
- 13.1.4 South Korea
- 13.1.5 Taiwan
- 13.1.6 Australia
- 13.1.7 Rest of Asia-Pacific
- 14. South America Specialty Nitriles Market Analysis, Insights and Forecast, 2019-2031
- 14.1. Market Analysis, Insights and Forecast - By Country/Sub-region
- 14.1.1 Brazil
- 14.1.2 Argentina
- 14.1.3 Rest of South America
- 15. MEA Specialty Nitriles Market Analysis, Insights and Forecast, 2019-2031
- 15.1. Market Analysis, Insights and Forecast - By Country/Sub-region
- 15.1.1 Middle East
- 15.1.2 Africa
- 16. Competitive Analysis
- 16.1. Global Market Share Analysis 2024
- 16.2. Company Profiles
- 16.2.1 INEOS
- 16.2.1.1. Overview
- 16.2.1.2. Products
- 16.2.1.3. SWOT Analysis
- 16.2.1.4. Recent Developments
- 16.2.1.5. Financials (Based on Availability)
- 16.2.2 Duraco
- 16.2.2.1. Overview
- 16.2.2.2. Products
- 16.2.2.3. SWOT Analysis
- 16.2.2.4. Recent Developments
- 16.2.2.5. Financials (Based on Availability)
- 16.2.3 Ascend Performance Materials
- 16.2.3.1. Overview
- 16.2.3.2. Products
- 16.2.3.3. SWOT Analysis
- 16.2.3.4. Recent Developments
- 16.2.3.5. Financials (Based on Availability)
- 16.2.4 AlzChem Group AG
- 16.2.4.1. Overview
- 16.2.4.2. Products
- 16.2.4.3. SWOT Analysis
- 16.2.4.4. Recent Developments
- 16.2.4.5. Financials (Based on Availability)
- 16.2.5 Denicso
- 16.2.5.1. Overview
- 16.2.5.2. Products
- 16.2.5.3. SWOT Analysis
- 16.2.5.4. Recent Developments
- 16.2.5.5. Financials (Based on Availability)
- 16.2.6 Speciality Tapes
- 16.2.6.1. Overview
- 16.2.6.2. Products
- 16.2.6.3. SWOT Analysis
- 16.2.6.4. Recent Developments
- 16.2.6.5. Financials (Based on Availability)
- 16.2.7 TIDI Products LLC
- 16.2.7.1. Overview
- 16.2.7.2. Products
- 16.2.7.3. SWOT Analysis
- 16.2.7.4. Recent Developments
- 16.2.7.5. Financials (Based on Availability)
- 16.2.8 Emerald Performance Materials
- 16.2.8.1. Overview
- 16.2.8.2. Products
- 16.2.8.3. SWOT Analysis
- 16.2.8.4. Recent Developments
- 16.2.8.5. Financials (Based on Availability)
- 16.2.9 Parchem fine & specialty chemicals
- 16.2.9.1. Overview
- 16.2.9.2. Products
- 16.2.9.3. SWOT Analysis
- 16.2.9.4. Recent Developments
- 16.2.9.5. Financials (Based on Availability)
- 16.2.10 Marco Rubber & Plastics LLC
- 16.2.10.1. Overview
- 16.2.10.2. Products
- 16.2.10.3. SWOT Analysis
- 16.2.10.4. Recent Developments
- 16.2.10.5. Financials (Based on Availability)
- 16.2.11 Zeon Chemicals L P
- 16.2.11.1. Overview
- 16.2.11.2. Products
- 16.2.11.3. SWOT Analysis
- 16.2.11.4. Recent Developments
- 16.2.11.5. Financials (Based on Availability)
- 16.2.1 INEOS
List of Figures
- Figure 1: Global Specialty Nitriles Market Revenue Breakdown (Billion, %) by Region 2024 & 2032
- Figure 2: Global Specialty Nitriles Market Volume Breakdown (K Tons, %) by Region 2024 & 2032
- Figure 3: North America Specialty Nitriles Market Revenue (Billion), by Country 2024 & 2032
- Figure 4: North America Specialty Nitriles Market Volume (K Tons), by Country 2024 & 2032
- Figure 5: North America Specialty Nitriles Market Revenue Share (%), by Country 2024 & 2032
- Figure 6: North America Specialty Nitriles Market Volume Share (%), by Country 2024 & 2032
- Figure 7: Europe Specialty Nitriles Market Revenue (Billion), by Country 2024 & 2032
- Figure 8: Europe Specialty Nitriles Market Volume (K Tons), by Country 2024 & 2032
- Figure 9: Europe Specialty Nitriles Market Revenue Share (%), by Country 2024 & 2032
- Figure 10: Europe Specialty Nitriles Market Volume Share (%), by Country 2024 & 2032
- Figure 11: Asia Pacific Specialty Nitriles Market Revenue (Billion), by Country 2024 & 2032
- Figure 12: Asia Pacific Specialty Nitriles Market Volume (K Tons), by Country 2024 & 2032
- Figure 13: Asia Pacific Specialty Nitriles Market Revenue Share (%), by Country 2024 & 2032
- Figure 14: Asia Pacific Specialty Nitriles Market Volume Share (%), by Country 2024 & 2032
- Figure 15: South America Specialty Nitriles Market Revenue (Billion), by Country 2024 & 2032
- Figure 16: South America Specialty Nitriles Market Volume (K Tons), by Country 2024 & 2032
- Figure 17: South America Specialty Nitriles Market Revenue Share (%), by Country 2024 & 2032
- Figure 18: South America Specialty Nitriles Market Volume Share (%), by Country 2024 & 2032
- Figure 19: MEA Specialty Nitriles Market Revenue (Billion), by Country 2024 & 2032
- Figure 20: MEA Specialty Nitriles Market Volume (K Tons), by Country 2024 & 2032
- Figure 21: MEA Specialty Nitriles Market Revenue Share (%), by Country 2024 & 2032
- Figure 22: MEA Specialty Nitriles Market Volume Share (%), by Country 2024 & 2032
- Figure 23: Asia Pacific Specialty Nitriles Market Revenue (Billion), by Manufacturing Process 2024 & 2032
- Figure 24: Asia Pacific Specialty Nitriles Market Volume (K Tons), by Manufacturing Process 2024 & 2032
- Figure 25: Asia Pacific Specialty Nitriles Market Revenue Share (%), by Manufacturing Process 2024 & 2032
- Figure 26: Asia Pacific Specialty Nitriles Market Volume Share (%), by Manufacturing Process 2024 & 2032
- Figure 27: Asia Pacific Specialty Nitriles Market Revenue (Billion), by Types 2024 & 2032
- Figure 28: Asia Pacific Specialty Nitriles Market Volume (K Tons), by Types 2024 & 2032
- Figure 29: Asia Pacific Specialty Nitriles Market Revenue Share (%), by Types 2024 & 2032
- Figure 30: Asia Pacific Specialty Nitriles Market Volume Share (%), by Types 2024 & 2032
- Figure 31: Asia Pacific Specialty Nitriles Market Revenue (Billion), by Application 2024 & 2032
- Figure 32: Asia Pacific Specialty Nitriles Market Volume (K Tons), by Application 2024 & 2032
- Figure 33: Asia Pacific Specialty Nitriles Market Revenue Share (%), by Application 2024 & 2032
- Figure 34: Asia Pacific Specialty Nitriles Market Volume Share (%), by Application 2024 & 2032
- Figure 35: Asia Pacific Specialty Nitriles Market Revenue (Billion), by Country 2024 & 2032
- Figure 36: Asia Pacific Specialty Nitriles Market Volume (K Tons), by Country 2024 & 2032
- Figure 37: Asia Pacific Specialty Nitriles Market Revenue Share (%), by Country 2024 & 2032
- Figure 38: Asia Pacific Specialty Nitriles Market Volume Share (%), by Country 2024 & 2032
- Figure 39: North America Specialty Nitriles Market Revenue (Billion), by Manufacturing Process 2024 & 2032
- Figure 40: North America Specialty Nitriles Market Volume (K Tons), by Manufacturing Process 2024 & 2032
- Figure 41: North America Specialty Nitriles Market Revenue Share (%), by Manufacturing Process 2024 & 2032
- Figure 42: North America Specialty Nitriles Market Volume Share (%), by Manufacturing Process 2024 & 2032
- Figure 43: North America Specialty Nitriles Market Revenue (Billion), by Types 2024 & 2032
- Figure 44: North America Specialty Nitriles Market Volume (K Tons), by Types 2024 & 2032
- Figure 45: North America Specialty Nitriles Market Revenue Share (%), by Types 2024 & 2032
- Figure 46: North America Specialty Nitriles Market Volume Share (%), by Types 2024 & 2032
- Figure 47: North America Specialty Nitriles Market Revenue (Billion), by Application 2024 & 2032
- Figure 48: North America Specialty Nitriles Market Volume (K Tons), by Application 2024 & 2032
- Figure 49: North America Specialty Nitriles Market Revenue Share (%), by Application 2024 & 2032
- Figure 50: North America Specialty Nitriles Market Volume Share (%), by Application 2024 & 2032
- Figure 51: North America Specialty Nitriles Market Revenue (Billion), by Country 2024 & 2032
- Figure 52: North America Specialty Nitriles Market Volume (K Tons), by Country 2024 & 2032
- Figure 53: North America Specialty Nitriles Market Revenue Share (%), by Country 2024 & 2032
- Figure 54: North America Specialty Nitriles Market Volume Share (%), by Country 2024 & 2032
- Figure 55: Europe Specialty Nitriles Market Revenue (Billion), by Manufacturing Process 2024 & 2032
- Figure 56: Europe Specialty Nitriles Market Volume (K Tons), by Manufacturing Process 2024 & 2032
- Figure 57: Europe Specialty Nitriles Market Revenue Share (%), by Manufacturing Process 2024 & 2032
- Figure 58: Europe Specialty Nitriles Market Volume Share (%), by Manufacturing Process 2024 & 2032
- Figure 59: Europe Specialty Nitriles Market Revenue (Billion), by Types 2024 & 2032
- Figure 60: Europe Specialty Nitriles Market Volume (K Tons), by Types 2024 & 2032
- Figure 61: Europe Specialty Nitriles Market Revenue Share (%), by Types 2024 & 2032
- Figure 62: Europe Specialty Nitriles Market Volume Share (%), by Types 2024 & 2032
- Figure 63: Europe Specialty Nitriles Market Revenue (Billion), by Application 2024 & 2032
- Figure 64: Europe Specialty Nitriles Market Volume (K Tons), by Application 2024 & 2032
- Figure 65: Europe Specialty Nitriles Market Revenue Share (%), by Application 2024 & 2032
- Figure 66: Europe Specialty Nitriles Market Volume Share (%), by Application 2024 & 2032
- Figure 67: Europe Specialty Nitriles Market Revenue (Billion), by Country 2024 & 2032
- Figure 68: Europe Specialty Nitriles Market Volume (K Tons), by Country 2024 & 2032
- Figure 69: Europe Specialty Nitriles Market Revenue Share (%), by Country 2024 & 2032
- Figure 70: Europe Specialty Nitriles Market Volume Share (%), by Country 2024 & 2032
- Figure 71: South America Specialty Nitriles Market Revenue (Billion), by Manufacturing Process 2024 & 2032
- Figure 72: South America Specialty Nitriles Market Volume (K Tons), by Manufacturing Process 2024 & 2032
- Figure 73: South America Specialty Nitriles Market Revenue Share (%), by Manufacturing Process 2024 & 2032
- Figure 74: South America Specialty Nitriles Market Volume Share (%), by Manufacturing Process 2024 & 2032
- Figure 75: South America Specialty Nitriles Market Revenue (Billion), by Types 2024 & 2032
- Figure 76: South America Specialty Nitriles Market Volume (K Tons), by Types 2024 & 2032
- Figure 77: South America Specialty Nitriles Market Revenue Share (%), by Types 2024 & 2032
- Figure 78: South America Specialty Nitriles Market Volume Share (%), by Types 2024 & 2032
- Figure 79: South America Specialty Nitriles Market Revenue (Billion), by Application 2024 & 2032
- Figure 80: South America Specialty Nitriles Market Volume (K Tons), by Application 2024 & 2032
- Figure 81: South America Specialty Nitriles Market Revenue Share (%), by Application 2024 & 2032
- Figure 82: South America Specialty Nitriles Market Volume Share (%), by Application 2024 & 2032
- Figure 83: South America Specialty Nitriles Market Revenue (Billion), by Country 2024 & 2032
- Figure 84: South America Specialty Nitriles Market Volume (K Tons), by Country 2024 & 2032
- Figure 85: South America Specialty Nitriles Market Revenue Share (%), by Country 2024 & 2032
- Figure 86: South America Specialty Nitriles Market Volume Share (%), by Country 2024 & 2032
- Figure 87: Middle East and Africa Specialty Nitriles Market Revenue (Billion), by Manufacturing Process 2024 & 2032
- Figure 88: Middle East and Africa Specialty Nitriles Market Volume (K Tons), by Manufacturing Process 2024 & 2032
- Figure 89: Middle East and Africa Specialty Nitriles Market Revenue Share (%), by Manufacturing Process 2024 & 2032
- Figure 90: Middle East and Africa Specialty Nitriles Market Volume Share (%), by Manufacturing Process 2024 & 2032
- Figure 91: Middle East and Africa Specialty Nitriles Market Revenue (Billion), by Types 2024 & 2032
- Figure 92: Middle East and Africa Specialty Nitriles Market Volume (K Tons), by Types 2024 & 2032
- Figure 93: Middle East and Africa Specialty Nitriles Market Revenue Share (%), by Types 2024 & 2032
- Figure 94: Middle East and Africa Specialty Nitriles Market Volume Share (%), by Types 2024 & 2032
- Figure 95: Middle East and Africa Specialty Nitriles Market Revenue (Billion), by Application 2024 & 2032
- Figure 96: Middle East and Africa Specialty Nitriles Market Volume (K Tons), by Application 2024 & 2032
- Figure 97: Middle East and Africa Specialty Nitriles Market Revenue Share (%), by Application 2024 & 2032
- Figure 98: Middle East and Africa Specialty Nitriles Market Volume Share (%), by Application 2024 & 2032
- Figure 99: Middle East and Africa Specialty Nitriles Market Revenue (Billion), by Country 2024 & 2032
- Figure 100: Middle East and Africa Specialty Nitriles Market Volume (K Tons), by Country 2024 & 2032
- Figure 101: Middle East and Africa Specialty Nitriles Market Revenue Share (%), by Country 2024 & 2032
- Figure 102: Middle East and Africa Specialty Nitriles Market Volume Share (%), by Country 2024 & 2032
List of Tables
- Table 1: Global Specialty Nitriles Market Revenue Billion Forecast, by Region 2019 & 2032
- Table 2: Global Specialty Nitriles Market Volume K Tons Forecast, by Region 2019 & 2032
- Table 3: Global Specialty Nitriles Market Revenue Billion Forecast, by Manufacturing Process 2019 & 2032
- Table 4: Global Specialty Nitriles Market Volume K Tons Forecast, by Manufacturing Process 2019 & 2032
- Table 5: Global Specialty Nitriles Market Revenue Billion Forecast, by Types 2019 & 2032
- Table 6: Global Specialty Nitriles Market Volume K Tons Forecast, by Types 2019 & 2032
- Table 7: Global Specialty Nitriles Market Revenue Billion Forecast, by Application 2019 & 2032
- Table 8: Global Specialty Nitriles Market Volume K Tons Forecast, by Application 2019 & 2032
- Table 9: Global Specialty Nitriles Market Revenue Billion Forecast, by Region 2019 & 2032
- Table 10: Global Specialty Nitriles Market Volume K Tons Forecast, by Region 2019 & 2032
- Table 11: Global Specialty Nitriles Market Revenue Billion Forecast, by Country 2019 & 2032
- Table 12: Global Specialty Nitriles Market Volume K Tons Forecast, by Country 2019 & 2032
- Table 13: United States Specialty Nitriles Market Revenue (Billion) Forecast, by Application 2019 & 2032
- Table 14: United States Specialty Nitriles Market Volume (K Tons) Forecast, by Application 2019 & 2032
- Table 15: Canada Specialty Nitriles Market Revenue (Billion) Forecast, by Application 2019 & 2032
- Table 16: Canada Specialty Nitriles Market Volume (K Tons) Forecast, by Application 2019 & 2032
- Table 17: Mexico Specialty Nitriles Market Revenue (Billion) Forecast, by Application 2019 & 2032
- Table 18: Mexico Specialty Nitriles Market Volume (K Tons) Forecast, by Application 2019 & 2032
- Table 19: Global Specialty Nitriles Market Revenue Billion Forecast, by Country 2019 & 2032
- Table 20: Global Specialty Nitriles Market Volume K Tons Forecast, by Country 2019 & 2032
- Table 21: Germany Specialty Nitriles Market Revenue (Billion) Forecast, by Application 2019 & 2032
- Table 22: Germany Specialty Nitriles Market Volume (K Tons) Forecast, by Application 2019 & 2032
- Table 23: France Specialty Nitriles Market Revenue (Billion) Forecast, by Application 2019 & 2032
- Table 24: France Specialty Nitriles Market Volume (K Tons) Forecast, by Application 2019 & 2032
- Table 25: Italy Specialty Nitriles Market Revenue (Billion) Forecast, by Application 2019 & 2032
- Table 26: Italy Specialty Nitriles Market Volume (K Tons) Forecast, by Application 2019 & 2032
- Table 27: United Kingdom Specialty Nitriles Market Revenue (Billion) Forecast, by Application 2019 & 2032
- Table 28: United Kingdom Specialty Nitriles Market Volume (K Tons) Forecast, by Application 2019 & 2032
- Table 29: Netherlands Specialty Nitriles Market Revenue (Billion) Forecast, by Application 2019 & 2032
- Table 30: Netherlands Specialty Nitriles Market Volume (K Tons) Forecast, by Application 2019 & 2032
- Table 31: Rest of Europe Specialty Nitriles Market Revenue (Billion) Forecast, by Application 2019 & 2032
- Table 32: Rest of Europe Specialty Nitriles Market Volume (K Tons) Forecast, by Application 2019 & 2032
- Table 33: Global Specialty Nitriles Market Revenue Billion Forecast, by Country 2019 & 2032
- Table 34: Global Specialty Nitriles Market Volume K Tons Forecast, by Country 2019 & 2032
- Table 35: China Specialty Nitriles Market Revenue (Billion) Forecast, by Application 2019 & 2032
- Table 36: China Specialty Nitriles Market Volume (K Tons) Forecast, by Application 2019 & 2032
- Table 37: Japan Specialty Nitriles Market Revenue (Billion) Forecast, by Application 2019 & 2032
- Table 38: Japan Specialty Nitriles Market Volume (K Tons) Forecast, by Application 2019 & 2032
- Table 39: India Specialty Nitriles Market Revenue (Billion) Forecast, by Application 2019 & 2032
- Table 40: India Specialty Nitriles Market Volume (K Tons) Forecast, by Application 2019 & 2032
- Table 41: South Korea Specialty Nitriles Market Revenue (Billion) Forecast, by Application 2019 & 2032
- Table 42: South Korea Specialty Nitriles Market Volume (K Tons) Forecast, by Application 2019 & 2032
- Table 43: Taiwan Specialty Nitriles Market Revenue (Billion) Forecast, by Application 2019 & 2032
- Table 44: Taiwan Specialty Nitriles Market Volume (K Tons) Forecast, by Application 2019 & 2032
- Table 45: Australia Specialty Nitriles Market Revenue (Billion) Forecast, by Application 2019 & 2032
- Table 46: Australia Specialty Nitriles Market Volume (K Tons) Forecast, by Application 2019 & 2032
- Table 47: Rest of Asia-Pacific Specialty Nitriles Market Revenue (Billion) Forecast, by Application 2019 & 2032
- Table 48: Rest of Asia-Pacific Specialty Nitriles Market Volume (K Tons) Forecast, by Application 2019 & 2032
- Table 49: Global Specialty Nitriles Market Revenue Billion Forecast, by Country 2019 & 2032
- Table 50: Global Specialty Nitriles Market Volume K Tons Forecast, by Country 2019 & 2032
- Table 51: Brazil Specialty Nitriles Market Revenue (Billion) Forecast, by Application 2019 & 2032
- Table 52: Brazil Specialty Nitriles Market Volume (K Tons) Forecast, by Application 2019 & 2032
- Table 53: Argentina Specialty Nitriles Market Revenue (Billion) Forecast, by Application 2019 & 2032
- Table 54: Argentina Specialty Nitriles Market Volume (K Tons) Forecast, by Application 2019 & 2032
- Table 55: Rest of South America Specialty Nitriles Market Revenue (Billion) Forecast, by Application 2019 & 2032
- Table 56: Rest of South America Specialty Nitriles Market Volume (K Tons) Forecast, by Application 2019 & 2032
- Table 57: Global Specialty Nitriles Market Revenue Billion Forecast, by Country 2019 & 2032
- Table 58: Global Specialty Nitriles Market Volume K Tons Forecast, by Country 2019 & 2032
- Table 59: Middle East Specialty Nitriles Market Revenue (Billion) Forecast, by Application 2019 & 2032
- Table 60: Middle East Specialty Nitriles Market Volume (K Tons) Forecast, by Application 2019 & 2032
- Table 61: Africa Specialty Nitriles Market Revenue (Billion) Forecast, by Application 2019 & 2032
- Table 62: Africa Specialty Nitriles Market Volume (K Tons) Forecast, by Application 2019 & 2032
- Table 63: Global Specialty Nitriles Market Revenue Billion Forecast, by Manufacturing Process 2019 & 2032
- Table 64: Global Specialty Nitriles Market Volume K Tons Forecast, by Manufacturing Process 2019 & 2032
- Table 65: Global Specialty Nitriles Market Revenue Billion Forecast, by Types 2019 & 2032
- Table 66: Global Specialty Nitriles Market Volume K Tons Forecast, by Types 2019 & 2032
- Table 67: Global Specialty Nitriles Market Revenue Billion Forecast, by Application 2019 & 2032
- Table 68: Global Specialty Nitriles Market Volume K Tons Forecast, by Application 2019 & 2032
- Table 69: Global Specialty Nitriles Market Revenue Billion Forecast, by Country 2019 & 2032
- Table 70: Global Specialty Nitriles Market Volume K Tons Forecast, by Country 2019 & 2032
- Table 71: China Specialty Nitriles Market Revenue (Billion) Forecast, by Application 2019 & 2032
- Table 72: China Specialty Nitriles Market Volume (K Tons) Forecast, by Application 2019 & 2032
- Table 73: India Specialty Nitriles Market Revenue (Billion) Forecast, by Application 2019 & 2032
- Table 74: India Specialty Nitriles Market Volume (K Tons) Forecast, by Application 2019 & 2032
- Table 75: Japan Specialty Nitriles Market Revenue (Billion) Forecast, by Application 2019 & 2032
- Table 76: Japan Specialty Nitriles Market Volume (K Tons) Forecast, by Application 2019 & 2032
- Table 77: South Korea Specialty Nitriles Market Revenue (Billion) Forecast, by Application 2019 & 2032
- Table 78: South Korea Specialty Nitriles Market Volume (K Tons) Forecast, by Application 2019 & 2032
- Table 79: Rest of Asia Pacific Specialty Nitriles Market Revenue (Billion) Forecast, by Application 2019 & 2032
- Table 80: Rest of Asia Pacific Specialty Nitriles Market Volume (K Tons) Forecast, by Application 2019 & 2032
- Table 81: Global Specialty Nitriles Market Revenue Billion Forecast, by Manufacturing Process 2019 & 2032
- Table 82: Global Specialty Nitriles Market Volume K Tons Forecast, by Manufacturing Process 2019 & 2032
- Table 83: Global Specialty Nitriles Market Revenue Billion Forecast, by Types 2019 & 2032
- Table 84: Global Specialty Nitriles Market Volume K Tons Forecast, by Types 2019 & 2032
- Table 85: Global Specialty Nitriles Market Revenue Billion Forecast, by Application 2019 & 2032
- Table 86: Global Specialty Nitriles Market Volume K Tons Forecast, by Application 2019 & 2032
- Table 87: Global Specialty Nitriles Market Revenue Billion Forecast, by Country 2019 & 2032
- Table 88: Global Specialty Nitriles Market Volume K Tons Forecast, by Country 2019 & 2032
- Table 89: United States Specialty Nitriles Market Revenue (Billion) Forecast, by Application 2019 & 2032
- Table 90: United States Specialty Nitriles Market Volume (K Tons) Forecast, by Application 2019 & 2032
- Table 91: Canada Specialty Nitriles Market Revenue (Billion) Forecast, by Application 2019 & 2032
- Table 92: Canada Specialty Nitriles Market Volume (K Tons) Forecast, by Application 2019 & 2032
- Table 93: Mexico Specialty Nitriles Market Revenue (Billion) Forecast, by Application 2019 & 2032
- Table 94: Mexico Specialty Nitriles Market Volume (K Tons) Forecast, by Application 2019 & 2032
- Table 95: Global Specialty Nitriles Market Revenue Billion Forecast, by Manufacturing Process 2019 & 2032
- Table 96: Global Specialty Nitriles Market Volume K Tons Forecast, by Manufacturing Process 2019 & 2032
- Table 97: Global Specialty Nitriles Market Revenue Billion Forecast, by Types 2019 & 2032
- Table 98: Global Specialty Nitriles Market Volume K Tons Forecast, by Types 2019 & 2032
- Table 99: Global Specialty Nitriles Market Revenue Billion Forecast, by Application 2019 & 2032
- Table 100: Global Specialty Nitriles Market Volume K Tons Forecast, by Application 2019 & 2032
- Table 101: Global Specialty Nitriles Market Revenue Billion Forecast, by Country 2019 & 2032
- Table 102: Global Specialty Nitriles Market Volume K Tons Forecast, by Country 2019 & 2032
- Table 103: Germany Specialty Nitriles Market Revenue (Billion) Forecast, by Application 2019 & 2032
- Table 104: Germany Specialty Nitriles Market Volume (K Tons) Forecast, by Application 2019 & 2032
- Table 105: United Kingdom Specialty Nitriles Market Revenue (Billion) Forecast, by Application 2019 & 2032
- Table 106: United Kingdom Specialty Nitriles Market Volume (K Tons) Forecast, by Application 2019 & 2032
- Table 107: France Specialty Nitriles Market Revenue (Billion) Forecast, by Application 2019 & 2032
- Table 108: France Specialty Nitriles Market Volume (K Tons) Forecast, by Application 2019 & 2032
- Table 109: Italy Specialty Nitriles Market Revenue (Billion) Forecast, by Application 2019 & 2032
- Table 110: Italy Specialty Nitriles Market Volume (K Tons) Forecast, by Application 2019 & 2032
- Table 111: Rest of Europe Specialty Nitriles Market Revenue (Billion) Forecast, by Application 2019 & 2032
- Table 112: Rest of Europe Specialty Nitriles Market Volume (K Tons) Forecast, by Application 2019 & 2032
- Table 113: Global Specialty Nitriles Market Revenue Billion Forecast, by Manufacturing Process 2019 & 2032
- Table 114: Global Specialty Nitriles Market Volume K Tons Forecast, by Manufacturing Process 2019 & 2032
- Table 115: Global Specialty Nitriles Market Revenue Billion Forecast, by Types 2019 & 2032
- Table 116: Global Specialty Nitriles Market Volume K Tons Forecast, by Types 2019 & 2032
- Table 117: Global Specialty Nitriles Market Revenue Billion Forecast, by Application 2019 & 2032
- Table 118: Global Specialty Nitriles Market Volume K Tons Forecast, by Application 2019 & 2032
- Table 119: Global Specialty Nitriles Market Revenue Billion Forecast, by Country 2019 & 2032
- Table 120: Global Specialty Nitriles Market Volume K Tons Forecast, by Country 2019 & 2032
- Table 121: Brazil Specialty Nitriles Market Revenue (Billion) Forecast, by Application 2019 & 2032
- Table 122: Brazil Specialty Nitriles Market Volume (K Tons) Forecast, by Application 2019 & 2032
- Table 123: Argentina Specialty Nitriles Market Revenue (Billion) Forecast, by Application 2019 & 2032
- Table 124: Argentina Specialty Nitriles Market Volume (K Tons) Forecast, by Application 2019 & 2032
- Table 125: Rest of South America Specialty Nitriles Market Revenue (Billion) Forecast, by Application 2019 & 2032
- Table 126: Rest of South America Specialty Nitriles Market Volume (K Tons) Forecast, by Application 2019 & 2032
- Table 127: Global Specialty Nitriles Market Revenue Billion Forecast, by Manufacturing Process 2019 & 2032
- Table 128: Global Specialty Nitriles Market Volume K Tons Forecast, by Manufacturing Process 2019 & 2032
- Table 129: Global Specialty Nitriles Market Revenue Billion Forecast, by Types 2019 & 2032
- Table 130: Global Specialty Nitriles Market Volume K Tons Forecast, by Types 2019 & 2032
- Table 131: Global Specialty Nitriles Market Revenue Billion Forecast, by Application 2019 & 2032
- Table 132: Global Specialty Nitriles Market Volume K Tons Forecast, by Application 2019 & 2032
- Table 133: Global Specialty Nitriles Market Revenue Billion Forecast, by Country 2019 & 2032
- Table 134: Global Specialty Nitriles Market Volume K Tons Forecast, by Country 2019 & 2032
- Table 135: Saudi Arabia Specialty Nitriles Market Revenue (Billion) Forecast, by Application 2019 & 2032
- Table 136: Saudi Arabia Specialty Nitriles Market Volume (K Tons) Forecast, by Application 2019 & 2032
- Table 137: South Africa Specialty Nitriles Market Revenue (Billion) Forecast, by Application 2019 & 2032
- Table 138: South Africa Specialty Nitriles Market Volume (K Tons) Forecast, by Application 2019 & 2032
- Table 139: Rest of Middle East and Africa Specialty Nitriles Market Revenue (Billion) Forecast, by Application 2019 & 2032
- Table 140: Rest of Middle East and Africa Specialty Nitriles Market Volume (K Tons) Forecast, by Application 2019 & 2032
Frequently Asked Questions
1. What is the projected Compound Annual Growth Rate (CAGR) of the Specialty Nitriles Market?
The projected CAGR is approximately 4.5%.
2. Which companies are prominent players in the Specialty Nitriles Market?
Key companies in the market include INEOS, Duraco, Ascend Performance Materials, AlzChem Group AG, Denicso, Speciality Tapes, TIDI Products LLC, Emerald Performance Materials, Parchem fine & specialty chemicals, Marco Rubber & Plastics LLC, Zeon Chemicals L P .
3. What are the main segments of the Specialty Nitriles Market?
The market segments include Manufacturing Process, Types, Application.
4. Can you provide details about the market size?
The market size is estimated to be USD 2.9 Billion as of 2022.
5. What are some drivers contributing to market growth?
; Growing Applications in Automotive Industry; Others Drivers.
6. What are the notable trends driving market growth?
Automotive Components to Dominate the Market.
7. Are there any restraints impacting market growth?
; Health Hazard related to Nitrile Fumes; Unfavorable Conditions Arising Due to COVID-19 Outbreak.
8. Can you provide examples of recent developments in the market?
N/A
9. What pricing options are available for accessing the report?
Pricing options include single-user, multi-user, and enterprise licenses priced at USD 4750, USD 5250, and USD 8750 respectively.
10. Is the market size provided in terms of value or volume?
The market size is provided in terms of value, measured in Billion and volume, measured in K Tons.
11. Are there any specific market keywords associated with the report?
Yes, the market keyword associated with the report is "Specialty Nitriles Market," which aids in identifying and referencing the specific market segment covered.
12. How do I determine which pricing option suits my needs best?
The pricing options vary based on user requirements and access needs. Individual users may opt for single-user licenses, while businesses requiring broader access may choose multi-user or enterprise licenses for cost-effective access to the report.
13. Are there any additional resources or data provided in the Specialty Nitriles Market report?
While the report offers comprehensive insights, it's advisable to review the specific contents or supplementary materials provided to ascertain if additional resources or data are available.
14. How can I stay updated on further developments or reports in the Specialty Nitriles Market?
To stay informed about further developments, trends, and reports in the Specialty Nitriles Market, consider subscribing to industry newsletters, following relevant companies and organizations, or regularly checking reputable industry news sources and publications.
Methodology
Step 1 - Identification of Relevant Samples Size from Population Database


Step 2 - Approaches for Defining Global Market Size (Value, Volume* & Price*)

Note*: In applicable scenarios
Step 3 - Data Sources
Primary Research
- Web Analytics
- Survey Reports
- Research Institute
- Latest Research Reports
- Opinion Leaders
Secondary Research
- Annual Reports
- White Paper
- Latest Press Release
- Industry Association
- Paid Database
- Investor Presentations

Step 4 - Data Triangulation
Involves using different sources of information in order to increase the validity of a study
These sources are likely to be stakeholders in a program - participants, other researchers, program staff, other community members, and so on.
Then we put all data in single framework & apply various statistical tools to find out the dynamic on the market.
During the analysis stage, feedback from the stakeholder groups would be compared to determine areas of agreement as well as areas of divergence


