
Key Insights
The Poured-in-Place (PIP) rubber flooring market is poised for significant expansion, driven by increasing demand for safe and durable playground surfaces, alongside growing adoption in schools and public parks. With an estimated market size of $850 million in 2025, this sector is projected to witness a robust Compound Annual Growth Rate (CAGR) of 7.5% through 2033. This upward trajectory is fueled by the inherent advantages of PIP rubber, including its shock-absorbent properties that significantly reduce playground fall injuries, its seamless, unitary construction that eliminates trip hazards and harbors less bacteria, and its versatility in design and color. Furthermore, stringent safety regulations in public and educational spaces worldwide are acting as powerful catalysts for market growth, compelling authorities to invest in compliant and long-lasting surfacing solutions. The emphasis on creating safer recreational environments, coupled with advancements in rubber material technology leading to enhanced durability and aesthetic appeal, are key drivers sustaining this positive market outlook.
The market's growth is further supported by increasing investments in urban infrastructure and recreational facilities. While the primary application remains in playgrounds, the expanding use in schools for sports courts, gymnasiums, and high-traffic areas, as well as in parks for pathways and seating areas, diversifies revenue streams. However, the market is not without its challenges. The initial installation cost, which can be higher compared to traditional surfacing materials, presents a restraint, particularly for budget-conscious projects. Additionally, the need for specialized installation expertise and the potential for discoloration or degradation under prolonged UV exposure in certain formulations, though diminishing with technological advancements, are factors that installers and manufacturers continually address. Despite these hurdles, the long-term benefits of safety, low maintenance, and longevity are increasingly outweighing the initial investment, positioning the Poured-in-Place rubber flooring market for sustained and dynamic growth.
Poured In Place Rubber Flooring Market Report: Dynamics, Growth, and Outlook (2019-2033)
This comprehensive report delves into the global Poured In Place (PIP) Rubber Flooring market, offering an in-depth analysis of its dynamics, growth trajectories, and future outlook. Covering a study period from 2019 to 2033, with a base year of 2025, this report provides critical insights for industry professionals, manufacturers, investors, and stakeholders. The analysis meticulously dissects market structure, technological advancements, regulatory landscapes, competitive forces, and emerging opportunities, utilizing a wealth of quantitative data and qualitative assessments.
Poured In Place Rubber Flooring Market Dynamics & Structure
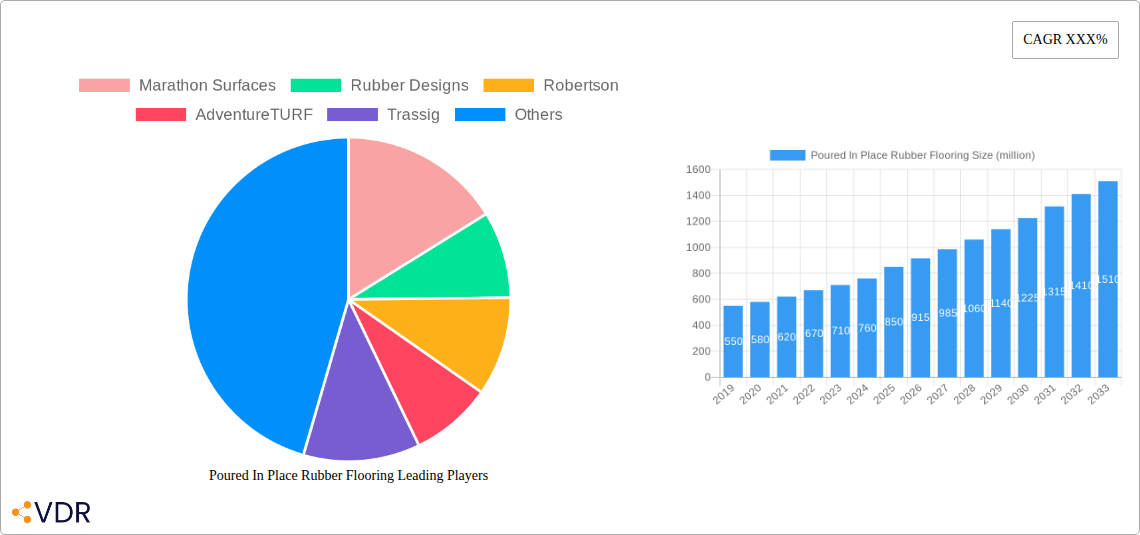
The global Poured In Place Rubber Flooring market exhibits a moderately concentrated structure, with a few key players holding significant market share, alongside a growing number of regional and specialized manufacturers. Technological innovation is a primary driver, fueled by the demand for enhanced safety features, durability, and aesthetic versatility in various applications. The development of advanced polymer formulations, UV-resistant binders, and impact-absorbing properties are at the forefront of innovation. Regulatory frameworks, particularly concerning playground safety standards and building codes for athletic facilities, play a crucial role in shaping market adoption and product development. Competitive product substitutes, such as artificial turf, wood, and other synthetic flooring materials, pose a challenge, necessitating continuous product differentiation and performance improvement. End-user demographics are shifting towards a greater appreciation for low-maintenance, shock-absorbent, and environmentally friendly flooring solutions. Mergers and acquisitions (M&A) are intermittently observed, aimed at consolidating market presence, expanding product portfolios, and acquiring specialized technologies.
- Market Concentration: Estimated to be moderately concentrated, with the top 5 players holding approximately 45% of the market share.
- Technological Innovation Drivers: Focus on enhanced shock absorption, UV resistance, slip resistance, and eco-friendly binders.
- Regulatory Frameworks: Stringent safety standards for playgrounds and sports facilities are a key influence.
- Competitive Product Substitutes: Artificial turf, wood, asphalt, and concrete are key alternatives.
- End-User Demographics: Increasing demand from educational institutions, public parks, and sports facilities seeking safe and durable surfacing.
- M&A Trends: Intermittent activity focused on market consolidation and technology acquisition. Estimated M&A deal volume: 10-15 deals annually.
Poured In Place Rubber Flooring Growth Trends & Insights
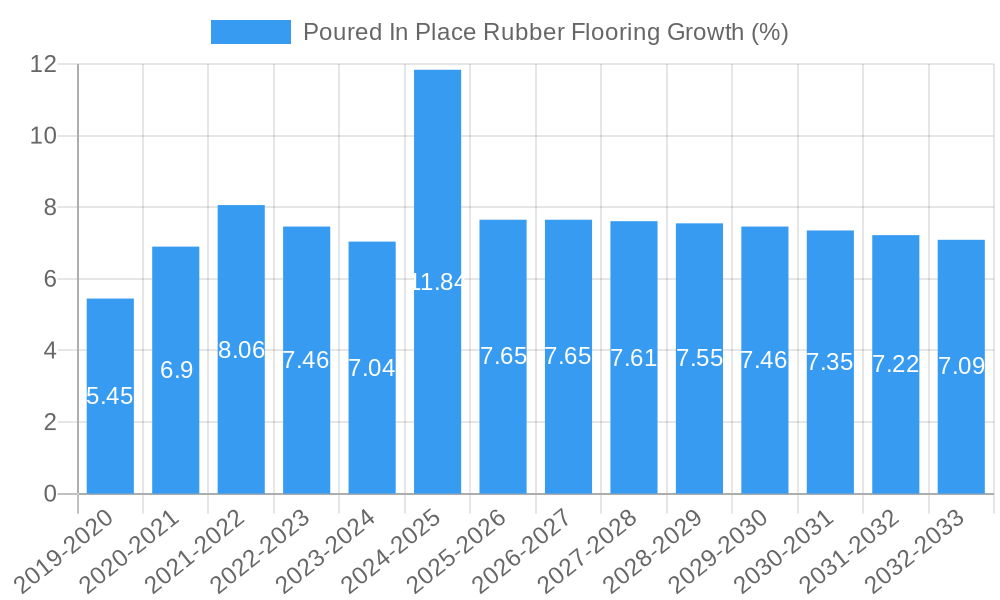
The Poured In Place Rubber Flooring market is poised for robust growth, driven by increasing awareness of its safety and performance benefits across a multitude of applications. The market size is projected to evolve significantly, from an estimated USD 1.5 billion in the base year 2025 to USD 2.2 billion by the end of the forecast period in 2033, reflecting a compound annual growth rate (CAGR) of approximately 5.5%. Adoption rates are steadily increasing, particularly in emerging economies, as infrastructure development and public amenity investments rise. Technological disruptions, such as the integration of recycled rubber content and the development of antimicrobial additives, are further enhancing the appeal of PIP rubber flooring. Consumer behavior shifts towards prioritizing safety, sustainability, and long-term cost-effectiveness are profoundly impacting purchasing decisions. The market penetration for PIP rubber flooring in its primary applications, such as playgrounds, is estimated to be around 60% in developed regions and growing at a faster pace in developing nations.
Dominant Regions, Countries, or Segments in Poured In Place Rubber Flooring
The Playground application segment is currently the dominant force driving growth in the global Poured In Place Rubber Flooring market. This dominance is attributed to stringent safety regulations mandating shock-absorbent surfacing to mitigate injuries from falls. Furthermore, the increasing focus on child well-being and the expansion of public recreational spaces in urban and suburban areas worldwide contribute significantly to this segment's growth.
- Dominant Segment: Playground Applications.
- Key Drivers for Playground Dominance:
- Global playground safety standards (e.g., ASTM, EN).
- Governmental initiatives for safe public spaces.
- High-impact absorption capabilities reducing injury severity.
- Durability and low maintenance requirements appealing to municipalities.
- Market Share within Dominant Segment: Playgrounds account for an estimated 55% of the total PIP rubber flooring market.
- Growth Potential: Continued investment in public infrastructure and a sustained emphasis on child safety ensure strong future growth.
The School application segment also represents a significant and rapidly growing market. Educational institutions are increasingly opting for PIP rubber flooring in playgrounds, gymnasiums, and multipurpose areas due to its safety, hygiene, and versatility. The demand for durable, easy-to-clean surfaces that can withstand heavy foot traffic and varied activities is a key differentiator.
- Significant Segment: School Applications.
- Key Drivers for School Adoption:
- Safe surfacing for school playgrounds and athletic fields.
- Hygiene and ease of cleaning for indoor facilities.
- Versatility for various sports and activities.
- Long-term cost-effectiveness compared to traditional flooring.
- Market Share within School Segment: Estimated at 25% of the total PIP rubber flooring market.
The Park segment, encompassing public parks and recreational areas, is another substantial contributor. The aesthetic appeal, weather resistance, and low maintenance of PIP rubber flooring make it an ideal choice for outdoor public spaces.
- Growing Segment: Park Applications.
- Key Drivers for Park Adoption:
- Aesthetic appeal and integration with natural landscapes.
- Weather resistance for outdoor durability.
- Low maintenance requirements for public spaces.
- Market Share within Park Segment: Estimated at 15% of the total PIP rubber flooring market.
Other applications, including commercial areas, fitness centers, and industrial settings, represent a smaller but growing segment, showcasing the expanding utility of PIP rubber flooring.
The Single Layer Flooring type holds a larger market share due to its cost-effectiveness and suitability for a wider range of standard applications. However, Double Layer Flooring is gaining traction for specialized applications requiring enhanced shock absorption and performance, particularly in professional sports facilities.
Poured In Place Rubber Flooring Product Landscape
The product landscape of Poured In Place Rubber Flooring is characterized by continuous innovation focused on enhanced performance and sustainability. Key developments include the incorporation of advanced UV stabilizers for increased color fastness and longevity, specialized binders that offer superior elasticity and impact absorption, and the increasing use of recycled tire rubber, aligning with environmental consciousness. Manufacturers are also developing proprietary formulations that offer tailored solutions for specific application needs, such as enhanced slip resistance for water parks or specialized cushioning for high-impact sports. The performance metrics being optimized include critical fall height ratings, abrasion resistance, and flexibility across a wide temperature range.
Key Drivers, Barriers & Challenges in Poured In Place Rubber Flooring
Key Drivers:
The Poured In Place Rubber Flooring market is propelled by several key drivers, including stringent playground safety regulations that mandate impact-absorbing surfaces, a growing global emphasis on child safety and well-being, and increasing investments in public recreational infrastructure. The durability, low maintenance, and versatility of PIP rubber flooring also contribute significantly to its adoption across various applications such as schools, parks, and athletic facilities.
Barriers & Challenges:
Despite its advantages, the market faces challenges such as the initial installation cost, which can be higher compared to some traditional flooring materials. Supply chain volatility for raw materials, particularly recycled rubber, and fluctuations in binder prices can impact profitability. Furthermore, the availability of skilled labor for precise installation and adherence to complex safety standards can be a bottleneck. Competitive pricing from alternative surfacing materials and the need for ongoing education to consumers about the long-term benefits of PIP rubber flooring also present hurdles.
Emerging Opportunities in Poured In Place Rubber Flooring
Emerging opportunities in the Poured In Place Rubber Flooring industry lie in the expansion of its application into new sectors, such as therapeutic environments and specialized sports facilities. The growing trend of urban revitalization projects and the development of accessible play spaces present significant untapped markets. Furthermore, advancements in eco-friendly binders and the integration of smart technologies for performance monitoring offer innovative avenues for product differentiation and market penetration. The increasing demand for aesthetically customizable surfacing solutions, allowing for intricate designs and branding, also presents a promising growth area.
Growth Accelerators in the Poured In Place Rubber Flooring Industry
The Poured In Place Rubber Flooring industry is experiencing accelerated growth due to several key catalysts. Technological breakthroughs in material science, leading to enhanced durability, UV resistance, and impact absorption, are driving product innovation and adoption. Strategic partnerships between manufacturers and playground equipment suppliers, as well as collaborations with architectural firms, are expanding market reach and integration possibilities. Furthermore, government incentives promoting the use of recycled materials and sustainable construction practices are providing a significant boost to the industry. The increasing global awareness of the importance of safe and accessible recreational spaces for public health and well-being is a consistent growth accelerator.
Key Players Shaping the Poured In Place Rubber Flooring Market
- Marathon Surfaces
- Rubber Designs
- Robertson
- AdventureTURF
- Trassig
- Duraflex
- O'Brien & Sons
- Fairmont Industries
- FlexGround
- Fibar Group
- Surface America
- No Fault
- SpectraTurf
Notable Milestones in Poured In Place Rubber Flooring Sector
- 2019: Increased adoption of recycled tire content in formulations, driven by environmental regulations and consumer demand.
- 2020: Development of new binder technologies offering improved flexibility and UV resistance.
- 2021: Introduction of enhanced critical fall height testing methodologies, leading to higher safety certifications.
- 2022: Expansion of playground surfacing into multi-sport courts and fitness zones within parks.
- 2023: Growing integration of antimicrobial additives for enhanced hygiene in public and educational spaces.
- 2024: Focus on sustainable manufacturing processes and the reduction of VOC emissions in PIP rubber flooring.
In-Depth Poured In Place Rubber Flooring Market Outlook
The Poured In Place Rubber Flooring market outlook is exceptionally positive, driven by sustained demand for safe, durable, and versatile surfacing solutions. Growth accelerators such as continuous technological advancements in material science, expanding applications beyond traditional playgrounds into commercial and industrial sectors, and strategic market expansions by key players will fuel significant market growth. The increasing emphasis on sustainable construction and the circular economy will further bolster the adoption of PIP rubber flooring utilizing recycled content. Strategic partnerships and product diversification will be crucial for capitalizing on emerging opportunities and solidifying market leadership in the coming forecast period.
Poured In Place Rubber Flooring Segmentation
-
1. Application
- 1.1. Playground
- 1.2. School
- 1.3. Park
- 1.4. Others
-
2. Type
- 2.1. Single Layer Flooring
- 2.2. Double Layer Flooring
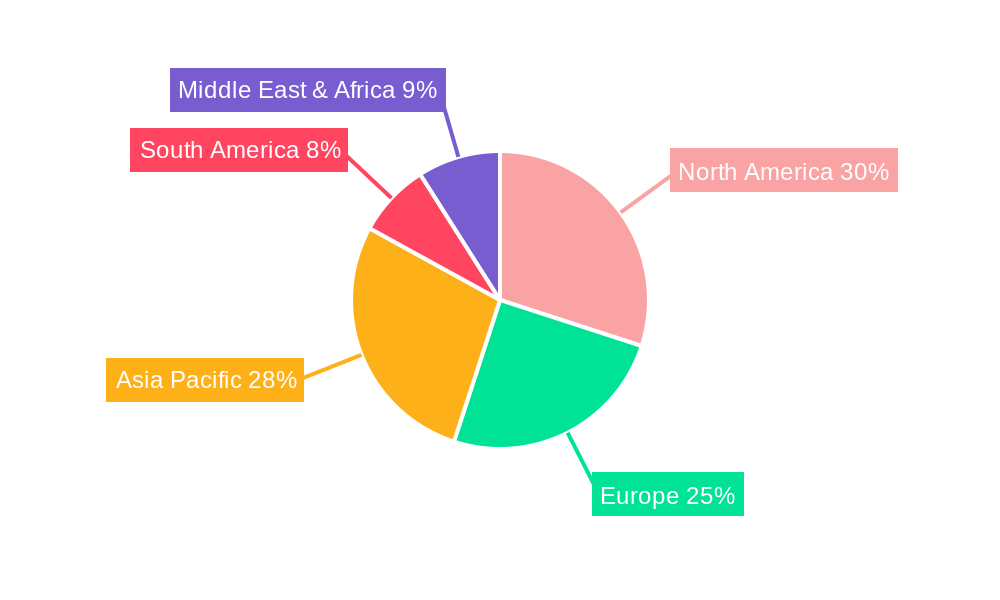
Poured In Place Rubber Flooring Segmentation By Geography
-
1. North America
- 1.1. United States
- 1.2. Canada
- 1.3. Mexico
-
2. South America
- 2.1. Brazil
- 2.2. Argentina
- 2.3. Rest of South America
-
3. Europe
- 3.1. United Kingdom
- 3.2. Germany
- 3.3. France
- 3.4. Italy
- 3.5. Spain
- 3.6. Russia
- 3.7. Benelux
- 3.8. Nordics
- 3.9. Rest of Europe
-
4. Middle East & Africa
- 4.1. Turkey
- 4.2. Israel
- 4.3. GCC
- 4.4. North Africa
- 4.5. South Africa
- 4.6. Rest of Middle East & Africa
-
5. Asia Pacific
- 5.1. China
- 5.2. India
- 5.3. Japan
- 5.4. South Korea
- 5.5. ASEAN
- 5.6. Oceania
- 5.7. Rest of Asia Pacific
Poured In Place Rubber Flooring REPORT HIGHLIGHTS
| Aspects | Details |
|---|---|
| Study Period | 2019-2033 |
| Base Year | 2024 |
| Estimated Year | 2025 |
| Forecast Period | 2025-2033 |
| Historical Period | 2019-2024 |
| Growth Rate | CAGR of XXX% from 2019-2033 |
| Segmentation |
|
Table of Contents
- 1. Introduction
- 1.1. Research Scope
- 1.2. Market Segmentation
- 1.3. Research Methodology
- 1.4. Definitions and Assumptions
- 2. Executive Summary
- 2.1. Introduction
- 3. Market Dynamics
- 3.1. Introduction
- 3.2. Market Drivers
- 3.3. Market Restrains
- 3.4. Market Trends
- 4. Market Factor Analysis
- 4.1. Porters Five Forces
- 4.2. Supply/Value Chain
- 4.3. PESTEL analysis
- 4.4. Market Entropy
- 4.5. Patent/Trademark Analysis
- 5. Global Poured In Place Rubber Flooring Analysis, Insights and Forecast, 2019-2031
- 5.1. Market Analysis, Insights and Forecast - by Application
- 5.1.1. Playground
- 5.1.2. School
- 5.1.3. Park
- 5.1.4. Others
- 5.2. Market Analysis, Insights and Forecast - by Type
- 5.2.1. Single Layer Flooring
- 5.2.2. Double Layer Flooring
- 5.3. Market Analysis, Insights and Forecast - by Region
- 5.3.1. North America
- 5.3.2. South America
- 5.3.3. Europe
- 5.3.4. Middle East & Africa
- 5.3.5. Asia Pacific
- 5.1. Market Analysis, Insights and Forecast - by Application
- 6. North America Poured In Place Rubber Flooring Analysis, Insights and Forecast, 2019-2031
- 6.1. Market Analysis, Insights and Forecast - by Application
- 6.1.1. Playground
- 6.1.2. School
- 6.1.3. Park
- 6.1.4. Others
- 6.2. Market Analysis, Insights and Forecast - by Type
- 6.2.1. Single Layer Flooring
- 6.2.2. Double Layer Flooring
- 6.1. Market Analysis, Insights and Forecast - by Application
- 7. South America Poured In Place Rubber Flooring Analysis, Insights and Forecast, 2019-2031
- 7.1. Market Analysis, Insights and Forecast - by Application
- 7.1.1. Playground
- 7.1.2. School
- 7.1.3. Park
- 7.1.4. Others
- 7.2. Market Analysis, Insights and Forecast - by Type
- 7.2.1. Single Layer Flooring
- 7.2.2. Double Layer Flooring
- 7.1. Market Analysis, Insights and Forecast - by Application
- 8. Europe Poured In Place Rubber Flooring Analysis, Insights and Forecast, 2019-2031
- 8.1. Market Analysis, Insights and Forecast - by Application
- 8.1.1. Playground
- 8.1.2. School
- 8.1.3. Park
- 8.1.4. Others
- 8.2. Market Analysis, Insights and Forecast - by Type
- 8.2.1. Single Layer Flooring
- 8.2.2. Double Layer Flooring
- 8.1. Market Analysis, Insights and Forecast - by Application
- 9. Middle East & Africa Poured In Place Rubber Flooring Analysis, Insights and Forecast, 2019-2031
- 9.1. Market Analysis, Insights and Forecast - by Application
- 9.1.1. Playground
- 9.1.2. School
- 9.1.3. Park
- 9.1.4. Others
- 9.2. Market Analysis, Insights and Forecast - by Type
- 9.2.1. Single Layer Flooring
- 9.2.2. Double Layer Flooring
- 9.1. Market Analysis, Insights and Forecast - by Application
- 10. Asia Pacific Poured In Place Rubber Flooring Analysis, Insights and Forecast, 2019-2031
- 10.1. Market Analysis, Insights and Forecast - by Application
- 10.1.1. Playground
- 10.1.2. School
- 10.1.3. Park
- 10.1.4. Others
- 10.2. Market Analysis, Insights and Forecast - by Type
- 10.2.1. Single Layer Flooring
- 10.2.2. Double Layer Flooring
- 10.1. Market Analysis, Insights and Forecast - by Application
- 11. Competitive Analysis
- 11.1. Global Market Share Analysis 2024
- 11.2. Company Profiles
- 11.2.1 Marathon Surfaces
- 11.2.1.1. Overview
- 11.2.1.2. Products
- 11.2.1.3. SWOT Analysis
- 11.2.1.4. Recent Developments
- 11.2.1.5. Financials (Based on Availability)
- 11.2.2 Rubber Designs
- 11.2.2.1. Overview
- 11.2.2.2. Products
- 11.2.2.3. SWOT Analysis
- 11.2.2.4. Recent Developments
- 11.2.2.5. Financials (Based on Availability)
- 11.2.3 Robertson
- 11.2.3.1. Overview
- 11.2.3.2. Products
- 11.2.3.3. SWOT Analysis
- 11.2.3.4. Recent Developments
- 11.2.3.5. Financials (Based on Availability)
- 11.2.4 AdventureTURF
- 11.2.4.1. Overview
- 11.2.4.2. Products
- 11.2.4.3. SWOT Analysis
- 11.2.4.4. Recent Developments
- 11.2.4.5. Financials (Based on Availability)
- 11.2.5 Trassig
- 11.2.5.1. Overview
- 11.2.5.2. Products
- 11.2.5.3. SWOT Analysis
- 11.2.5.4. Recent Developments
- 11.2.5.5. Financials (Based on Availability)
- 11.2.6 Duraflex
- 11.2.6.1. Overview
- 11.2.6.2. Products
- 11.2.6.3. SWOT Analysis
- 11.2.6.4. Recent Developments
- 11.2.6.5. Financials (Based on Availability)
- 11.2.7 O'Brien & Sons
- 11.2.7.1. Overview
- 11.2.7.2. Products
- 11.2.7.3. SWOT Analysis
- 11.2.7.4. Recent Developments
- 11.2.7.5. Financials (Based on Availability)
- 11.2.8 Fairmont Industries
- 11.2.8.1. Overview
- 11.2.8.2. Products
- 11.2.8.3. SWOT Analysis
- 11.2.8.4. Recent Developments
- 11.2.8.5. Financials (Based on Availability)
- 11.2.9 FlexGround
- 11.2.9.1. Overview
- 11.2.9.2. Products
- 11.2.9.3. SWOT Analysis
- 11.2.9.4. Recent Developments
- 11.2.9.5. Financials (Based on Availability)
- 11.2.10 Fibar Group
- 11.2.10.1. Overview
- 11.2.10.2. Products
- 11.2.10.3. SWOT Analysis
- 11.2.10.4. Recent Developments
- 11.2.10.5. Financials (Based on Availability)
- 11.2.11 Surface America
- 11.2.11.1. Overview
- 11.2.11.2. Products
- 11.2.11.3. SWOT Analysis
- 11.2.11.4. Recent Developments
- 11.2.11.5. Financials (Based on Availability)
- 11.2.12 No Fault
- 11.2.12.1. Overview
- 11.2.12.2. Products
- 11.2.12.3. SWOT Analysis
- 11.2.12.4. Recent Developments
- 11.2.12.5. Financials (Based on Availability)
- 11.2.13 SpectraTurf
- 11.2.13.1. Overview
- 11.2.13.2. Products
- 11.2.13.3. SWOT Analysis
- 11.2.13.4. Recent Developments
- 11.2.13.5. Financials (Based on Availability)
- 11.2.1 Marathon Surfaces
List of Figures
- Figure 1: Global Poured In Place Rubber Flooring Revenue Breakdown (million, %) by Region 2024 & 2032
- Figure 2: North America Poured In Place Rubber Flooring Revenue (million), by Application 2024 & 2032
- Figure 3: North America Poured In Place Rubber Flooring Revenue Share (%), by Application 2024 & 2032
- Figure 4: North America Poured In Place Rubber Flooring Revenue (million), by Type 2024 & 2032
- Figure 5: North America Poured In Place Rubber Flooring Revenue Share (%), by Type 2024 & 2032
- Figure 6: North America Poured In Place Rubber Flooring Revenue (million), by Country 2024 & 2032
- Figure 7: North America Poured In Place Rubber Flooring Revenue Share (%), by Country 2024 & 2032
- Figure 8: South America Poured In Place Rubber Flooring Revenue (million), by Application 2024 & 2032
- Figure 9: South America Poured In Place Rubber Flooring Revenue Share (%), by Application 2024 & 2032
- Figure 10: South America Poured In Place Rubber Flooring Revenue (million), by Type 2024 & 2032
- Figure 11: South America Poured In Place Rubber Flooring Revenue Share (%), by Type 2024 & 2032
- Figure 12: South America Poured In Place Rubber Flooring Revenue (million), by Country 2024 & 2032
- Figure 13: South America Poured In Place Rubber Flooring Revenue Share (%), by Country 2024 & 2032
- Figure 14: Europe Poured In Place Rubber Flooring Revenue (million), by Application 2024 & 2032
- Figure 15: Europe Poured In Place Rubber Flooring Revenue Share (%), by Application 2024 & 2032
- Figure 16: Europe Poured In Place Rubber Flooring Revenue (million), by Type 2024 & 2032
- Figure 17: Europe Poured In Place Rubber Flooring Revenue Share (%), by Type 2024 & 2032
- Figure 18: Europe Poured In Place Rubber Flooring Revenue (million), by Country 2024 & 2032
- Figure 19: Europe Poured In Place Rubber Flooring Revenue Share (%), by Country 2024 & 2032
- Figure 20: Middle East & Africa Poured In Place Rubber Flooring Revenue (million), by Application 2024 & 2032
- Figure 21: Middle East & Africa Poured In Place Rubber Flooring Revenue Share (%), by Application 2024 & 2032
- Figure 22: Middle East & Africa Poured In Place Rubber Flooring Revenue (million), by Type 2024 & 2032
- Figure 23: Middle East & Africa Poured In Place Rubber Flooring Revenue Share (%), by Type 2024 & 2032
- Figure 24: Middle East & Africa Poured In Place Rubber Flooring Revenue (million), by Country 2024 & 2032
- Figure 25: Middle East & Africa Poured In Place Rubber Flooring Revenue Share (%), by Country 2024 & 2032
- Figure 26: Asia Pacific Poured In Place Rubber Flooring Revenue (million), by Application 2024 & 2032
- Figure 27: Asia Pacific Poured In Place Rubber Flooring Revenue Share (%), by Application 2024 & 2032
- Figure 28: Asia Pacific Poured In Place Rubber Flooring Revenue (million), by Type 2024 & 2032
- Figure 29: Asia Pacific Poured In Place Rubber Flooring Revenue Share (%), by Type 2024 & 2032
- Figure 30: Asia Pacific Poured In Place Rubber Flooring Revenue (million), by Country 2024 & 2032
- Figure 31: Asia Pacific Poured In Place Rubber Flooring Revenue Share (%), by Country 2024 & 2032
List of Tables
- Table 1: Global Poured In Place Rubber Flooring Revenue million Forecast, by Region 2019 & 2032
- Table 2: Global Poured In Place Rubber Flooring Revenue million Forecast, by Application 2019 & 2032
- Table 3: Global Poured In Place Rubber Flooring Revenue million Forecast, by Type 2019 & 2032
- Table 4: Global Poured In Place Rubber Flooring Revenue million Forecast, by Region 2019 & 2032
- Table 5: Global Poured In Place Rubber Flooring Revenue million Forecast, by Application 2019 & 2032
- Table 6: Global Poured In Place Rubber Flooring Revenue million Forecast, by Type 2019 & 2032
- Table 7: Global Poured In Place Rubber Flooring Revenue million Forecast, by Country 2019 & 2032
- Table 8: United States Poured In Place Rubber Flooring Revenue (million) Forecast, by Application 2019 & 2032
- Table 9: Canada Poured In Place Rubber Flooring Revenue (million) Forecast, by Application 2019 & 2032
- Table 10: Mexico Poured In Place Rubber Flooring Revenue (million) Forecast, by Application 2019 & 2032
- Table 11: Global Poured In Place Rubber Flooring Revenue million Forecast, by Application 2019 & 2032
- Table 12: Global Poured In Place Rubber Flooring Revenue million Forecast, by Type 2019 & 2032
- Table 13: Global Poured In Place Rubber Flooring Revenue million Forecast, by Country 2019 & 2032
- Table 14: Brazil Poured In Place Rubber Flooring Revenue (million) Forecast, by Application 2019 & 2032
- Table 15: Argentina Poured In Place Rubber Flooring Revenue (million) Forecast, by Application 2019 & 2032
- Table 16: Rest of South America Poured In Place Rubber Flooring Revenue (million) Forecast, by Application 2019 & 2032
- Table 17: Global Poured In Place Rubber Flooring Revenue million Forecast, by Application 2019 & 2032
- Table 18: Global Poured In Place Rubber Flooring Revenue million Forecast, by Type 2019 & 2032
- Table 19: Global Poured In Place Rubber Flooring Revenue million Forecast, by Country 2019 & 2032
- Table 20: United Kingdom Poured In Place Rubber Flooring Revenue (million) Forecast, by Application 2019 & 2032
- Table 21: Germany Poured In Place Rubber Flooring Revenue (million) Forecast, by Application 2019 & 2032
- Table 22: France Poured In Place Rubber Flooring Revenue (million) Forecast, by Application 2019 & 2032
- Table 23: Italy Poured In Place Rubber Flooring Revenue (million) Forecast, by Application 2019 & 2032
- Table 24: Spain Poured In Place Rubber Flooring Revenue (million) Forecast, by Application 2019 & 2032
- Table 25: Russia Poured In Place Rubber Flooring Revenue (million) Forecast, by Application 2019 & 2032
- Table 26: Benelux Poured In Place Rubber Flooring Revenue (million) Forecast, by Application 2019 & 2032
- Table 27: Nordics Poured In Place Rubber Flooring Revenue (million) Forecast, by Application 2019 & 2032
- Table 28: Rest of Europe Poured In Place Rubber Flooring Revenue (million) Forecast, by Application 2019 & 2032
- Table 29: Global Poured In Place Rubber Flooring Revenue million Forecast, by Application 2019 & 2032
- Table 30: Global Poured In Place Rubber Flooring Revenue million Forecast, by Type 2019 & 2032
- Table 31: Global Poured In Place Rubber Flooring Revenue million Forecast, by Country 2019 & 2032
- Table 32: Turkey Poured In Place Rubber Flooring Revenue (million) Forecast, by Application 2019 & 2032
- Table 33: Israel Poured In Place Rubber Flooring Revenue (million) Forecast, by Application 2019 & 2032
- Table 34: GCC Poured In Place Rubber Flooring Revenue (million) Forecast, by Application 2019 & 2032
- Table 35: North Africa Poured In Place Rubber Flooring Revenue (million) Forecast, by Application 2019 & 2032
- Table 36: South Africa Poured In Place Rubber Flooring Revenue (million) Forecast, by Application 2019 & 2032
- Table 37: Rest of Middle East & Africa Poured In Place Rubber Flooring Revenue (million) Forecast, by Application 2019 & 2032
- Table 38: Global Poured In Place Rubber Flooring Revenue million Forecast, by Application 2019 & 2032
- Table 39: Global Poured In Place Rubber Flooring Revenue million Forecast, by Type 2019 & 2032
- Table 40: Global Poured In Place Rubber Flooring Revenue million Forecast, by Country 2019 & 2032
- Table 41: China Poured In Place Rubber Flooring Revenue (million) Forecast, by Application 2019 & 2032
- Table 42: India Poured In Place Rubber Flooring Revenue (million) Forecast, by Application 2019 & 2032
- Table 43: Japan Poured In Place Rubber Flooring Revenue (million) Forecast, by Application 2019 & 2032
- Table 44: South Korea Poured In Place Rubber Flooring Revenue (million) Forecast, by Application 2019 & 2032
- Table 45: ASEAN Poured In Place Rubber Flooring Revenue (million) Forecast, by Application 2019 & 2032
- Table 46: Oceania Poured In Place Rubber Flooring Revenue (million) Forecast, by Application 2019 & 2032
- Table 47: Rest of Asia Pacific Poured In Place Rubber Flooring Revenue (million) Forecast, by Application 2019 & 2032
Frequently Asked Questions
1. What is the projected Compound Annual Growth Rate (CAGR) of the Poured In Place Rubber Flooring?
The projected CAGR is approximately XXX%.
2. Which companies are prominent players in the Poured In Place Rubber Flooring?
Key companies in the market include Marathon Surfaces, Rubber Designs, Robertson, AdventureTURF, Trassig, Duraflex, O'Brien & Sons, Fairmont Industries, FlexGround, Fibar Group, Surface America, No Fault, SpectraTurf.
3. What are the main segments of the Poured In Place Rubber Flooring?
The market segments include Application, Type.
4. Can you provide details about the market size?
The market size is estimated to be USD XXX million as of 2022.
5. What are some drivers contributing to market growth?
N/A
6. What are the notable trends driving market growth?
N/A
7. Are there any restraints impacting market growth?
N/A
8. Can you provide examples of recent developments in the market?
N/A
9. What pricing options are available for accessing the report?
Pricing options include single-user, multi-user, and enterprise licenses priced at USD 2900.00, USD 4350.00, and USD 5800.00 respectively.
10. Is the market size provided in terms of value or volume?
The market size is provided in terms of value, measured in million.
11. Are there any specific market keywords associated with the report?
Yes, the market keyword associated with the report is "Poured In Place Rubber Flooring," which aids in identifying and referencing the specific market segment covered.
12. How do I determine which pricing option suits my needs best?
The pricing options vary based on user requirements and access needs. Individual users may opt for single-user licenses, while businesses requiring broader access may choose multi-user or enterprise licenses for cost-effective access to the report.
13. Are there any additional resources or data provided in the Poured In Place Rubber Flooring report?
While the report offers comprehensive insights, it's advisable to review the specific contents or supplementary materials provided to ascertain if additional resources or data are available.
14. How can I stay updated on further developments or reports in the Poured In Place Rubber Flooring?
To stay informed about further developments, trends, and reports in the Poured In Place Rubber Flooring, consider subscribing to industry newsletters, following relevant companies and organizations, or regularly checking reputable industry news sources and publications.
Methodology
Step 1 - Identification of Relevant Samples Size from Population Database


Step 2 - Approaches for Defining Global Market Size (Value, Volume* & Price*)

Note*: In applicable scenarios
Step 3 - Data Sources
Primary Research
- Web Analytics
- Survey Reports
- Research Institute
- Latest Research Reports
- Opinion Leaders
Secondary Research
- Annual Reports
- White Paper
- Latest Press Release
- Industry Association
- Paid Database
- Investor Presentations

Step 4 - Data Triangulation
Involves using different sources of information in order to increase the validity of a study
These sources are likely to be stakeholders in a program - participants, other researchers, program staff, other community members, and so on.
Then we put all data in single framework & apply various statistical tools to find out the dynamic on the market.
During the analysis stage, feedback from the stakeholder groups would be compared to determine areas of agreement as well as areas of divergence


