
Key Insights
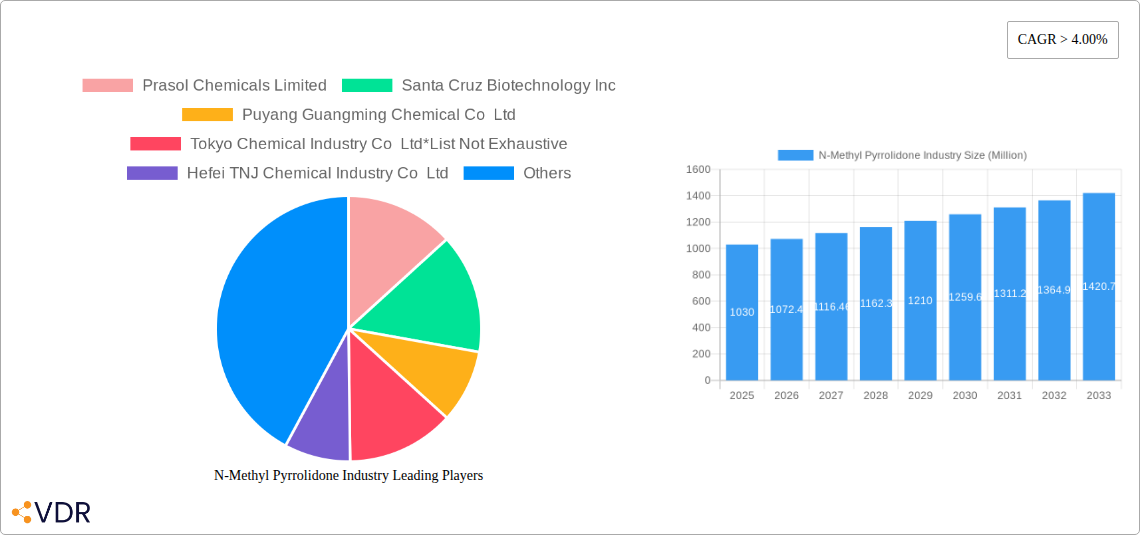
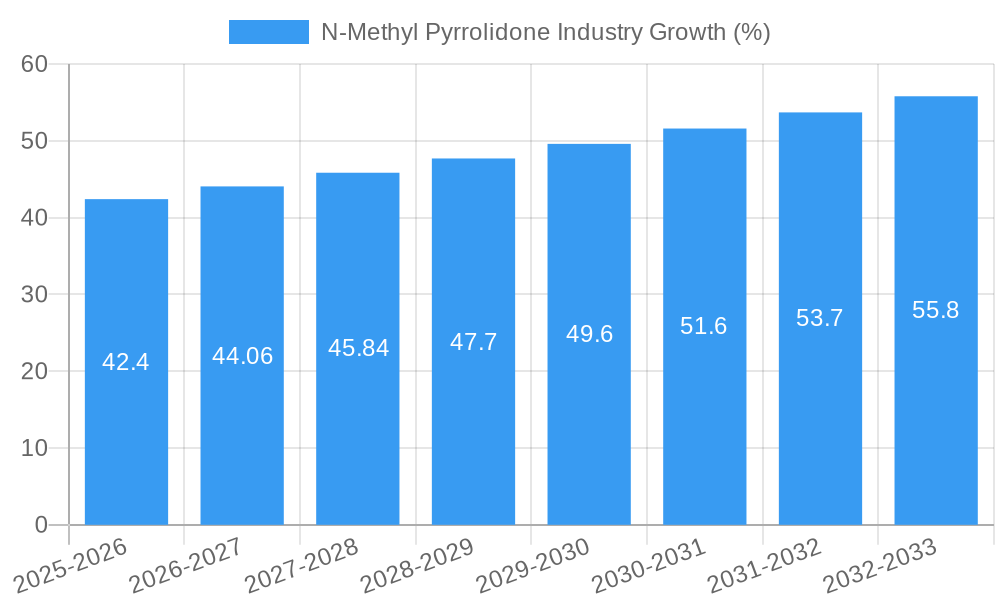
The N-Methyl Pyrrolidone (NMP) industry, currently valued at $1.03 billion in 2025, is projected to experience robust growth, exceeding a 4% CAGR from 2025 to 2033. This expansion is driven by increasing demand across diverse sectors. The oil and gas industry utilizes NMP as a crucial solvent in various processes, while the pharmaceuticals sector leverages its properties in drug manufacturing. The paints and coatings industry relies on NMP for enhancing film formation and adhesion, and the electronics industry utilizes it in cleaning and other applications. Furthermore, the agrochemical sector uses NMP as a solvent in pesticide formulations. While precise figures for each segment are unavailable, considering the overall market size and application diversity, it’s reasonable to assume significant contributions from each. Oil and gas and pharmaceuticals likely hold the largest shares, followed by paints and coatings and electronics. Growth will be influenced by factors such as stringent environmental regulations necessitating the use of more sustainable solvents and increasing demand for high-performance materials across several sectors.
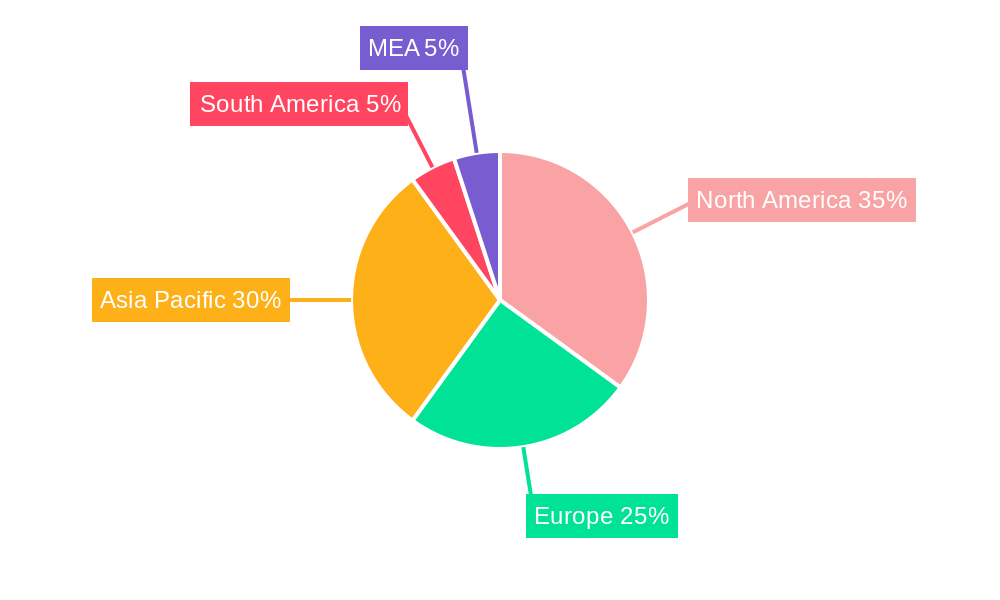
Despite the promising outlook, the industry faces certain restraints. Fluctuations in raw material prices, particularly those of pyrrolidone, can impact profitability. Additionally, potential environmental concerns surrounding NMP's use, along with the development of alternative solvents, could moderate growth. However, the industry’s response to these concerns, coupled with the ongoing development of more efficient and sustainable NMP production methods, may mitigate these challenges. Geographically, North America and Asia Pacific are expected to dominate the market, given their strong industrial bases and substantial consumption across key application sectors. The presence of major NMP manufacturers, such as BASF SE, Mitsubishi Chemical Corporation, and Ashland, in these regions further bolsters their market leadership. Future growth will likely witness a continued shift towards sustainable practices and a greater focus on regional market diversification.
N-Methyl Pyrrolidone (NMP) Industry Market Report: 2019-2033
This comprehensive report provides a detailed analysis of the N-Methyl Pyrrolidone (NMP) industry, encompassing market dynamics, growth trends, regional segmentation, product landscape, key players, and future outlook. The report covers the period from 2019 to 2033, with 2025 as the base year and a forecast period from 2025 to 2033. This in-depth study is essential for industry professionals, investors, and strategic decision-makers seeking a complete understanding of this vital chemical market.
Parent Market: Specialty Chemicals Child Market: Industrial Solvents
The NMP market, a crucial segment within the specialty chemicals industry, is poised for substantial growth driven by increasing demand across diverse applications. This report provides a granular analysis of this dynamic landscape.
N-Methyl Pyrrolidone Industry Market Dynamics & Structure
The N-Methyl Pyrrolidone (NMP) market exhibits a moderately consolidated structure with several large players and a number of smaller regional producers. Technological innovation is a key driver, with ongoing efforts focused on improving production efficiency and developing new applications. Stringent environmental regulations significantly impact the industry, necessitating sustainable production practices. Competitive substitutes, such as other polar aprotic solvents, represent a challenge. The end-user demographics are diverse, spanning various industries, leading to varied demand patterns. M&A activity has been moderate, with companies focusing on strategic acquisitions to expand their product portfolios and geographic reach.
- Market Concentration: Moderately Consolidated (xx% top 5 players in 2024)
- Technological Innovation: Focus on improved efficiency and eco-friendly processes.
- Regulatory Framework: Stringent environmental regulations impacting production.
- Competitive Substitutes: Other polar aprotic solvents pose a challenge.
- End-User Demographics: Diverse, across Oil & Gas, Pharmaceuticals, Paints & Coatings etc.
- M&A Trends: Moderate activity, driven by portfolio expansion and geographical reach. (xx number of deals in 2019-2024)
N-Methyl Pyrrolidone Industry Growth Trends & Insights
The NMP market experienced a CAGR of xx% during the historical period (2019-2024), driven primarily by strong demand from the oil and gas, and paints and coatings sectors. Technological advancements in production methods and the emergence of new applications in electronics and pharmaceuticals are contributing to market expansion. Consumer behavior shifts toward sustainable products are influencing the demand for eco-friendly NMP production processes. The market is projected to maintain a robust growth trajectory, reaching a market size of xx Million units by 2033, with a projected CAGR of xx% during the forecast period (2025-2033). Market penetration in emerging economies is also expected to rise significantly. The adoption rate of NMP in novel applications, such as lithium-ion batteries, will be a crucial determinant of future growth.
Dominant Regions, Countries, or Segments in N-Methyl Pyrrolidone Industry
Asia Pacific dominates the global NMP market, driven by robust industrial growth and significant demand from various sectors including paints & coatings, electronics and pharmaceuticals. China, in particular, holds a substantial market share due to its extensive manufacturing base and rapid industrialization. North America and Europe also represent key regional markets, benefiting from established chemical industries and stringent environmental regulations. The Oil and Gas segment accounts for a significant share, fueled by its use in drilling fluids. The paints and coatings sector represents another major application, benefitting from NMP's ability to enhance solvent properties.
- Key Drivers for Asia-Pacific Dominance: Rapid industrialization, strong manufacturing base, increasing demand from diverse end-use industries.
- North America and Europe: Established chemical industries, strong regulatory frameworks driving sustainable production methods.
- Segment-wise Dominance: Oil & Gas and Paints & Coatings leading the application-based segmentation.
N-Methyl Pyrrolidone Industry Product Landscape
The NMP product landscape is characterized by high-purity grades for demanding applications such as pharmaceuticals and electronics, alongside industrial-grade products for use in paints and coatings. Recent innovations focus on improving NMP's sustainability profile through enhanced biodegradability and reduced environmental impact. Technological advancements include improved production processes that minimize waste and energy consumption, leading to cost savings and enhanced environmental performance. Key selling propositions include high solvent power, low toxicity (compared to other solvents), and versatility across multiple applications.
Key Drivers, Barriers & Challenges in N-Methyl Pyrrolidone Industry
Key Drivers:
- Increasing demand from various sectors, especially oil & gas and paints & coatings.
- Technological advancements leading to improved efficiency and reduced environmental impact.
- Expanding applications in specialized areas like lithium-ion batteries and pharmaceuticals.
Key Challenges:
- Stringent environmental regulations influencing production costs and methods. (e.g., xx% increase in compliance costs projected by 2030)
- Fluctuations in raw material prices impacting profitability.
- Competition from alternative solvents limits market share.
Emerging Opportunities in N-Methyl Pyrrolidone Industry
- Expansion into untapped markets in developing economies.
- Development of new applications in advanced materials and renewable energy.
- Growing demand for sustainable and bio-based NMP alternatives.
Growth Accelerators in the N-Methyl Pyrrolidone Industry Industry
Strategic partnerships between manufacturers and end-users are driving market expansion by facilitating the development of tailored NMP solutions. Technological breakthroughs in sustainable production processes are reducing the environmental impact, thereby increasing market appeal. Moreover, strategic expansion into high-growth regions and diversification into new applications will further propel long-term growth.
Key Players Shaping the N-Methyl Pyrrolidone Industry Market
- Prasol Chemicals Limited
- Santa Cruz Biotechnology Inc
- Puyang Guangming Chemical Co Ltd
- Tokyo Chemical Industry Co Ltd
- Hefei TNJ Chemical Industry Co Ltd
- BALAJI AMINES
- Mitsubishi Chemical Corporation
- BYN Chemical Co Ltd
- Ashland
- Binzhou City Zhanhua District Ruian Chemical Co Ltd
- BASF SE
- Ganzhou Zhongneng Industrial Co Ltd
- Eastman Chemical Company
- Shandong Qingyun Changxin Chemical Science-Tech Co Ltd
- LyondellBasell Industries Holdings BV
Notable Milestones in N-Methyl Pyrrolidone Industry Sector
- March 2024: Ganzhou Zhongneng Industrial Co. Ltd. announced a significant expansion project, including a 150,000-ton NMP production line.
- August 2022: BASF SE announced increased production of specialty pyrrolidones in North America to meet growing demand.
In-Depth N-Methyl Pyrrolidone Industry Market Outlook
The NMP market is poised for continued growth, driven by technological advancements, expanding applications, and strategic partnerships. The focus on sustainability will shape future market dynamics, with an increased emphasis on eco-friendly production methods and biodegradable alternatives. Companies that effectively navigate environmental regulations and capitalize on emerging opportunities in high-growth sectors will be best positioned for success in this dynamic market.
N-Methyl Pyrrolidone Industry Segmentation
-
1. Application
- 1.1. Oil and Gas
- 1.2. Pharmaceuticals
- 1.3. Paints and Coatings
- 1.4. Electronics
- 1.5. Agrochemicals
- 1.6. Other Applications
N-Methyl Pyrrolidone Industry Segmentation By Geography
-
1. Asia Pacific
- 1.1. China
- 1.2. India
- 1.3. Japan
- 1.4. South Korea
- 1.5. Malaysia
- 1.6. Thailand
- 1.7. Indonesia
- 1.8. Vietnam
- 1.9. Rest of Asia Pacific
-
2. North America
- 2.1. United States
- 2.2. Canada
- 2.3. Mexico
-
3. Europe
- 3.1. Germany
- 3.2. United Kingdom
- 3.3. Italy
- 3.4. France
- 3.5. Spain
- 3.6. Nordic Countries
- 3.7. Russia
- 3.8. Rest of Europe
-
4. South America
- 4.1. Brazil
- 4.2. Argentina
- 4.3. Colombia
- 4.4. Rest of South America
-
5. Middle East and Africa
- 5.1. Saudi Arabia
- 5.2. Qatar
- 5.3. United Arab Emirates
- 5.4. Nigeria
- 5.5. South Africa
- 5.6. Rest of MEA
N-Methyl Pyrrolidone Industry REPORT HIGHLIGHTS
| Aspects | Details |
|---|---|
| Study Period | 2019-2033 |
| Base Year | 2024 |
| Estimated Year | 2025 |
| Forecast Period | 2025-2033 |
| Historical Period | 2019-2024 |
| Growth Rate | CAGR of > 4.00% from 2019-2033 |
| Segmentation |
|
Table of Contents
- 1. Introduction
- 1.1. Research Scope
- 1.2. Market Segmentation
- 1.3. Research Methodology
- 1.4. Definitions and Assumptions
- 2. Executive Summary
- 2.1. Introduction
- 3. Market Dynamics
- 3.1. Introduction
- 3.2. Market Drivers
- 3.2.1. Growing Demand From the Electronics Industry; Increasing Usage in the Pharmaceutical Industry
- 3.3. Market Restrains
- 3.3.1. N-methyl Pyrrolidone Hazards and Its Greener Alternatives
- 3.4. Market Trends
- 3.4.1. Increasing Demand from Electronics Segment
- 4. Market Factor Analysis
- 4.1. Porters Five Forces
- 4.2. Supply/Value Chain
- 4.3. PESTEL analysis
- 4.4. Market Entropy
- 4.5. Patent/Trademark Analysis
- 5. Global N-Methyl Pyrrolidone Industry Analysis, Insights and Forecast, 2019-2031
- 5.1. Market Analysis, Insights and Forecast - by Application
- 5.1.1. Oil and Gas
- 5.1.2. Pharmaceuticals
- 5.1.3. Paints and Coatings
- 5.1.4. Electronics
- 5.1.5. Agrochemicals
- 5.1.6. Other Applications
- 5.2. Market Analysis, Insights and Forecast - by Region
- 5.2.1. Asia Pacific
- 5.2.2. North America
- 5.2.3. Europe
- 5.2.4. South America
- 5.2.5. Middle East and Africa
- 5.1. Market Analysis, Insights and Forecast - by Application
- 6. Asia Pacific N-Methyl Pyrrolidone Industry Analysis, Insights and Forecast, 2019-2031
- 6.1. Market Analysis, Insights and Forecast - by Application
- 6.1.1. Oil and Gas
- 6.1.2. Pharmaceuticals
- 6.1.3. Paints and Coatings
- 6.1.4. Electronics
- 6.1.5. Agrochemicals
- 6.1.6. Other Applications
- 6.1. Market Analysis, Insights and Forecast - by Application
- 7. North America N-Methyl Pyrrolidone Industry Analysis, Insights and Forecast, 2019-2031
- 7.1. Market Analysis, Insights and Forecast - by Application
- 7.1.1. Oil and Gas
- 7.1.2. Pharmaceuticals
- 7.1.3. Paints and Coatings
- 7.1.4. Electronics
- 7.1.5. Agrochemicals
- 7.1.6. Other Applications
- 7.1. Market Analysis, Insights and Forecast - by Application
- 8. Europe N-Methyl Pyrrolidone Industry Analysis, Insights and Forecast, 2019-2031
- 8.1. Market Analysis, Insights and Forecast - by Application
- 8.1.1. Oil and Gas
- 8.1.2. Pharmaceuticals
- 8.1.3. Paints and Coatings
- 8.1.4. Electronics
- 8.1.5. Agrochemicals
- 8.1.6. Other Applications
- 8.1. Market Analysis, Insights and Forecast - by Application
- 9. South America N-Methyl Pyrrolidone Industry Analysis, Insights and Forecast, 2019-2031
- 9.1. Market Analysis, Insights and Forecast - by Application
- 9.1.1. Oil and Gas
- 9.1.2. Pharmaceuticals
- 9.1.3. Paints and Coatings
- 9.1.4. Electronics
- 9.1.5. Agrochemicals
- 9.1.6. Other Applications
- 9.1. Market Analysis, Insights and Forecast - by Application
- 10. Middle East and Africa N-Methyl Pyrrolidone Industry Analysis, Insights and Forecast, 2019-2031
- 10.1. Market Analysis, Insights and Forecast - by Application
- 10.1.1. Oil and Gas
- 10.1.2. Pharmaceuticals
- 10.1.3. Paints and Coatings
- 10.1.4. Electronics
- 10.1.5. Agrochemicals
- 10.1.6. Other Applications
- 10.1. Market Analysis, Insights and Forecast - by Application
- 11. North America N-Methyl Pyrrolidone Industry Analysis, Insights and Forecast, 2019-2031
- 11.1. Market Analysis, Insights and Forecast - By Country/Sub-region
- 11.1.1 United States
- 11.1.2 Canada
- 11.1.3 Mexico
- 12. Europe N-Methyl Pyrrolidone Industry Analysis, Insights and Forecast, 2019-2031
- 12.1. Market Analysis, Insights and Forecast - By Country/Sub-region
- 12.1.1 Germany
- 12.1.2 United Kingdom
- 12.1.3 France
- 12.1.4 Spain
- 12.1.5 Italy
- 12.1.6 Spain
- 12.1.7 Belgium
- 12.1.8 Netherland
- 12.1.9 Nordics
- 12.1.10 Rest of Europe
- 13. Asia Pacific N-Methyl Pyrrolidone Industry Analysis, Insights and Forecast, 2019-2031
- 13.1. Market Analysis, Insights and Forecast - By Country/Sub-region
- 13.1.1 China
- 13.1.2 Japan
- 13.1.3 India
- 13.1.4 South Korea
- 13.1.5 Southeast Asia
- 13.1.6 Australia
- 13.1.7 Indonesia
- 13.1.8 Phillipes
- 13.1.9 Singapore
- 13.1.10 Thailandc
- 13.1.11 Rest of Asia Pacific
- 14. South America N-Methyl Pyrrolidone Industry Analysis, Insights and Forecast, 2019-2031
- 14.1. Market Analysis, Insights and Forecast - By Country/Sub-region
- 14.1.1 Brazil
- 14.1.2 Argentina
- 14.1.3 Peru
- 14.1.4 Chile
- 14.1.5 Colombia
- 14.1.6 Ecuador
- 14.1.7 Venezuela
- 14.1.8 Rest of South America
- 15. North America N-Methyl Pyrrolidone Industry Analysis, Insights and Forecast, 2019-2031
- 15.1. Market Analysis, Insights and Forecast - By Country/Sub-region
- 15.1.1 United States
- 15.1.2 Canada
- 15.1.3 Mexico
- 16. MEA N-Methyl Pyrrolidone Industry Analysis, Insights and Forecast, 2019-2031
- 16.1. Market Analysis, Insights and Forecast - By Country/Sub-region
- 16.1.1 United Arab Emirates
- 16.1.2 Saudi Arabia
- 16.1.3 South Africa
- 16.1.4 Rest of Middle East and Africa
- 17. Competitive Analysis
- 17.1. Global Market Share Analysis 2024
- 17.2. Company Profiles
- 17.2.1 Prasol Chemicals Limited
- 17.2.1.1. Overview
- 17.2.1.2. Products
- 17.2.1.3. SWOT Analysis
- 17.2.1.4. Recent Developments
- 17.2.1.5. Financials (Based on Availability)
- 17.2.2 Santa Cruz Biotechnology Inc
- 17.2.2.1. Overview
- 17.2.2.2. Products
- 17.2.2.3. SWOT Analysis
- 17.2.2.4. Recent Developments
- 17.2.2.5. Financials (Based on Availability)
- 17.2.3 Puyang Guangming Chemical Co Ltd
- 17.2.3.1. Overview
- 17.2.3.2. Products
- 17.2.3.3. SWOT Analysis
- 17.2.3.4. Recent Developments
- 17.2.3.5. Financials (Based on Availability)
- 17.2.4 Tokyo Chemical Industry Co Ltd*List Not Exhaustive
- 17.2.4.1. Overview
- 17.2.4.2. Products
- 17.2.4.3. SWOT Analysis
- 17.2.4.4. Recent Developments
- 17.2.4.5. Financials (Based on Availability)
- 17.2.5 Hefei TNJ Chemical Industry Co Ltd
- 17.2.5.1. Overview
- 17.2.5.2. Products
- 17.2.5.3. SWOT Analysis
- 17.2.5.4. Recent Developments
- 17.2.5.5. Financials (Based on Availability)
- 17.2.6 BALAJI AMINES
- 17.2.6.1. Overview
- 17.2.6.2. Products
- 17.2.6.3. SWOT Analysis
- 17.2.6.4. Recent Developments
- 17.2.6.5. Financials (Based on Availability)
- 17.2.7 Mitsubishi Chemical Corporation
- 17.2.7.1. Overview
- 17.2.7.2. Products
- 17.2.7.3. SWOT Analysis
- 17.2.7.4. Recent Developments
- 17.2.7.5. Financials (Based on Availability)
- 17.2.8 BYN Chemical Co Ltd
- 17.2.8.1. Overview
- 17.2.8.2. Products
- 17.2.8.3. SWOT Analysis
- 17.2.8.4. Recent Developments
- 17.2.8.5. Financials (Based on Availability)
- 17.2.9 Ashland
- 17.2.9.1. Overview
- 17.2.9.2. Products
- 17.2.9.3. SWOT Analysis
- 17.2.9.4. Recent Developments
- 17.2.9.5. Financials (Based on Availability)
- 17.2.10 Binzhou City Zhanhua District Ruian Chemical Co Ltd
- 17.2.10.1. Overview
- 17.2.10.2. Products
- 17.2.10.3. SWOT Analysis
- 17.2.10.4. Recent Developments
- 17.2.10.5. Financials (Based on Availability)
- 17.2.11 BASF SE
- 17.2.11.1. Overview
- 17.2.11.2. Products
- 17.2.11.3. SWOT Analysis
- 17.2.11.4. Recent Developments
- 17.2.11.5. Financials (Based on Availability)
- 17.2.12 Ganzhou Zhongneng Industrial Co Ltd
- 17.2.12.1. Overview
- 17.2.12.2. Products
- 17.2.12.3. SWOT Analysis
- 17.2.12.4. Recent Developments
- 17.2.12.5. Financials (Based on Availability)
- 17.2.13 Eastman Chemical Company
- 17.2.13.1. Overview
- 17.2.13.2. Products
- 17.2.13.3. SWOT Analysis
- 17.2.13.4. Recent Developments
- 17.2.13.5. Financials (Based on Availability)
- 17.2.14 Shandong Qingyun Changxin Chemical Science-Tech Co Ltd
- 17.2.14.1. Overview
- 17.2.14.2. Products
- 17.2.14.3. SWOT Analysis
- 17.2.14.4. Recent Developments
- 17.2.14.5. Financials (Based on Availability)
- 17.2.15 LyondellBasell Industries Holdings BV
- 17.2.15.1. Overview
- 17.2.15.2. Products
- 17.2.15.3. SWOT Analysis
- 17.2.15.4. Recent Developments
- 17.2.15.5. Financials (Based on Availability)
- 17.2.1 Prasol Chemicals Limited
List of Figures
- Figure 1: Global N-Methyl Pyrrolidone Industry Revenue Breakdown (Million, %) by Region 2024 & 2032
- Figure 2: Global N-Methyl Pyrrolidone Industry Volume Breakdown (K Tons, %) by Region 2024 & 2032
- Figure 3: North America N-Methyl Pyrrolidone Industry Revenue (Million), by Country 2024 & 2032
- Figure 4: North America N-Methyl Pyrrolidone Industry Volume (K Tons), by Country 2024 & 2032
- Figure 5: North America N-Methyl Pyrrolidone Industry Revenue Share (%), by Country 2024 & 2032
- Figure 6: North America N-Methyl Pyrrolidone Industry Volume Share (%), by Country 2024 & 2032
- Figure 7: Europe N-Methyl Pyrrolidone Industry Revenue (Million), by Country 2024 & 2032
- Figure 8: Europe N-Methyl Pyrrolidone Industry Volume (K Tons), by Country 2024 & 2032
- Figure 9: Europe N-Methyl Pyrrolidone Industry Revenue Share (%), by Country 2024 & 2032
- Figure 10: Europe N-Methyl Pyrrolidone Industry Volume Share (%), by Country 2024 & 2032
- Figure 11: Asia Pacific N-Methyl Pyrrolidone Industry Revenue (Million), by Country 2024 & 2032
- Figure 12: Asia Pacific N-Methyl Pyrrolidone Industry Volume (K Tons), by Country 2024 & 2032
- Figure 13: Asia Pacific N-Methyl Pyrrolidone Industry Revenue Share (%), by Country 2024 & 2032
- Figure 14: Asia Pacific N-Methyl Pyrrolidone Industry Volume Share (%), by Country 2024 & 2032
- Figure 15: South America N-Methyl Pyrrolidone Industry Revenue (Million), by Country 2024 & 2032
- Figure 16: South America N-Methyl Pyrrolidone Industry Volume (K Tons), by Country 2024 & 2032
- Figure 17: South America N-Methyl Pyrrolidone Industry Revenue Share (%), by Country 2024 & 2032
- Figure 18: South America N-Methyl Pyrrolidone Industry Volume Share (%), by Country 2024 & 2032
- Figure 19: North America N-Methyl Pyrrolidone Industry Revenue (Million), by Country 2024 & 2032
- Figure 20: North America N-Methyl Pyrrolidone Industry Volume (K Tons), by Country 2024 & 2032
- Figure 21: North America N-Methyl Pyrrolidone Industry Revenue Share (%), by Country 2024 & 2032
- Figure 22: North America N-Methyl Pyrrolidone Industry Volume Share (%), by Country 2024 & 2032
- Figure 23: MEA N-Methyl Pyrrolidone Industry Revenue (Million), by Country 2024 & 2032
- Figure 24: MEA N-Methyl Pyrrolidone Industry Volume (K Tons), by Country 2024 & 2032
- Figure 25: MEA N-Methyl Pyrrolidone Industry Revenue Share (%), by Country 2024 & 2032
- Figure 26: MEA N-Methyl Pyrrolidone Industry Volume Share (%), by Country 2024 & 2032
- Figure 27: Asia Pacific N-Methyl Pyrrolidone Industry Revenue (Million), by Application 2024 & 2032
- Figure 28: Asia Pacific N-Methyl Pyrrolidone Industry Volume (K Tons), by Application 2024 & 2032
- Figure 29: Asia Pacific N-Methyl Pyrrolidone Industry Revenue Share (%), by Application 2024 & 2032
- Figure 30: Asia Pacific N-Methyl Pyrrolidone Industry Volume Share (%), by Application 2024 & 2032
- Figure 31: Asia Pacific N-Methyl Pyrrolidone Industry Revenue (Million), by Country 2024 & 2032
- Figure 32: Asia Pacific N-Methyl Pyrrolidone Industry Volume (K Tons), by Country 2024 & 2032
- Figure 33: Asia Pacific N-Methyl Pyrrolidone Industry Revenue Share (%), by Country 2024 & 2032
- Figure 34: Asia Pacific N-Methyl Pyrrolidone Industry Volume Share (%), by Country 2024 & 2032
- Figure 35: North America N-Methyl Pyrrolidone Industry Revenue (Million), by Application 2024 & 2032
- Figure 36: North America N-Methyl Pyrrolidone Industry Volume (K Tons), by Application 2024 & 2032
- Figure 37: North America N-Methyl Pyrrolidone Industry Revenue Share (%), by Application 2024 & 2032
- Figure 38: North America N-Methyl Pyrrolidone Industry Volume Share (%), by Application 2024 & 2032
- Figure 39: North America N-Methyl Pyrrolidone Industry Revenue (Million), by Country 2024 & 2032
- Figure 40: North America N-Methyl Pyrrolidone Industry Volume (K Tons), by Country 2024 & 2032
- Figure 41: North America N-Methyl Pyrrolidone Industry Revenue Share (%), by Country 2024 & 2032
- Figure 42: North America N-Methyl Pyrrolidone Industry Volume Share (%), by Country 2024 & 2032
- Figure 43: Europe N-Methyl Pyrrolidone Industry Revenue (Million), by Application 2024 & 2032
- Figure 44: Europe N-Methyl Pyrrolidone Industry Volume (K Tons), by Application 2024 & 2032
- Figure 45: Europe N-Methyl Pyrrolidone Industry Revenue Share (%), by Application 2024 & 2032
- Figure 46: Europe N-Methyl Pyrrolidone Industry Volume Share (%), by Application 2024 & 2032
- Figure 47: Europe N-Methyl Pyrrolidone Industry Revenue (Million), by Country 2024 & 2032
- Figure 48: Europe N-Methyl Pyrrolidone Industry Volume (K Tons), by Country 2024 & 2032
- Figure 49: Europe N-Methyl Pyrrolidone Industry Revenue Share (%), by Country 2024 & 2032
- Figure 50: Europe N-Methyl Pyrrolidone Industry Volume Share (%), by Country 2024 & 2032
- Figure 51: South America N-Methyl Pyrrolidone Industry Revenue (Million), by Application 2024 & 2032
- Figure 52: South America N-Methyl Pyrrolidone Industry Volume (K Tons), by Application 2024 & 2032
- Figure 53: South America N-Methyl Pyrrolidone Industry Revenue Share (%), by Application 2024 & 2032
- Figure 54: South America N-Methyl Pyrrolidone Industry Volume Share (%), by Application 2024 & 2032
- Figure 55: South America N-Methyl Pyrrolidone Industry Revenue (Million), by Country 2024 & 2032
- Figure 56: South America N-Methyl Pyrrolidone Industry Volume (K Tons), by Country 2024 & 2032
- Figure 57: South America N-Methyl Pyrrolidone Industry Revenue Share (%), by Country 2024 & 2032
- Figure 58: South America N-Methyl Pyrrolidone Industry Volume Share (%), by Country 2024 & 2032
- Figure 59: Middle East and Africa N-Methyl Pyrrolidone Industry Revenue (Million), by Application 2024 & 2032
- Figure 60: Middle East and Africa N-Methyl Pyrrolidone Industry Volume (K Tons), by Application 2024 & 2032
- Figure 61: Middle East and Africa N-Methyl Pyrrolidone Industry Revenue Share (%), by Application 2024 & 2032
- Figure 62: Middle East and Africa N-Methyl Pyrrolidone Industry Volume Share (%), by Application 2024 & 2032
- Figure 63: Middle East and Africa N-Methyl Pyrrolidone Industry Revenue (Million), by Country 2024 & 2032
- Figure 64: Middle East and Africa N-Methyl Pyrrolidone Industry Volume (K Tons), by Country 2024 & 2032
- Figure 65: Middle East and Africa N-Methyl Pyrrolidone Industry Revenue Share (%), by Country 2024 & 2032
- Figure 66: Middle East and Africa N-Methyl Pyrrolidone Industry Volume Share (%), by Country 2024 & 2032
List of Tables
- Table 1: Global N-Methyl Pyrrolidone Industry Revenue Million Forecast, by Region 2019 & 2032
- Table 2: Global N-Methyl Pyrrolidone Industry Volume K Tons Forecast, by Region 2019 & 2032
- Table 3: Global N-Methyl Pyrrolidone Industry Revenue Million Forecast, by Application 2019 & 2032
- Table 4: Global N-Methyl Pyrrolidone Industry Volume K Tons Forecast, by Application 2019 & 2032
- Table 5: Global N-Methyl Pyrrolidone Industry Revenue Million Forecast, by Region 2019 & 2032
- Table 6: Global N-Methyl Pyrrolidone Industry Volume K Tons Forecast, by Region 2019 & 2032
- Table 7: Global N-Methyl Pyrrolidone Industry Revenue Million Forecast, by Country 2019 & 2032
- Table 8: Global N-Methyl Pyrrolidone Industry Volume K Tons Forecast, by Country 2019 & 2032
- Table 9: United States N-Methyl Pyrrolidone Industry Revenue (Million) Forecast, by Application 2019 & 2032
- Table 10: United States N-Methyl Pyrrolidone Industry Volume (K Tons) Forecast, by Application 2019 & 2032
- Table 11: Canada N-Methyl Pyrrolidone Industry Revenue (Million) Forecast, by Application 2019 & 2032
- Table 12: Canada N-Methyl Pyrrolidone Industry Volume (K Tons) Forecast, by Application 2019 & 2032
- Table 13: Mexico N-Methyl Pyrrolidone Industry Revenue (Million) Forecast, by Application 2019 & 2032
- Table 14: Mexico N-Methyl Pyrrolidone Industry Volume (K Tons) Forecast, by Application 2019 & 2032
- Table 15: Global N-Methyl Pyrrolidone Industry Revenue Million Forecast, by Country 2019 & 2032
- Table 16: Global N-Methyl Pyrrolidone Industry Volume K Tons Forecast, by Country 2019 & 2032
- Table 17: Germany N-Methyl Pyrrolidone Industry Revenue (Million) Forecast, by Application 2019 & 2032
- Table 18: Germany N-Methyl Pyrrolidone Industry Volume (K Tons) Forecast, by Application 2019 & 2032
- Table 19: United Kingdom N-Methyl Pyrrolidone Industry Revenue (Million) Forecast, by Application 2019 & 2032
- Table 20: United Kingdom N-Methyl Pyrrolidone Industry Volume (K Tons) Forecast, by Application 2019 & 2032
- Table 21: France N-Methyl Pyrrolidone Industry Revenue (Million) Forecast, by Application 2019 & 2032
- Table 22: France N-Methyl Pyrrolidone Industry Volume (K Tons) Forecast, by Application 2019 & 2032
- Table 23: Spain N-Methyl Pyrrolidone Industry Revenue (Million) Forecast, by Application 2019 & 2032
- Table 24: Spain N-Methyl Pyrrolidone Industry Volume (K Tons) Forecast, by Application 2019 & 2032
- Table 25: Italy N-Methyl Pyrrolidone Industry Revenue (Million) Forecast, by Application 2019 & 2032
- Table 26: Italy N-Methyl Pyrrolidone Industry Volume (K Tons) Forecast, by Application 2019 & 2032
- Table 27: Spain N-Methyl Pyrrolidone Industry Revenue (Million) Forecast, by Application 2019 & 2032
- Table 28: Spain N-Methyl Pyrrolidone Industry Volume (K Tons) Forecast, by Application 2019 & 2032
- Table 29: Belgium N-Methyl Pyrrolidone Industry Revenue (Million) Forecast, by Application 2019 & 2032
- Table 30: Belgium N-Methyl Pyrrolidone Industry Volume (K Tons) Forecast, by Application 2019 & 2032
- Table 31: Netherland N-Methyl Pyrrolidone Industry Revenue (Million) Forecast, by Application 2019 & 2032
- Table 32: Netherland N-Methyl Pyrrolidone Industry Volume (K Tons) Forecast, by Application 2019 & 2032
- Table 33: Nordics N-Methyl Pyrrolidone Industry Revenue (Million) Forecast, by Application 2019 & 2032
- Table 34: Nordics N-Methyl Pyrrolidone Industry Volume (K Tons) Forecast, by Application 2019 & 2032
- Table 35: Rest of Europe N-Methyl Pyrrolidone Industry Revenue (Million) Forecast, by Application 2019 & 2032
- Table 36: Rest of Europe N-Methyl Pyrrolidone Industry Volume (K Tons) Forecast, by Application 2019 & 2032
- Table 37: Global N-Methyl Pyrrolidone Industry Revenue Million Forecast, by Country 2019 & 2032
- Table 38: Global N-Methyl Pyrrolidone Industry Volume K Tons Forecast, by Country 2019 & 2032
- Table 39: China N-Methyl Pyrrolidone Industry Revenue (Million) Forecast, by Application 2019 & 2032
- Table 40: China N-Methyl Pyrrolidone Industry Volume (K Tons) Forecast, by Application 2019 & 2032
- Table 41: Japan N-Methyl Pyrrolidone Industry Revenue (Million) Forecast, by Application 2019 & 2032
- Table 42: Japan N-Methyl Pyrrolidone Industry Volume (K Tons) Forecast, by Application 2019 & 2032
- Table 43: India N-Methyl Pyrrolidone Industry Revenue (Million) Forecast, by Application 2019 & 2032
- Table 44: India N-Methyl Pyrrolidone Industry Volume (K Tons) Forecast, by Application 2019 & 2032
- Table 45: South Korea N-Methyl Pyrrolidone Industry Revenue (Million) Forecast, by Application 2019 & 2032
- Table 46: South Korea N-Methyl Pyrrolidone Industry Volume (K Tons) Forecast, by Application 2019 & 2032
- Table 47: Southeast Asia N-Methyl Pyrrolidone Industry Revenue (Million) Forecast, by Application 2019 & 2032
- Table 48: Southeast Asia N-Methyl Pyrrolidone Industry Volume (K Tons) Forecast, by Application 2019 & 2032
- Table 49: Australia N-Methyl Pyrrolidone Industry Revenue (Million) Forecast, by Application 2019 & 2032
- Table 50: Australia N-Methyl Pyrrolidone Industry Volume (K Tons) Forecast, by Application 2019 & 2032
- Table 51: Indonesia N-Methyl Pyrrolidone Industry Revenue (Million) Forecast, by Application 2019 & 2032
- Table 52: Indonesia N-Methyl Pyrrolidone Industry Volume (K Tons) Forecast, by Application 2019 & 2032
- Table 53: Phillipes N-Methyl Pyrrolidone Industry Revenue (Million) Forecast, by Application 2019 & 2032
- Table 54: Phillipes N-Methyl Pyrrolidone Industry Volume (K Tons) Forecast, by Application 2019 & 2032
- Table 55: Singapore N-Methyl Pyrrolidone Industry Revenue (Million) Forecast, by Application 2019 & 2032
- Table 56: Singapore N-Methyl Pyrrolidone Industry Volume (K Tons) Forecast, by Application 2019 & 2032
- Table 57: Thailandc N-Methyl Pyrrolidone Industry Revenue (Million) Forecast, by Application 2019 & 2032
- Table 58: Thailandc N-Methyl Pyrrolidone Industry Volume (K Tons) Forecast, by Application 2019 & 2032
- Table 59: Rest of Asia Pacific N-Methyl Pyrrolidone Industry Revenue (Million) Forecast, by Application 2019 & 2032
- Table 60: Rest of Asia Pacific N-Methyl Pyrrolidone Industry Volume (K Tons) Forecast, by Application 2019 & 2032
- Table 61: Global N-Methyl Pyrrolidone Industry Revenue Million Forecast, by Country 2019 & 2032
- Table 62: Global N-Methyl Pyrrolidone Industry Volume K Tons Forecast, by Country 2019 & 2032
- Table 63: Brazil N-Methyl Pyrrolidone Industry Revenue (Million) Forecast, by Application 2019 & 2032
- Table 64: Brazil N-Methyl Pyrrolidone Industry Volume (K Tons) Forecast, by Application 2019 & 2032
- Table 65: Argentina N-Methyl Pyrrolidone Industry Revenue (Million) Forecast, by Application 2019 & 2032
- Table 66: Argentina N-Methyl Pyrrolidone Industry Volume (K Tons) Forecast, by Application 2019 & 2032
- Table 67: Peru N-Methyl Pyrrolidone Industry Revenue (Million) Forecast, by Application 2019 & 2032
- Table 68: Peru N-Methyl Pyrrolidone Industry Volume (K Tons) Forecast, by Application 2019 & 2032
- Table 69: Chile N-Methyl Pyrrolidone Industry Revenue (Million) Forecast, by Application 2019 & 2032
- Table 70: Chile N-Methyl Pyrrolidone Industry Volume (K Tons) Forecast, by Application 2019 & 2032
- Table 71: Colombia N-Methyl Pyrrolidone Industry Revenue (Million) Forecast, by Application 2019 & 2032
- Table 72: Colombia N-Methyl Pyrrolidone Industry Volume (K Tons) Forecast, by Application 2019 & 2032
- Table 73: Ecuador N-Methyl Pyrrolidone Industry Revenue (Million) Forecast, by Application 2019 & 2032
- Table 74: Ecuador N-Methyl Pyrrolidone Industry Volume (K Tons) Forecast, by Application 2019 & 2032
- Table 75: Venezuela N-Methyl Pyrrolidone Industry Revenue (Million) Forecast, by Application 2019 & 2032
- Table 76: Venezuela N-Methyl Pyrrolidone Industry Volume (K Tons) Forecast, by Application 2019 & 2032
- Table 77: Rest of South America N-Methyl Pyrrolidone Industry Revenue (Million) Forecast, by Application 2019 & 2032
- Table 78: Rest of South America N-Methyl Pyrrolidone Industry Volume (K Tons) Forecast, by Application 2019 & 2032
- Table 79: Global N-Methyl Pyrrolidone Industry Revenue Million Forecast, by Country 2019 & 2032
- Table 80: Global N-Methyl Pyrrolidone Industry Volume K Tons Forecast, by Country 2019 & 2032
- Table 81: United States N-Methyl Pyrrolidone Industry Revenue (Million) Forecast, by Application 2019 & 2032
- Table 82: United States N-Methyl Pyrrolidone Industry Volume (K Tons) Forecast, by Application 2019 & 2032
- Table 83: Canada N-Methyl Pyrrolidone Industry Revenue (Million) Forecast, by Application 2019 & 2032
- Table 84: Canada N-Methyl Pyrrolidone Industry Volume (K Tons) Forecast, by Application 2019 & 2032
- Table 85: Mexico N-Methyl Pyrrolidone Industry Revenue (Million) Forecast, by Application 2019 & 2032
- Table 86: Mexico N-Methyl Pyrrolidone Industry Volume (K Tons) Forecast, by Application 2019 & 2032
- Table 87: Global N-Methyl Pyrrolidone Industry Revenue Million Forecast, by Country 2019 & 2032
- Table 88: Global N-Methyl Pyrrolidone Industry Volume K Tons Forecast, by Country 2019 & 2032
- Table 89: United Arab Emirates N-Methyl Pyrrolidone Industry Revenue (Million) Forecast, by Application 2019 & 2032
- Table 90: United Arab Emirates N-Methyl Pyrrolidone Industry Volume (K Tons) Forecast, by Application 2019 & 2032
- Table 91: Saudi Arabia N-Methyl Pyrrolidone Industry Revenue (Million) Forecast, by Application 2019 & 2032
- Table 92: Saudi Arabia N-Methyl Pyrrolidone Industry Volume (K Tons) Forecast, by Application 2019 & 2032
- Table 93: South Africa N-Methyl Pyrrolidone Industry Revenue (Million) Forecast, by Application 2019 & 2032
- Table 94: South Africa N-Methyl Pyrrolidone Industry Volume (K Tons) Forecast, by Application 2019 & 2032
- Table 95: Rest of Middle East and Africa N-Methyl Pyrrolidone Industry Revenue (Million) Forecast, by Application 2019 & 2032
- Table 96: Rest of Middle East and Africa N-Methyl Pyrrolidone Industry Volume (K Tons) Forecast, by Application 2019 & 2032
- Table 97: Global N-Methyl Pyrrolidone Industry Revenue Million Forecast, by Application 2019 & 2032
- Table 98: Global N-Methyl Pyrrolidone Industry Volume K Tons Forecast, by Application 2019 & 2032
- Table 99: Global N-Methyl Pyrrolidone Industry Revenue Million Forecast, by Country 2019 & 2032
- Table 100: Global N-Methyl Pyrrolidone Industry Volume K Tons Forecast, by Country 2019 & 2032
- Table 101: China N-Methyl Pyrrolidone Industry Revenue (Million) Forecast, by Application 2019 & 2032
- Table 102: China N-Methyl Pyrrolidone Industry Volume (K Tons) Forecast, by Application 2019 & 2032
- Table 103: India N-Methyl Pyrrolidone Industry Revenue (Million) Forecast, by Application 2019 & 2032
- Table 104: India N-Methyl Pyrrolidone Industry Volume (K Tons) Forecast, by Application 2019 & 2032
- Table 105: Japan N-Methyl Pyrrolidone Industry Revenue (Million) Forecast, by Application 2019 & 2032
- Table 106: Japan N-Methyl Pyrrolidone Industry Volume (K Tons) Forecast, by Application 2019 & 2032
- Table 107: South Korea N-Methyl Pyrrolidone Industry Revenue (Million) Forecast, by Application 2019 & 2032
- Table 108: South Korea N-Methyl Pyrrolidone Industry Volume (K Tons) Forecast, by Application 2019 & 2032
- Table 109: Malaysia N-Methyl Pyrrolidone Industry Revenue (Million) Forecast, by Application 2019 & 2032
- Table 110: Malaysia N-Methyl Pyrrolidone Industry Volume (K Tons) Forecast, by Application 2019 & 2032
- Table 111: Thailand N-Methyl Pyrrolidone Industry Revenue (Million) Forecast, by Application 2019 & 2032
- Table 112: Thailand N-Methyl Pyrrolidone Industry Volume (K Tons) Forecast, by Application 2019 & 2032
- Table 113: Indonesia N-Methyl Pyrrolidone Industry Revenue (Million) Forecast, by Application 2019 & 2032
- Table 114: Indonesia N-Methyl Pyrrolidone Industry Volume (K Tons) Forecast, by Application 2019 & 2032
- Table 115: Vietnam N-Methyl Pyrrolidone Industry Revenue (Million) Forecast, by Application 2019 & 2032
- Table 116: Vietnam N-Methyl Pyrrolidone Industry Volume (K Tons) Forecast, by Application 2019 & 2032
- Table 117: Rest of Asia Pacific N-Methyl Pyrrolidone Industry Revenue (Million) Forecast, by Application 2019 & 2032
- Table 118: Rest of Asia Pacific N-Methyl Pyrrolidone Industry Volume (K Tons) Forecast, by Application 2019 & 2032
- Table 119: Global N-Methyl Pyrrolidone Industry Revenue Million Forecast, by Application 2019 & 2032
- Table 120: Global N-Methyl Pyrrolidone Industry Volume K Tons Forecast, by Application 2019 & 2032
- Table 121: Global N-Methyl Pyrrolidone Industry Revenue Million Forecast, by Country 2019 & 2032
- Table 122: Global N-Methyl Pyrrolidone Industry Volume K Tons Forecast, by Country 2019 & 2032
- Table 123: United States N-Methyl Pyrrolidone Industry Revenue (Million) Forecast, by Application 2019 & 2032
- Table 124: United States N-Methyl Pyrrolidone Industry Volume (K Tons) Forecast, by Application 2019 & 2032
- Table 125: Canada N-Methyl Pyrrolidone Industry Revenue (Million) Forecast, by Application 2019 & 2032
- Table 126: Canada N-Methyl Pyrrolidone Industry Volume (K Tons) Forecast, by Application 2019 & 2032
- Table 127: Mexico N-Methyl Pyrrolidone Industry Revenue (Million) Forecast, by Application 2019 & 2032
- Table 128: Mexico N-Methyl Pyrrolidone Industry Volume (K Tons) Forecast, by Application 2019 & 2032
- Table 129: Global N-Methyl Pyrrolidone Industry Revenue Million Forecast, by Application 2019 & 2032
- Table 130: Global N-Methyl Pyrrolidone Industry Volume K Tons Forecast, by Application 2019 & 2032
- Table 131: Global N-Methyl Pyrrolidone Industry Revenue Million Forecast, by Country 2019 & 2032
- Table 132: Global N-Methyl Pyrrolidone Industry Volume K Tons Forecast, by Country 2019 & 2032
- Table 133: Germany N-Methyl Pyrrolidone Industry Revenue (Million) Forecast, by Application 2019 & 2032
- Table 134: Germany N-Methyl Pyrrolidone Industry Volume (K Tons) Forecast, by Application 2019 & 2032
- Table 135: United Kingdom N-Methyl Pyrrolidone Industry Revenue (Million) Forecast, by Application 2019 & 2032
- Table 136: United Kingdom N-Methyl Pyrrolidone Industry Volume (K Tons) Forecast, by Application 2019 & 2032
- Table 137: Italy N-Methyl Pyrrolidone Industry Revenue (Million) Forecast, by Application 2019 & 2032
- Table 138: Italy N-Methyl Pyrrolidone Industry Volume (K Tons) Forecast, by Application 2019 & 2032
- Table 139: France N-Methyl Pyrrolidone Industry Revenue (Million) Forecast, by Application 2019 & 2032
- Table 140: France N-Methyl Pyrrolidone Industry Volume (K Tons) Forecast, by Application 2019 & 2032
- Table 141: Spain N-Methyl Pyrrolidone Industry Revenue (Million) Forecast, by Application 2019 & 2032
- Table 142: Spain N-Methyl Pyrrolidone Industry Volume (K Tons) Forecast, by Application 2019 & 2032
- Table 143: Nordic Countries N-Methyl Pyrrolidone Industry Revenue (Million) Forecast, by Application 2019 & 2032
- Table 144: Nordic Countries N-Methyl Pyrrolidone Industry Volume (K Tons) Forecast, by Application 2019 & 2032
- Table 145: Russia N-Methyl Pyrrolidone Industry Revenue (Million) Forecast, by Application 2019 & 2032
- Table 146: Russia N-Methyl Pyrrolidone Industry Volume (K Tons) Forecast, by Application 2019 & 2032
- Table 147: Rest of Europe N-Methyl Pyrrolidone Industry Revenue (Million) Forecast, by Application 2019 & 2032
- Table 148: Rest of Europe N-Methyl Pyrrolidone Industry Volume (K Tons) Forecast, by Application 2019 & 2032
- Table 149: Global N-Methyl Pyrrolidone Industry Revenue Million Forecast, by Application 2019 & 2032
- Table 150: Global N-Methyl Pyrrolidone Industry Volume K Tons Forecast, by Application 2019 & 2032
- Table 151: Global N-Methyl Pyrrolidone Industry Revenue Million Forecast, by Country 2019 & 2032
- Table 152: Global N-Methyl Pyrrolidone Industry Volume K Tons Forecast, by Country 2019 & 2032
- Table 153: Brazil N-Methyl Pyrrolidone Industry Revenue (Million) Forecast, by Application 2019 & 2032
- Table 154: Brazil N-Methyl Pyrrolidone Industry Volume (K Tons) Forecast, by Application 2019 & 2032
- Table 155: Argentina N-Methyl Pyrrolidone Industry Revenue (Million) Forecast, by Application 2019 & 2032
- Table 156: Argentina N-Methyl Pyrrolidone Industry Volume (K Tons) Forecast, by Application 2019 & 2032
- Table 157: Colombia N-Methyl Pyrrolidone Industry Revenue (Million) Forecast, by Application 2019 & 2032
- Table 158: Colombia N-Methyl Pyrrolidone Industry Volume (K Tons) Forecast, by Application 2019 & 2032
- Table 159: Rest of South America N-Methyl Pyrrolidone Industry Revenue (Million) Forecast, by Application 2019 & 2032
- Table 160: Rest of South America N-Methyl Pyrrolidone Industry Volume (K Tons) Forecast, by Application 2019 & 2032
- Table 161: Global N-Methyl Pyrrolidone Industry Revenue Million Forecast, by Application 2019 & 2032
- Table 162: Global N-Methyl Pyrrolidone Industry Volume K Tons Forecast, by Application 2019 & 2032
- Table 163: Global N-Methyl Pyrrolidone Industry Revenue Million Forecast, by Country 2019 & 2032
- Table 164: Global N-Methyl Pyrrolidone Industry Volume K Tons Forecast, by Country 2019 & 2032
- Table 165: Saudi Arabia N-Methyl Pyrrolidone Industry Revenue (Million) Forecast, by Application 2019 & 2032
- Table 166: Saudi Arabia N-Methyl Pyrrolidone Industry Volume (K Tons) Forecast, by Application 2019 & 2032
- Table 167: Qatar N-Methyl Pyrrolidone Industry Revenue (Million) Forecast, by Application 2019 & 2032
- Table 168: Qatar N-Methyl Pyrrolidone Industry Volume (K Tons) Forecast, by Application 2019 & 2032
- Table 169: United Arab Emirates N-Methyl Pyrrolidone Industry Revenue (Million) Forecast, by Application 2019 & 2032
- Table 170: United Arab Emirates N-Methyl Pyrrolidone Industry Volume (K Tons) Forecast, by Application 2019 & 2032
- Table 171: Nigeria N-Methyl Pyrrolidone Industry Revenue (Million) Forecast, by Application 2019 & 2032
- Table 172: Nigeria N-Methyl Pyrrolidone Industry Volume (K Tons) Forecast, by Application 2019 & 2032
- Table 173: South Africa N-Methyl Pyrrolidone Industry Revenue (Million) Forecast, by Application 2019 & 2032
- Table 174: South Africa N-Methyl Pyrrolidone Industry Volume (K Tons) Forecast, by Application 2019 & 2032
- Table 175: Rest of MEA N-Methyl Pyrrolidone Industry Revenue (Million) Forecast, by Application 2019 & 2032
- Table 176: Rest of MEA N-Methyl Pyrrolidone Industry Volume (K Tons) Forecast, by Application 2019 & 2032
Frequently Asked Questions
1. What is the projected Compound Annual Growth Rate (CAGR) of the N-Methyl Pyrrolidone Industry?
The projected CAGR is approximately > 4.00%.
2. Which companies are prominent players in the N-Methyl Pyrrolidone Industry?
Key companies in the market include Prasol Chemicals Limited, Santa Cruz Biotechnology Inc, Puyang Guangming Chemical Co Ltd, Tokyo Chemical Industry Co Ltd*List Not Exhaustive, Hefei TNJ Chemical Industry Co Ltd, BALAJI AMINES, Mitsubishi Chemical Corporation, BYN Chemical Co Ltd, Ashland, Binzhou City Zhanhua District Ruian Chemical Co Ltd, BASF SE, Ganzhou Zhongneng Industrial Co Ltd, Eastman Chemical Company, Shandong Qingyun Changxin Chemical Science-Tech Co Ltd, LyondellBasell Industries Holdings BV.
3. What are the main segments of the N-Methyl Pyrrolidone Industry?
The market segments include Application.
4. Can you provide details about the market size?
The market size is estimated to be USD 1.03 Million as of 2022.
5. What are some drivers contributing to market growth?
Growing Demand From the Electronics Industry; Increasing Usage in the Pharmaceutical Industry.
6. What are the notable trends driving market growth?
Increasing Demand from Electronics Segment.
7. Are there any restraints impacting market growth?
N-methyl Pyrrolidone Hazards and Its Greener Alternatives.
8. Can you provide examples of recent developments in the market?
March 2024: Ganzhou Municipal Administration for Industry and Commerce announced the planned acceptance of the environmental impact assessment file for Ganzhou Zhongneng Industrial Co. Ltd, including the planned 150,000-ton NMP, 30,000-ton GBL, and 20,000-ton 2P expansion project. The company is expected to build a 50,000-ton NMP synthetic production line and a 50,000-ton NMP recovery refining production line.
9. What pricing options are available for accessing the report?
Pricing options include single-user, multi-user, and enterprise licenses priced at USD 4750, USD 5250, and USD 8750 respectively.
10. Is the market size provided in terms of value or volume?
The market size is provided in terms of value, measured in Million and volume, measured in K Tons.
11. Are there any specific market keywords associated with the report?
Yes, the market keyword associated with the report is "N-Methyl Pyrrolidone Industry," which aids in identifying and referencing the specific market segment covered.
12. How do I determine which pricing option suits my needs best?
The pricing options vary based on user requirements and access needs. Individual users may opt for single-user licenses, while businesses requiring broader access may choose multi-user or enterprise licenses for cost-effective access to the report.
13. Are there any additional resources or data provided in the N-Methyl Pyrrolidone Industry report?
While the report offers comprehensive insights, it's advisable to review the specific contents or supplementary materials provided to ascertain if additional resources or data are available.
14. How can I stay updated on further developments or reports in the N-Methyl Pyrrolidone Industry?
To stay informed about further developments, trends, and reports in the N-Methyl Pyrrolidone Industry, consider subscribing to industry newsletters, following relevant companies and organizations, or regularly checking reputable industry news sources and publications.
Methodology
Step 1 - Identification of Relevant Samples Size from Population Database


Step 2 - Approaches for Defining Global Market Size (Value, Volume* & Price*)

Note*: In applicable scenarios
Step 3 - Data Sources
Primary Research
- Web Analytics
- Survey Reports
- Research Institute
- Latest Research Reports
- Opinion Leaders
Secondary Research
- Annual Reports
- White Paper
- Latest Press Release
- Industry Association
- Paid Database
- Investor Presentations

Step 4 - Data Triangulation
Involves using different sources of information in order to increase the validity of a study
These sources are likely to be stakeholders in a program - participants, other researchers, program staff, other community members, and so on.
Then we put all data in single framework & apply various statistical tools to find out the dynamic on the market.
During the analysis stage, feedback from the stakeholder groups would be compared to determine areas of agreement as well as areas of divergence


