
Key Insights
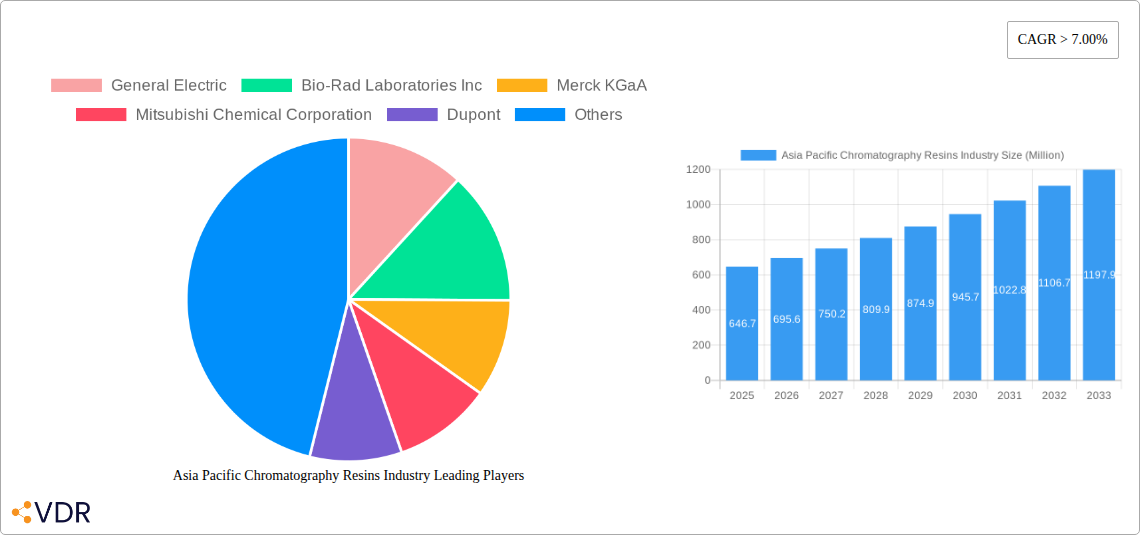
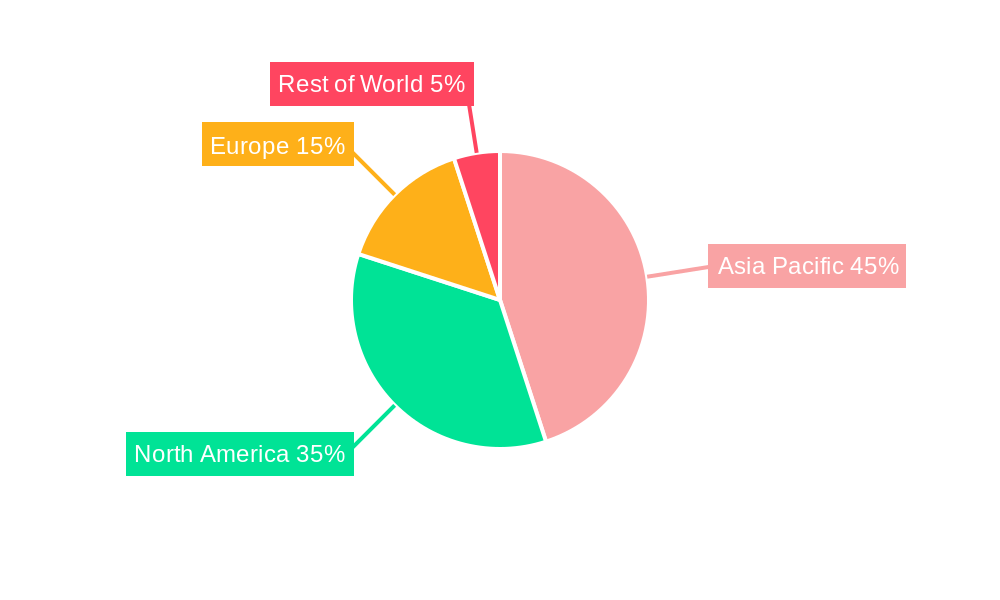
The Asia-Pacific chromatography resins market, valued at $646.7 million in 2025, is projected to experience robust growth, driven by a Compound Annual Growth Rate (CAGR) exceeding 7.00% from 2025 to 2033. This expansion is fueled by several key factors. Firstly, the burgeoning pharmaceutical and biotechnology sectors in countries like China, India, Japan, and South Korea are significantly increasing demand for high-purity compounds, driving the adoption of advanced chromatography techniques. Secondly, stringent regulatory requirements for drug production and food safety are pushing manufacturers to invest in sophisticated purification technologies, boosting the market for chromatography resins. Thirdly, the rising prevalence of chronic diseases necessitates more efficient drug development and manufacturing processes, thus contributing to higher resin consumption. The market is segmented by resin origin (natural and synthetic), technology (ion exchange, affinity, size exclusion, hydrophobic interaction, and others), and end-user industry (pharmaceuticals, food and beverages, and water & environmental agencies). While the pharmaceutical sector dominates, other industries are showing promising growth potential, particularly in emerging economies. The presence of established global players like Merck KGaA, Bio-Rad Laboratories, and Thermo Fisher Scientific, along with several regional manufacturers, ensures a competitive and innovative landscape. However, potential restraints include fluctuations in raw material prices and the increasing complexity of resin manufacturing processes. The significant market size and projected growth trajectory indicate substantial investment and expansion opportunities within the Asia-Pacific region, particularly in China and India, which are expected to be major growth drivers in the coming years.
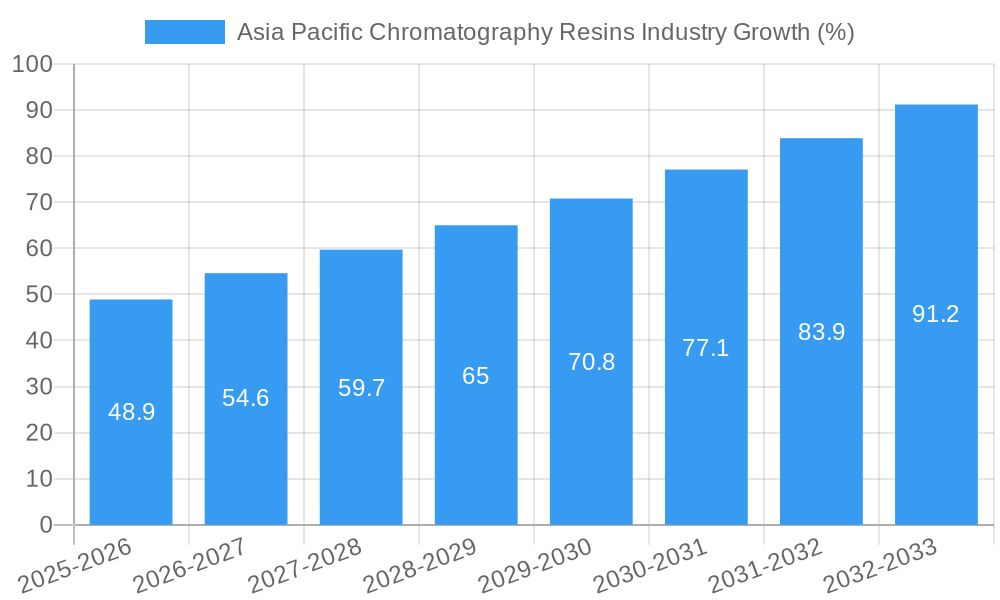
The forecast for the Asia-Pacific chromatography resins market extends to 2033, with continued growth expected throughout the forecast period. The strong CAGR indicates consistent market expansion, influenced by factors such as technological advancements in resin production, the growing preference for sophisticated separation techniques, and the ever-increasing demand for high-purity products across various industries. Factors like technological innovation, leading to improved resin efficiency and selectivity, and the increasing adoption of automation in chromatography processes are expected to further accelerate market growth. Despite potential challenges like price volatility and the need for skilled personnel to operate advanced chromatographic systems, the long-term outlook for the Asia-Pacific chromatography resins market remains positive, given the region's thriving pharmaceutical, biotechnology, and food processing industries.
Asia Pacific Chromatography Resins Industry: A Comprehensive Market Report (2019-2033)
This comprehensive report provides an in-depth analysis of the Asia Pacific Chromatography Resins industry, offering invaluable insights for industry professionals, investors, and strategic decision-makers. Covering the period from 2019 to 2033, with a base year of 2025 and a forecast period of 2025-2033, this report dissects market dynamics, growth trends, and future opportunities across various segments. The report value is in Million units.
Keywords: Chromatography Resins, Asia Pacific, Ion Exchange Chromatography, Affinity Chromatography, Size Exclusion Chromatography, Hydrophobic Interaction Chromatography, Pharmaceuticals, Drug Production, Water Treatment, Food and Beverage, Market Size, Market Share, Growth Rate, CAGR, Market Analysis, Market Forecast, Competitive Landscape, Industry Trends.
Asia Pacific Chromatography Resins Industry Market Dynamics & Structure
The Asia Pacific chromatography resins market is characterized by a moderately concentrated landscape, with key players like General Electric, Bio-Rad Laboratories Inc, Merck KGaA, Mitsubishi Chemical Corporation, DuPont, Pall Corporation, Tosoh Bioscience LLC, Purolite, Agilent Technologies, Avantor Inc, and Thermo Fisher Scientific holding significant market share. Technological innovation, particularly in high-performance resins and advanced separation techniques, is a major driver. Stringent regulatory frameworks governing pharmaceutical and food safety influence market growth and adoption rates. The market also faces competition from alternative separation technologies. M&A activity has been moderate, with a focus on strategic acquisitions to expand product portfolios and geographical reach. Over the historical period (2019-2024), approximately xx M&A deals were recorded, contributing to a xx% increase in market consolidation.
- Market Concentration: Moderately concentrated, with top 10 players holding xx% market share in 2025.
- Technological Innovation: Focus on high-throughput, high-resolution resins, and automation.
- Regulatory Framework: Stringent regulations for pharmaceutical and food applications drive demand for high-quality resins.
- Competitive Substitutes: Alternative separation technologies pose a competitive challenge.
- M&A Trends: Moderate activity, focused on expanding product portfolios and geographical reach.
- Innovation Barriers: High R&D costs and regulatory approvals pose significant barriers.
Asia Pacific Chromatography Resins Industry Growth Trends & Insights
The Asia Pacific chromatography resins market experienced robust growth during the historical period (2019-2024), driven by rising demand from the pharmaceutical and biotechnology sectors. The market size reached xx million units in 2024, exhibiting a CAGR of xx% during this period. This growth is projected to continue through the forecast period (2025-2033), with a projected CAGR of xx%, reaching xx million units by 2033. Increased adoption of chromatography techniques in various applications, including drug discovery, water purification, and food analysis, fuels this expansion. Technological advancements, such as the development of novel resin materials with enhanced selectivity and efficiency, are further accelerating market growth. Shifting consumer preferences towards high-quality products and increasing awareness of environmental regulations also contribute to the expanding market. Market penetration in emerging economies remains relatively low, presenting significant untapped potential.
Dominant Regions, Countries, or Segments in Asia Pacific Chromatography Resins Industry
China and India are the dominant markets in the Asia Pacific region, accounting for xx% and xx% of the total market share in 2025 respectively. This dominance is attributed to several factors: rapid growth of the pharmaceutical and biotechnology industries, increasing government investments in healthcare and infrastructure, and a growing demand for advanced separation technologies in various sectors like water treatment and food processing. Within the product segments, Ion Exchange Chromatography Resins and Affinity Chromatography Resins hold the largest market share, driven by their wide-ranging applications in drug purification and biopharmaceutical production. Pharmaceuticals remains the dominant end-user industry.
- Key Drivers in China and India:
- Rapid growth of pharmaceutical and biotechnology industries.
- Increasing government investment in healthcare and infrastructure.
- Growing demand for advanced separation technologies.
- Dominant Segments:
- Ion Exchange Chromatography Resins
- Affinity Chromatography Resins
- Pharmaceuticals (End-user industry)
Asia Pacific Chromatography Resins Industry Product Landscape
The chromatography resins market offers a diverse range of products tailored to specific applications. Recent innovations include high-performance resins with improved selectivity, efficiency, and durability. These advancements enable faster separations, higher yields, and reduced operational costs. The industry focuses on developing resins with unique surface functionalities to enhance target molecule binding and purification. Key performance metrics include binding capacity, resolution, and pressure drop, which are constantly being optimized. Companies are also focusing on developing environmentally friendly resins with reduced waste generation and improved sustainability.
Key Drivers, Barriers & Challenges in Asia Pacific Chromatography Resins Industry
Key Drivers: The increasing demand for high-purity products in the pharmaceutical and biotechnology sectors is a major driver. Technological advancements in resin materials and separation techniques are also pushing market expansion. Government regulations emphasizing product safety and environmental protection stimulate the adoption of advanced chromatography technologies.
Challenges: High raw material costs and stringent regulatory requirements represent significant hurdles. Competition from alternative separation technologies and supply chain disruptions pose challenges to market growth. The price sensitivity of some end-user industries may also impact market expansion. For example, xx% increase in raw material costs in 2024 resulted in a xx% price increase in resins.
Emerging Opportunities in Asia Pacific Chromatography Resins Industry
Untapped opportunities exist in emerging economies, where demand for advanced separation technologies is increasing. Innovative applications of chromatography resins in emerging fields like personalized medicine and environmental monitoring present significant growth potential. The development of sustainable and environmentally friendly resins is gaining traction, creating opportunities for companies focused on green technologies. Growing consumer preference for high-quality food and beverages also drives demand for advanced separation techniques in the food and beverage sector.
Growth Accelerators in the Asia Pacific Chromatography Resins Industry
Technological breakthroughs, such as the development of novel resin materials and advanced separation techniques, are key growth catalysts. Strategic partnerships between resin manufacturers and end-user industries are fostering collaboration and innovation. Expanding into new applications, such as environmental remediation and biofuel production, creates new revenue streams and market opportunities. Aggressive market expansion strategies, including entering emerging economies and strengthening distribution networks, will play a critical role.
Key Players Shaping the Asia Pacific Chromatography Resins Industry Market
- General Electric
- Bio-Rad Laboratories Inc
- Merck KGaA
- Mitsubishi Chemical Corporation
- Dupont
- Pall Corporation
- Tosoh Bioscience LLC
- Purolite
- Agilent Technologies
- Avantor Inc
- Thermo Fisher Scientific
Notable Milestones in Asia Pacific Chromatography Resins Industry Sector
- 2020: Launch of a novel high-performance resin by Agilent Technologies.
- 2021: Merck KGaA announces a strategic partnership with a major pharmaceutical company.
- 2022: Acquisition of a smaller resin manufacturer by Bio-Rad Laboratories Inc.
- 2023: Introduction of a new line of sustainable chromatography resins by Purolite.
- 2024: New regulatory guidelines for chromatography resin applications in food and beverage industry in China.
In-Depth Asia Pacific Chromatography Resins Industry Market Outlook
The Asia Pacific chromatography resins market is poised for sustained growth, driven by technological advancements, increasing demand from key end-user industries, and the expansion into emerging markets. Strategic partnerships, innovative product development, and investment in R&D will further propel market expansion. The market’s future potential is considerable, especially in rapidly developing economies, offering lucrative opportunities for both established players and new entrants. Focus on sustainability and environmentally friendly technologies will play a crucial role in shaping the future of the market.
Asia Pacific Chromatography Resins Industry Segmentation
-
1. Origin
-
1.1. Natural-based
- 1.1.1. Agarose
- 1.1.2. Dextran
-
1.2. Synthetic-based
- 1.2.1. Silica Gel
- 1.2.2. Aluminum Oxide
- 1.2.3. Polystyrene
- 1.2.4. Other Synthetic-based Resins
-
1.1. Natural-based
-
2. Technology
- 2.1. Ion Exchange Chromatography Resins
- 2.2. Affinity Chromatography Resins
- 2.3. Size Exclusion Chromatography Resins
- 2.4. Hydrophobic Interaction Chromatography Resins
- 2.5. Other Technologies
-
3. End-user Industry
-
3.1. Pharmaceuticals
- 3.1.1. Biotechnology
- 3.1.2. Drug Discovery
- 3.1.3. Drug Production
- 3.2. Water and Environmental Agencies
- 3.3. Food and Beverages
- 3.4. Other End-user Industries
-
3.1. Pharmaceuticals
-
4. Geography
- 4.1. China
- 4.2. India
- 4.3. Japan
- 4.4. Rest of Asia-Pacific
Asia Pacific Chromatography Resins Industry Segmentation By Geography
- 1. China
- 2. India
- 3. Japan
- 4. Rest of Asia Pacific
Asia Pacific Chromatography Resins Industry REPORT HIGHLIGHTS
| Aspects | Details |
|---|---|
| Study Period | 2019-2033 |
| Base Year | 2024 |
| Estimated Year | 2025 |
| Forecast Period | 2025-2033 |
| Historical Period | 2019-2024 |
| Growth Rate | CAGR of > 7.00% from 2019-2033 |
| Segmentation |
|
Table of Contents
- 1. Introduction
- 1.1. Research Scope
- 1.2. Market Segmentation
- 1.3. Research Methodology
- 1.4. Definitions and Assumptions
- 2. Executive Summary
- 2.1. Introduction
- 3. Market Dynamics
- 3.1. Introduction
- 3.2. Market Drivers
- 3.2.1. ; Rising Demand from the Pharmaceutical Sector; Technological Advancements in Chromatography Resins; Increasing Importance of Chromatography Tests in Drug Approvals
- 3.3. Market Restrains
- 3.3.1. ; High Costs vs. Productivity of Chromatography Systems
- 3.4. Market Trends
- 3.4.1. Increasing Demand from Pharmaceutical Sector
- 4. Market Factor Analysis
- 4.1. Porters Five Forces
- 4.2. Supply/Value Chain
- 4.3. PESTEL analysis
- 4.4. Market Entropy
- 4.5. Patent/Trademark Analysis
- 5. Asia Pacific Chromatography Resins Industry Analysis, Insights and Forecast, 2019-2031
- 5.1. Market Analysis, Insights and Forecast - by Origin
- 5.1.1. Natural-based
- 5.1.1.1. Agarose
- 5.1.1.2. Dextran
- 5.1.2. Synthetic-based
- 5.1.2.1. Silica Gel
- 5.1.2.2. Aluminum Oxide
- 5.1.2.3. Polystyrene
- 5.1.2.4. Other Synthetic-based Resins
- 5.1.1. Natural-based
- 5.2. Market Analysis, Insights and Forecast - by Technology
- 5.2.1. Ion Exchange Chromatography Resins
- 5.2.2. Affinity Chromatography Resins
- 5.2.3. Size Exclusion Chromatography Resins
- 5.2.4. Hydrophobic Interaction Chromatography Resins
- 5.2.5. Other Technologies
- 5.3. Market Analysis, Insights and Forecast - by End-user Industry
- 5.3.1. Pharmaceuticals
- 5.3.1.1. Biotechnology
- 5.3.1.2. Drug Discovery
- 5.3.1.3. Drug Production
- 5.3.2. Water and Environmental Agencies
- 5.3.3. Food and Beverages
- 5.3.4. Other End-user Industries
- 5.3.1. Pharmaceuticals
- 5.4. Market Analysis, Insights and Forecast - by Geography
- 5.4.1. China
- 5.4.2. India
- 5.4.3. Japan
- 5.4.4. Rest of Asia-Pacific
- 5.5. Market Analysis, Insights and Forecast - by Region
- 5.5.1. China
- 5.5.2. India
- 5.5.3. Japan
- 5.5.4. Rest of Asia Pacific
- 5.1. Market Analysis, Insights and Forecast - by Origin
- 6. China Asia Pacific Chromatography Resins Industry Analysis, Insights and Forecast, 2019-2031
- 6.1. Market Analysis, Insights and Forecast - by Origin
- 6.1.1. Natural-based
- 6.1.1.1. Agarose
- 6.1.1.2. Dextran
- 6.1.2. Synthetic-based
- 6.1.2.1. Silica Gel
- 6.1.2.2. Aluminum Oxide
- 6.1.2.3. Polystyrene
- 6.1.2.4. Other Synthetic-based Resins
- 6.1.1. Natural-based
- 6.2. Market Analysis, Insights and Forecast - by Technology
- 6.2.1. Ion Exchange Chromatography Resins
- 6.2.2. Affinity Chromatography Resins
- 6.2.3. Size Exclusion Chromatography Resins
- 6.2.4. Hydrophobic Interaction Chromatography Resins
- 6.2.5. Other Technologies
- 6.3. Market Analysis, Insights and Forecast - by End-user Industry
- 6.3.1. Pharmaceuticals
- 6.3.1.1. Biotechnology
- 6.3.1.2. Drug Discovery
- 6.3.1.3. Drug Production
- 6.3.2. Water and Environmental Agencies
- 6.3.3. Food and Beverages
- 6.3.4. Other End-user Industries
- 6.3.1. Pharmaceuticals
- 6.4. Market Analysis, Insights and Forecast - by Geography
- 6.4.1. China
- 6.4.2. India
- 6.4.3. Japan
- 6.4.4. Rest of Asia-Pacific
- 6.1. Market Analysis, Insights and Forecast - by Origin
- 7. India Asia Pacific Chromatography Resins Industry Analysis, Insights and Forecast, 2019-2031
- 7.1. Market Analysis, Insights and Forecast - by Origin
- 7.1.1. Natural-based
- 7.1.1.1. Agarose
- 7.1.1.2. Dextran
- 7.1.2. Synthetic-based
- 7.1.2.1. Silica Gel
- 7.1.2.2. Aluminum Oxide
- 7.1.2.3. Polystyrene
- 7.1.2.4. Other Synthetic-based Resins
- 7.1.1. Natural-based
- 7.2. Market Analysis, Insights and Forecast - by Technology
- 7.2.1. Ion Exchange Chromatography Resins
- 7.2.2. Affinity Chromatography Resins
- 7.2.3. Size Exclusion Chromatography Resins
- 7.2.4. Hydrophobic Interaction Chromatography Resins
- 7.2.5. Other Technologies
- 7.3. Market Analysis, Insights and Forecast - by End-user Industry
- 7.3.1. Pharmaceuticals
- 7.3.1.1. Biotechnology
- 7.3.1.2. Drug Discovery
- 7.3.1.3. Drug Production
- 7.3.2. Water and Environmental Agencies
- 7.3.3. Food and Beverages
- 7.3.4. Other End-user Industries
- 7.3.1. Pharmaceuticals
- 7.4. Market Analysis, Insights and Forecast - by Geography
- 7.4.1. China
- 7.4.2. India
- 7.4.3. Japan
- 7.4.4. Rest of Asia-Pacific
- 7.1. Market Analysis, Insights and Forecast - by Origin
- 8. Japan Asia Pacific Chromatography Resins Industry Analysis, Insights and Forecast, 2019-2031
- 8.1. Market Analysis, Insights and Forecast - by Origin
- 8.1.1. Natural-based
- 8.1.1.1. Agarose
- 8.1.1.2. Dextran
- 8.1.2. Synthetic-based
- 8.1.2.1. Silica Gel
- 8.1.2.2. Aluminum Oxide
- 8.1.2.3. Polystyrene
- 8.1.2.4. Other Synthetic-based Resins
- 8.1.1. Natural-based
- 8.2. Market Analysis, Insights and Forecast - by Technology
- 8.2.1. Ion Exchange Chromatography Resins
- 8.2.2. Affinity Chromatography Resins
- 8.2.3. Size Exclusion Chromatography Resins
- 8.2.4. Hydrophobic Interaction Chromatography Resins
- 8.2.5. Other Technologies
- 8.3. Market Analysis, Insights and Forecast - by End-user Industry
- 8.3.1. Pharmaceuticals
- 8.3.1.1. Biotechnology
- 8.3.1.2. Drug Discovery
- 8.3.1.3. Drug Production
- 8.3.2. Water and Environmental Agencies
- 8.3.3. Food and Beverages
- 8.3.4. Other End-user Industries
- 8.3.1. Pharmaceuticals
- 8.4. Market Analysis, Insights and Forecast - by Geography
- 8.4.1. China
- 8.4.2. India
- 8.4.3. Japan
- 8.4.4. Rest of Asia-Pacific
- 8.1. Market Analysis, Insights and Forecast - by Origin
- 9. Rest of Asia Pacific Asia Pacific Chromatography Resins Industry Analysis, Insights and Forecast, 2019-2031
- 9.1. Market Analysis, Insights and Forecast - by Origin
- 9.1.1. Natural-based
- 9.1.1.1. Agarose
- 9.1.1.2. Dextran
- 9.1.2. Synthetic-based
- 9.1.2.1. Silica Gel
- 9.1.2.2. Aluminum Oxide
- 9.1.2.3. Polystyrene
- 9.1.2.4. Other Synthetic-based Resins
- 9.1.1. Natural-based
- 9.2. Market Analysis, Insights and Forecast - by Technology
- 9.2.1. Ion Exchange Chromatography Resins
- 9.2.2. Affinity Chromatography Resins
- 9.2.3. Size Exclusion Chromatography Resins
- 9.2.4. Hydrophobic Interaction Chromatography Resins
- 9.2.5. Other Technologies
- 9.3. Market Analysis, Insights and Forecast - by End-user Industry
- 9.3.1. Pharmaceuticals
- 9.3.1.1. Biotechnology
- 9.3.1.2. Drug Discovery
- 9.3.1.3. Drug Production
- 9.3.2. Water and Environmental Agencies
- 9.3.3. Food and Beverages
- 9.3.4. Other End-user Industries
- 9.3.1. Pharmaceuticals
- 9.4. Market Analysis, Insights and Forecast - by Geography
- 9.4.1. China
- 9.4.2. India
- 9.4.3. Japan
- 9.4.4. Rest of Asia-Pacific
- 9.1. Market Analysis, Insights and Forecast - by Origin
- 10. China Asia Pacific Chromatography Resins Industry Analysis, Insights and Forecast, 2019-2031
- 11. Japan Asia Pacific Chromatography Resins Industry Analysis, Insights and Forecast, 2019-2031
- 12. India Asia Pacific Chromatography Resins Industry Analysis, Insights and Forecast, 2019-2031
- 13. South Korea Asia Pacific Chromatography Resins Industry Analysis, Insights and Forecast, 2019-2031
- 14. Taiwan Asia Pacific Chromatography Resins Industry Analysis, Insights and Forecast, 2019-2031
- 15. Australia Asia Pacific Chromatography Resins Industry Analysis, Insights and Forecast, 2019-2031
- 16. Rest of Asia-Pacific Asia Pacific Chromatography Resins Industry Analysis, Insights and Forecast, 2019-2031
- 17. Competitive Analysis
- 17.1. Market Share Analysis 2024
- 17.2. Company Profiles
- 17.2.1 General Electric
- 17.2.1.1. Overview
- 17.2.1.2. Products
- 17.2.1.3. SWOT Analysis
- 17.2.1.4. Recent Developments
- 17.2.1.5. Financials (Based on Availability)
- 17.2.2 Bio-Rad Laboratories Inc
- 17.2.2.1. Overview
- 17.2.2.2. Products
- 17.2.2.3. SWOT Analysis
- 17.2.2.4. Recent Developments
- 17.2.2.5. Financials (Based on Availability)
- 17.2.3 Merck KGaA
- 17.2.3.1. Overview
- 17.2.3.2. Products
- 17.2.3.3. SWOT Analysis
- 17.2.3.4. Recent Developments
- 17.2.3.5. Financials (Based on Availability)
- 17.2.4 Mitsubishi Chemical Corporation
- 17.2.4.1. Overview
- 17.2.4.2. Products
- 17.2.4.3. SWOT Analysis
- 17.2.4.4. Recent Developments
- 17.2.4.5. Financials (Based on Availability)
- 17.2.5 Dupont
- 17.2.5.1. Overview
- 17.2.5.2. Products
- 17.2.5.3. SWOT Analysis
- 17.2.5.4. Recent Developments
- 17.2.5.5. Financials (Based on Availability)
- 17.2.6 Pall Corporation
- 17.2.6.1. Overview
- 17.2.6.2. Products
- 17.2.6.3. SWOT Analysis
- 17.2.6.4. Recent Developments
- 17.2.6.5. Financials (Based on Availability)
- 17.2.7 Tosoh Bioscience LLC*List Not Exhaustive
- 17.2.7.1. Overview
- 17.2.7.2. Products
- 17.2.7.3. SWOT Analysis
- 17.2.7.4. Recent Developments
- 17.2.7.5. Financials (Based on Availability)
- 17.2.8 Purolite
- 17.2.8.1. Overview
- 17.2.8.2. Products
- 17.2.8.3. SWOT Analysis
- 17.2.8.4. Recent Developments
- 17.2.8.5. Financials (Based on Availability)
- 17.2.9 Agilient Technologies
- 17.2.9.1. Overview
- 17.2.9.2. Products
- 17.2.9.3. SWOT Analysis
- 17.2.9.4. Recent Developments
- 17.2.9.5. Financials (Based on Availability)
- 17.2.10 Avantor Inc
- 17.2.10.1. Overview
- 17.2.10.2. Products
- 17.2.10.3. SWOT Analysis
- 17.2.10.4. Recent Developments
- 17.2.10.5. Financials (Based on Availability)
- 17.2.11 Thermo Fisher Scientific
- 17.2.11.1. Overview
- 17.2.11.2. Products
- 17.2.11.3. SWOT Analysis
- 17.2.11.4. Recent Developments
- 17.2.11.5. Financials (Based on Availability)
- 17.2.1 General Electric
List of Figures
- Figure 1: Asia Pacific Chromatography Resins Industry Revenue Breakdown (Million, %) by Product 2024 & 2032
- Figure 2: Asia Pacific Chromatography Resins Industry Share (%) by Company 2024
List of Tables
- Table 1: Asia Pacific Chromatography Resins Industry Revenue Million Forecast, by Region 2019 & 2032
- Table 2: Asia Pacific Chromatography Resins Industry Volume K Tons Forecast, by Region 2019 & 2032
- Table 3: Asia Pacific Chromatography Resins Industry Revenue Million Forecast, by Origin 2019 & 2032
- Table 4: Asia Pacific Chromatography Resins Industry Volume K Tons Forecast, by Origin 2019 & 2032
- Table 5: Asia Pacific Chromatography Resins Industry Revenue Million Forecast, by Technology 2019 & 2032
- Table 6: Asia Pacific Chromatography Resins Industry Volume K Tons Forecast, by Technology 2019 & 2032
- Table 7: Asia Pacific Chromatography Resins Industry Revenue Million Forecast, by End-user Industry 2019 & 2032
- Table 8: Asia Pacific Chromatography Resins Industry Volume K Tons Forecast, by End-user Industry 2019 & 2032
- Table 9: Asia Pacific Chromatography Resins Industry Revenue Million Forecast, by Geography 2019 & 2032
- Table 10: Asia Pacific Chromatography Resins Industry Volume K Tons Forecast, by Geography 2019 & 2032
- Table 11: Asia Pacific Chromatography Resins Industry Revenue Million Forecast, by Region 2019 & 2032
- Table 12: Asia Pacific Chromatography Resins Industry Volume K Tons Forecast, by Region 2019 & 2032
- Table 13: Asia Pacific Chromatography Resins Industry Revenue Million Forecast, by Country 2019 & 2032
- Table 14: Asia Pacific Chromatography Resins Industry Volume K Tons Forecast, by Country 2019 & 2032
- Table 15: China Asia Pacific Chromatography Resins Industry Revenue (Million) Forecast, by Application 2019 & 2032
- Table 16: China Asia Pacific Chromatography Resins Industry Volume (K Tons) Forecast, by Application 2019 & 2032
- Table 17: Japan Asia Pacific Chromatography Resins Industry Revenue (Million) Forecast, by Application 2019 & 2032
- Table 18: Japan Asia Pacific Chromatography Resins Industry Volume (K Tons) Forecast, by Application 2019 & 2032
- Table 19: India Asia Pacific Chromatography Resins Industry Revenue (Million) Forecast, by Application 2019 & 2032
- Table 20: India Asia Pacific Chromatography Resins Industry Volume (K Tons) Forecast, by Application 2019 & 2032
- Table 21: South Korea Asia Pacific Chromatography Resins Industry Revenue (Million) Forecast, by Application 2019 & 2032
- Table 22: South Korea Asia Pacific Chromatography Resins Industry Volume (K Tons) Forecast, by Application 2019 & 2032
- Table 23: Taiwan Asia Pacific Chromatography Resins Industry Revenue (Million) Forecast, by Application 2019 & 2032
- Table 24: Taiwan Asia Pacific Chromatography Resins Industry Volume (K Tons) Forecast, by Application 2019 & 2032
- Table 25: Australia Asia Pacific Chromatography Resins Industry Revenue (Million) Forecast, by Application 2019 & 2032
- Table 26: Australia Asia Pacific Chromatography Resins Industry Volume (K Tons) Forecast, by Application 2019 & 2032
- Table 27: Rest of Asia-Pacific Asia Pacific Chromatography Resins Industry Revenue (Million) Forecast, by Application 2019 & 2032
- Table 28: Rest of Asia-Pacific Asia Pacific Chromatography Resins Industry Volume (K Tons) Forecast, by Application 2019 & 2032
- Table 29: Asia Pacific Chromatography Resins Industry Revenue Million Forecast, by Origin 2019 & 2032
- Table 30: Asia Pacific Chromatography Resins Industry Volume K Tons Forecast, by Origin 2019 & 2032
- Table 31: Asia Pacific Chromatography Resins Industry Revenue Million Forecast, by Technology 2019 & 2032
- Table 32: Asia Pacific Chromatography Resins Industry Volume K Tons Forecast, by Technology 2019 & 2032
- Table 33: Asia Pacific Chromatography Resins Industry Revenue Million Forecast, by End-user Industry 2019 & 2032
- Table 34: Asia Pacific Chromatography Resins Industry Volume K Tons Forecast, by End-user Industry 2019 & 2032
- Table 35: Asia Pacific Chromatography Resins Industry Revenue Million Forecast, by Geography 2019 & 2032
- Table 36: Asia Pacific Chromatography Resins Industry Volume K Tons Forecast, by Geography 2019 & 2032
- Table 37: Asia Pacific Chromatography Resins Industry Revenue Million Forecast, by Country 2019 & 2032
- Table 38: Asia Pacific Chromatography Resins Industry Volume K Tons Forecast, by Country 2019 & 2032
- Table 39: Asia Pacific Chromatography Resins Industry Revenue Million Forecast, by Origin 2019 & 2032
- Table 40: Asia Pacific Chromatography Resins Industry Volume K Tons Forecast, by Origin 2019 & 2032
- Table 41: Asia Pacific Chromatography Resins Industry Revenue Million Forecast, by Technology 2019 & 2032
- Table 42: Asia Pacific Chromatography Resins Industry Volume K Tons Forecast, by Technology 2019 & 2032
- Table 43: Asia Pacific Chromatography Resins Industry Revenue Million Forecast, by End-user Industry 2019 & 2032
- Table 44: Asia Pacific Chromatography Resins Industry Volume K Tons Forecast, by End-user Industry 2019 & 2032
- Table 45: Asia Pacific Chromatography Resins Industry Revenue Million Forecast, by Geography 2019 & 2032
- Table 46: Asia Pacific Chromatography Resins Industry Volume K Tons Forecast, by Geography 2019 & 2032
- Table 47: Asia Pacific Chromatography Resins Industry Revenue Million Forecast, by Country 2019 & 2032
- Table 48: Asia Pacific Chromatography Resins Industry Volume K Tons Forecast, by Country 2019 & 2032
- Table 49: Asia Pacific Chromatography Resins Industry Revenue Million Forecast, by Origin 2019 & 2032
- Table 50: Asia Pacific Chromatography Resins Industry Volume K Tons Forecast, by Origin 2019 & 2032
- Table 51: Asia Pacific Chromatography Resins Industry Revenue Million Forecast, by Technology 2019 & 2032
- Table 52: Asia Pacific Chromatography Resins Industry Volume K Tons Forecast, by Technology 2019 & 2032
- Table 53: Asia Pacific Chromatography Resins Industry Revenue Million Forecast, by End-user Industry 2019 & 2032
- Table 54: Asia Pacific Chromatography Resins Industry Volume K Tons Forecast, by End-user Industry 2019 & 2032
- Table 55: Asia Pacific Chromatography Resins Industry Revenue Million Forecast, by Geography 2019 & 2032
- Table 56: Asia Pacific Chromatography Resins Industry Volume K Tons Forecast, by Geography 2019 & 2032
- Table 57: Asia Pacific Chromatography Resins Industry Revenue Million Forecast, by Country 2019 & 2032
- Table 58: Asia Pacific Chromatography Resins Industry Volume K Tons Forecast, by Country 2019 & 2032
- Table 59: Asia Pacific Chromatography Resins Industry Revenue Million Forecast, by Origin 2019 & 2032
- Table 60: Asia Pacific Chromatography Resins Industry Volume K Tons Forecast, by Origin 2019 & 2032
- Table 61: Asia Pacific Chromatography Resins Industry Revenue Million Forecast, by Technology 2019 & 2032
- Table 62: Asia Pacific Chromatography Resins Industry Volume K Tons Forecast, by Technology 2019 & 2032
- Table 63: Asia Pacific Chromatography Resins Industry Revenue Million Forecast, by End-user Industry 2019 & 2032
- Table 64: Asia Pacific Chromatography Resins Industry Volume K Tons Forecast, by End-user Industry 2019 & 2032
- Table 65: Asia Pacific Chromatography Resins Industry Revenue Million Forecast, by Geography 2019 & 2032
- Table 66: Asia Pacific Chromatography Resins Industry Volume K Tons Forecast, by Geography 2019 & 2032
- Table 67: Asia Pacific Chromatography Resins Industry Revenue Million Forecast, by Country 2019 & 2032
- Table 68: Asia Pacific Chromatography Resins Industry Volume K Tons Forecast, by Country 2019 & 2032
Frequently Asked Questions
1. What is the projected Compound Annual Growth Rate (CAGR) of the Asia Pacific Chromatography Resins Industry?
The projected CAGR is approximately > 7.00%.
2. Which companies are prominent players in the Asia Pacific Chromatography Resins Industry?
Key companies in the market include General Electric, Bio-Rad Laboratories Inc, Merck KGaA, Mitsubishi Chemical Corporation, Dupont, Pall Corporation, Tosoh Bioscience LLC*List Not Exhaustive, Purolite, Agilient Technologies, Avantor Inc, Thermo Fisher Scientific.
3. What are the main segments of the Asia Pacific Chromatography Resins Industry?
The market segments include Origin, Technology, End-user Industry, Geography.
4. Can you provide details about the market size?
The market size is estimated to be USD 646.7 Million as of 2022.
5. What are some drivers contributing to market growth?
; Rising Demand from the Pharmaceutical Sector; Technological Advancements in Chromatography Resins; Increasing Importance of Chromatography Tests in Drug Approvals.
6. What are the notable trends driving market growth?
Increasing Demand from Pharmaceutical Sector.
7. Are there any restraints impacting market growth?
; High Costs vs. Productivity of Chromatography Systems.
8. Can you provide examples of recent developments in the market?
N/A
9. What pricing options are available for accessing the report?
Pricing options include single-user, multi-user, and enterprise licenses priced at USD 4750, USD 5250, and USD 8750 respectively.
10. Is the market size provided in terms of value or volume?
The market size is provided in terms of value, measured in Million and volume, measured in K Tons.
11. Are there any specific market keywords associated with the report?
Yes, the market keyword associated with the report is "Asia Pacific Chromatography Resins Industry," which aids in identifying and referencing the specific market segment covered.
12. How do I determine which pricing option suits my needs best?
The pricing options vary based on user requirements and access needs. Individual users may opt for single-user licenses, while businesses requiring broader access may choose multi-user or enterprise licenses for cost-effective access to the report.
13. Are there any additional resources or data provided in the Asia Pacific Chromatography Resins Industry report?
While the report offers comprehensive insights, it's advisable to review the specific contents or supplementary materials provided to ascertain if additional resources or data are available.
14. How can I stay updated on further developments or reports in the Asia Pacific Chromatography Resins Industry?
To stay informed about further developments, trends, and reports in the Asia Pacific Chromatography Resins Industry, consider subscribing to industry newsletters, following relevant companies and organizations, or regularly checking reputable industry news sources and publications.
Methodology
Step 1 - Identification of Relevant Samples Size from Population Database


Step 2 - Approaches for Defining Global Market Size (Value, Volume* & Price*)

Note*: In applicable scenarios
Step 3 - Data Sources
Primary Research
- Web Analytics
- Survey Reports
- Research Institute
- Latest Research Reports
- Opinion Leaders
Secondary Research
- Annual Reports
- White Paper
- Latest Press Release
- Industry Association
- Paid Database
- Investor Presentations

Step 4 - Data Triangulation
Involves using different sources of information in order to increase the validity of a study
These sources are likely to be stakeholders in a program - participants, other researchers, program staff, other community members, and so on.
Then we put all data in single framework & apply various statistical tools to find out the dynamic on the market.
During the analysis stage, feedback from the stakeholder groups would be compared to determine areas of agreement as well as areas of divergence


