
Key Insights
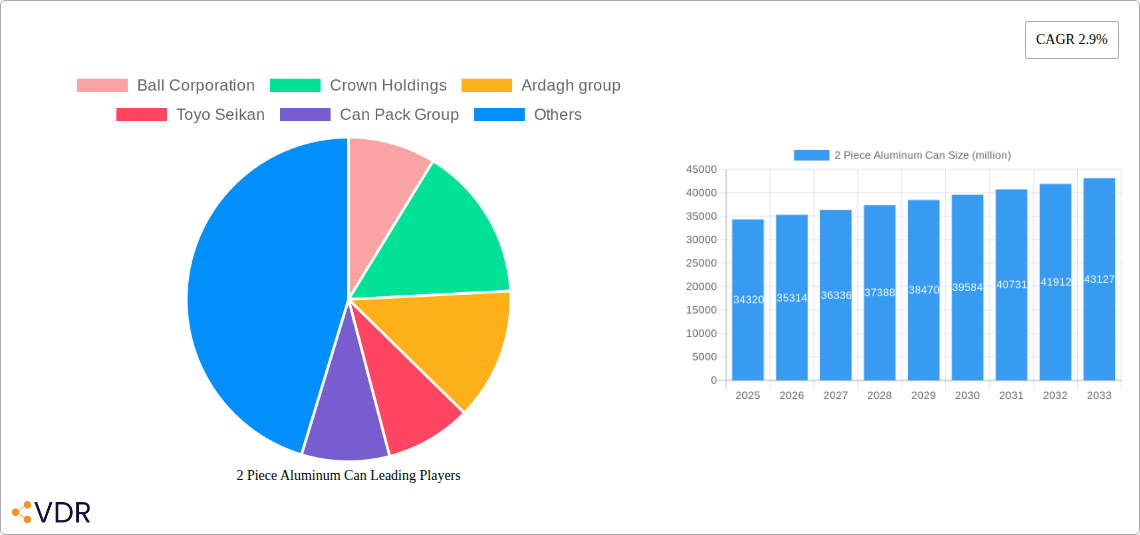
The global 2-piece aluminum can market is poised for steady growth, projected to reach a market size of approximately $34,320 million by 2025, with a Compound Annual Growth Rate (CAGR) of 2.9% anticipated through 2033. This sustained expansion is primarily fueled by the increasing demand for convenient and sustainable beverage packaging solutions. The beer segment continues to be a dominant force, driven by the growing popularity of craft beers and ready-to-drink (RTD) beverages, where aluminum cans offer superior preservation of flavor and extend shelf life. Similarly, the burgeoning carbonated drinks sector, encompassing soft drinks and sparkling water, also significantly contributes to market growth. The market is largely segmented into Draw and Redraw (DRD) cans and Drawn and Wall Ironed (DWI) cans, with DWI cans holding a prominent share due to their lightweight and efficient production processes, ideal for high-volume beverage packaging.
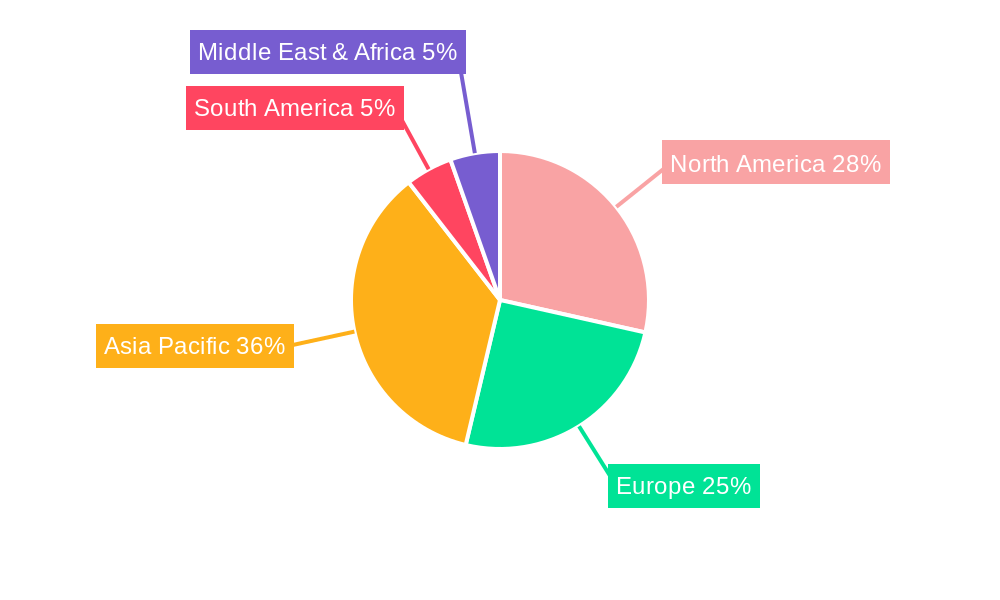
Emerging trends such as enhanced recyclability, lightweighting initiatives, and sophisticated printing technologies are shaping the competitive landscape. Manufacturers are increasingly investing in advanced production techniques to optimize material usage and reduce environmental impact, aligning with growing consumer and regulatory preferences for sustainable packaging. Key players like Ball Corporation, Crown Holdings, and Ardagh Group are at the forefront of these innovations, focusing on expanding production capacities and geographical reach, particularly in rapidly developing regions like Asia Pacific and parts of South America. While the market benefits from strong demand and a well-established infrastructure, potential restraints could include fluctuations in raw material prices (aluminum), increasing competition from alternative packaging materials, and evolving regulatory landscapes regarding environmental standards and recycling mandates in different regions.
Global 2 Piece Aluminum Can Market: Comprehensive Growth Analysis & Future Outlook (2019-2033)
This in-depth report offers a meticulously researched analysis of the global 2 piece aluminum can market, covering historical trends, current dynamics, and future projections from 2019 to 2033. We delve into the intricate market structure, growth drivers, regional dominance, product innovation, and competitive landscape, providing actionable insights for stakeholders in the beverage packaging industry. The report leverages extensive data to forecast the market size and identify emerging opportunities.
2 Piece Aluminum Can Market Dynamics & Structure
The global 2 piece aluminum can market exhibits a moderately concentrated structure, with leading players like Ball Corporation and Crown Holdings holding significant market shares. Technological innovation is a primary driver, focusing on lightweighting, enhanced barrier properties, and sustainable manufacturing processes. Regulatory frameworks, particularly those promoting recyclability and reduced environmental impact, are increasingly shaping market dynamics. Competitive product substitutes, such as PET bottles and glass containers, pose a consistent challenge, necessitating continuous innovation in aluminum can technology. End-user demographics, including a growing preference for convenient and portable beverage packaging among younger populations, are fueling demand. Mergers and acquisitions (M&A) remain a strategic tool for market consolidation and expansion. In recent years, an estimated 15-20 M&A deals were observed annually, impacting market share distribution.
- Market Concentration: Dominated by a few key players, with increasing influence from emerging regional manufacturers.
- Technological Innovation: Focus on lightweighting, advanced coatings, and sustainability certifications.
- Regulatory Frameworks: Growing emphasis on circular economy principles and waste reduction targets.
- Competitive Product Substitutes: PET bottles and glass containers present ongoing market competition.
- End-User Demographics: Rising demand from on-the-go consumption and premium beverage segments.
- M&A Trends: Strategic acquisitions aimed at expanding production capacity and geographical reach.
2 Piece Aluminum Can Growth Trends & Insights
The global 2 piece aluminum can market is poised for robust expansion, driven by a confluence of factors. The market size, estimated to be valued at approximately $75,000 million units in 2025, is projected to witness a Compound Annual Growth Rate (CAGR) of 3.8% during the forecast period of 2025-2033. This growth is underpinned by increasing adoption rates across various beverage segments, particularly beer and carbonated drinks. Technological disruptions, such as advancements in can manufacturing processes and the development of more sustainable aluminum alloys, are significantly enhancing production efficiency and reducing environmental footprint. Consumer behavior shifts, including a growing preference for sustainable packaging options and the convenience offered by aluminum cans, are further propelling market penetration. The market penetration for 2 piece aluminum cans is expected to reach over 85% within the beverage packaging sector by 2033. The rising disposable incomes in emerging economies are also contributing to increased consumption of packaged beverages, thereby augmenting the demand for aluminum cans. The ongoing efforts by beverage manufacturers to enhance brand visibility and product differentiation through innovative can designs and printing technologies are also a notable growth driver. Furthermore, the inherent recyclability and high recycling rates of aluminum cans position them favorably against less sustainable alternatives, aligning with global environmental initiatives and consumer consciousness. The base year of 2025 serves as a crucial benchmark, with historical data from 2019-2024 demonstrating a consistent upward trajectory.
Dominant Regions, Countries, or Segments in 2 Piece Aluminum Can
The Beer application segment is unequivocally the dominant force within the global 2 piece aluminum can market. In 2025, this segment is estimated to account for a substantial 55% of the total market revenue, valued at approximately $41,250 million units. This dominance is driven by several key factors. Firstly, the established consumer preference for canned beer across developed and developing economies provides a consistent and massive demand base. Secondly, the portability and convenience of aluminum cans make them ideal for various consumption occasions, from outdoor gatherings to home consumption. Thirdly, the inert nature of aluminum ensures product integrity and shelf-life for beer, a critical factor for brand reputation.
- Key Drivers for Beer Segment Dominance:
- Established Consumer Preference: Long-standing tradition and widespread acceptance of canned beer globally.
- Portability & Convenience: Ideal for on-the-go consumption and various lifestyle scenarios.
- Product Integrity: Aluminum's inert properties preserve beer's taste and quality.
- Brand Differentiation: Advanced printing and design capabilities enhance visual appeal.
- Recyclability Appeal: Growing consumer consciousness favors environmentally friendly packaging.
Geographically, North America continues to be a leading region, driven by a mature beverage market and a strong emphasis on sustainability. In 2025, North America is projected to hold a market share of approximately 30%, valued at $22,500 million units. The region's robust demand for both beer and carbonated drinks, coupled with stringent environmental regulations promoting recycled content, further solidifies its leading position. The presence of major beverage manufacturers and established recycling infrastructure are significant contributing factors.
2 Piece Aluminum Can Product Landscape
The 2 piece aluminum can market is characterized by continuous product innovation aimed at enhancing sustainability and functionality. Lightweighting initiatives are a paramount focus, with ongoing research and development in thinner yet robust aluminum alloys and advanced forming techniques. These advancements not only reduce material costs but also contribute to a lower carbon footprint during transportation. Furthermore, innovations in internal and external coatings are improving product shelf-life and offering enhanced compatibility with a wider range of beverages, including those with higher acidity. The increasing adoption of high-resolution printing and unique decorative finishes is also a notable trend, allowing brands to differentiate their products in a competitive marketplace. The DWI (Drawn and Wall Ironed) can type, favored for its sleek profile and cost-effectiveness, continues to dominate, while DRD (Draw and Redraw) cans find niche applications.
Key Drivers, Barriers & Challenges in 2 Piece Aluminum Can
Key Drivers:
- Growing Demand for Sustainable Packaging: The inherent recyclability and high recycling rates of aluminum cans are a major draw for environmentally conscious consumers and regulatory bodies.
- Convenience and Portability: Aluminum cans are lightweight, durable, and easy to transport, aligning with modern consumer lifestyles.
- Technological Advancements: Innovations in lightweighting, material science, and manufacturing processes are improving efficiency and reducing costs.
- Expanding Beverage Market: Growth in segments like craft beer, seltzers, and ready-to-drink (RTD) beverages fuels demand for canned packaging.
Barriers & Challenges:
- Raw Material Price Volatility: Fluctuations in aluminum prices can impact production costs and profitability.
- Competition from Alternative Packaging: PET bottles and glass containers remain significant competitors.
- Energy-Intensive Production: Aluminum production requires substantial energy, though ongoing efforts are focused on improving energy efficiency and utilizing renewable sources.
- Logistical Costs: Transportation of lightweight cans can still be a significant cost factor, especially for global supply chains.
- Regulatory Hurdles: While generally favorable, evolving waste management and recycling regulations can pose compliance challenges. The projected impact of stricter EPR (Extended Producer Responsibility) schemes could add an estimated 2-5% to operational costs for some manufacturers.
Emerging Opportunities in 2 Piece Aluminum Can
Emerging opportunities in the 2 piece aluminum can market are primarily centered around sustainability and niche beverage categories. The development of infinitely recyclable aluminum alloys and closed-loop recycling systems presents a significant avenue for growth, aligning with global circular economy goals. Untapped markets in developing economies, driven by rising disposable incomes and changing consumer habits, offer substantial potential. Innovative applications beyond traditional beverages, such as for functional drinks, pharmaceuticals, or even personal care products, are also gaining traction. The increasing consumer preference for smaller, single-serving portions also creates opportunities for specialized can sizes and formats. Furthermore, advancements in smart packaging technologies, incorporating QR codes or NFC tags for enhanced consumer engagement and traceability, represent a future growth frontier. The projected market for aluminum cans in RTD coffee and tea segments is expected to grow by 5% CAGR.
Growth Accelerators in the 2 Piece Aluminum Can Industry
Several catalysts are accelerating long-term growth in the 2 piece aluminum can industry. Technological breakthroughs in reducing the carbon footprint of aluminum production, including the adoption of renewable energy sources and more efficient smelting processes, are crucial. Strategic partnerships between can manufacturers and beverage companies to co-develop innovative packaging solutions will further drive adoption. Market expansion into emerging economies, focusing on localized production and distribution networks, will unlock new demand centers. The increasing emphasis on a circular economy by governments and industry stakeholders provides a strong tailwind, encouraging the use of recycled aluminum and promoting investment in recycling infrastructure. The continuous drive for lightweighting, leading to cost savings and environmental benefits, remains a core growth accelerator, projected to reduce average can weight by 1-2% annually.
Key Players Shaping the 2 Piece Aluminum Can Market
- Ball Corporation
- Crown Holdings
- Ardagh Group
- Toyo Seikan
- Can Pack Group
- Silgan Holdings Inc
- Daiwa Can Company
- Baosteel Packaging
- ORG Technology
- ShengXing Group
- CPMC Holdings
- Hokkan Holdings
- Showa Aluminum Can Corporation
- United Can (Great China Metal)
- Kingcan Holdings
- Jiamei Food Packaging
- Jiyuan Packaging Holdings
Notable Milestones in 2 Piece Aluminum Can Sector
- 2019: Ball Corporation's acquisition of Rexam PLC further consolidated its global market position.
- 2020: Crown Holdings announced significant investments in capacity expansion for its beverage can business in North America and Europe.
- 2021: Ardagh Group launched initiatives focused on increasing the recycled content in its aluminum can production.
- 2022: ORG Technology expanded its production facilities in Asia to cater to the growing demand for aluminum packaging.
- 2023: Introduction of advanced lightweighting technologies by major manufacturers, leading to cans with reduced material usage.
- 2024: Increased focus on sustainable sourcing of aluminum and development of closed-loop recycling programs by industry leaders.
In-Depth 2 Piece Aluminum Can Market Outlook
The future outlook for the 2 piece aluminum can market remains exceptionally positive, driven by its inherent sustainability advantages and the ongoing evolution of the beverage industry. Growth accelerators, such as advancements in low-carbon aluminum production and the expansion into new geographical markets, are poised to sustain robust expansion. Strategic opportunities lie in leveraging the increasing consumer demand for eco-friendly packaging, further solidifying aluminum's position as a preferred choice. The market is expected to continue its upward trajectory, with a projected market value reaching approximately $100,000 million units by 2033. Continued investment in R&D for innovative designs, improved recycling technologies, and enhanced functionality will be critical for stakeholders to capitalize on the burgeoning opportunities and maintain a competitive edge in this dynamic sector.
2 Piece Aluminum Can Segmentation
-
1. Application
- 1.1. Beer
- 1.2. Carbonated Drinks
- 1.3. Others
-
2. Types
- 2.1. DRD (Draw and Redraw) Cans
- 2.2. DWI (Drawn and Wall Ironed) Cans
2 Piece Aluminum Can Segmentation By Geography
-
1. North America
- 1.1. United States
- 1.2. Canada
- 1.3. Mexico
-
2. South America
- 2.1. Brazil
- 2.2. Argentina
- 2.3. Rest of South America
-
3. Europe
- 3.1. United Kingdom
- 3.2. Germany
- 3.3. France
- 3.4. Italy
- 3.5. Spain
- 3.6. Russia
- 3.7. Benelux
- 3.8. Nordics
- 3.9. Rest of Europe
-
4. Middle East & Africa
- 4.1. Turkey
- 4.2. Israel
- 4.3. GCC
- 4.4. North Africa
- 4.5. South Africa
- 4.6. Rest of Middle East & Africa
-
5. Asia Pacific
- 5.1. China
- 5.2. India
- 5.3. Japan
- 5.4. South Korea
- 5.5. ASEAN
- 5.6. Oceania
- 5.7. Rest of Asia Pacific
2 Piece Aluminum Can REPORT HIGHLIGHTS
| Aspects | Details |
|---|---|
| Study Period | 2019-2033 |
| Base Year | 2024 |
| Estimated Year | 2025 |
| Forecast Period | 2025-2033 |
| Historical Period | 2019-2024 |
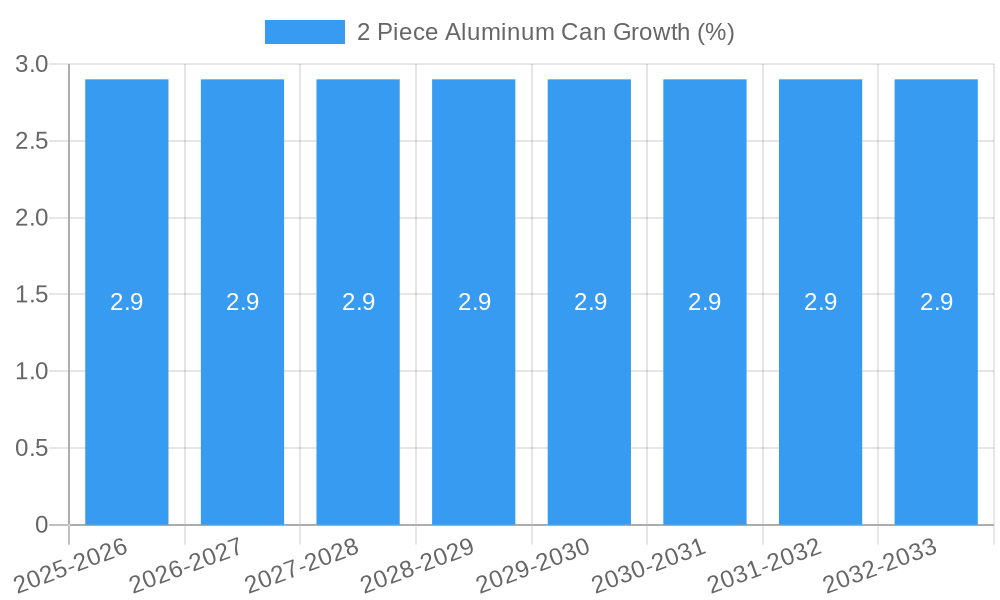
| Growth Rate | CAGR of 2.9% from 2019-2033 |
| Segmentation |
|
Table of Contents
- 1. Introduction
- 1.1. Research Scope
- 1.2. Market Segmentation
- 1.3. Research Methodology
- 1.4. Definitions and Assumptions
- 2. Executive Summary
- 2.1. Introduction
- 3. Market Dynamics
- 3.1. Introduction
- 3.2. Market Drivers
- 3.3. Market Restrains
- 3.4. Market Trends
- 4. Market Factor Analysis
- 4.1. Porters Five Forces
- 4.2. Supply/Value Chain
- 4.3. PESTEL analysis
- 4.4. Market Entropy
- 4.5. Patent/Trademark Analysis
- 5. Global 2 Piece Aluminum Can Analysis, Insights and Forecast, 2019-2031
- 5.1. Market Analysis, Insights and Forecast - by Application
- 5.1.1. Beer
- 5.1.2. Carbonated Drinks
- 5.1.3. Others
- 5.2. Market Analysis, Insights and Forecast - by Types
- 5.2.1. DRD (Draw and Redraw) Cans
- 5.2.2. DWI (Drawn and Wall Ironed) Cans
- 5.3. Market Analysis, Insights and Forecast - by Region
- 5.3.1. North America
- 5.3.2. South America
- 5.3.3. Europe
- 5.3.4. Middle East & Africa
- 5.3.5. Asia Pacific
- 5.1. Market Analysis, Insights and Forecast - by Application
- 6. North America 2 Piece Aluminum Can Analysis, Insights and Forecast, 2019-2031
- 6.1. Market Analysis, Insights and Forecast - by Application
- 6.1.1. Beer
- 6.1.2. Carbonated Drinks
- 6.1.3. Others
- 6.2. Market Analysis, Insights and Forecast - by Types
- 6.2.1. DRD (Draw and Redraw) Cans
- 6.2.2. DWI (Drawn and Wall Ironed) Cans
- 6.1. Market Analysis, Insights and Forecast - by Application
- 7. South America 2 Piece Aluminum Can Analysis, Insights and Forecast, 2019-2031
- 7.1. Market Analysis, Insights and Forecast - by Application
- 7.1.1. Beer
- 7.1.2. Carbonated Drinks
- 7.1.3. Others
- 7.2. Market Analysis, Insights and Forecast - by Types
- 7.2.1. DRD (Draw and Redraw) Cans
- 7.2.2. DWI (Drawn and Wall Ironed) Cans
- 7.1. Market Analysis, Insights and Forecast - by Application
- 8. Europe 2 Piece Aluminum Can Analysis, Insights and Forecast, 2019-2031
- 8.1. Market Analysis, Insights and Forecast - by Application
- 8.1.1. Beer
- 8.1.2. Carbonated Drinks
- 8.1.3. Others
- 8.2. Market Analysis, Insights and Forecast - by Types
- 8.2.1. DRD (Draw and Redraw) Cans
- 8.2.2. DWI (Drawn and Wall Ironed) Cans
- 8.1. Market Analysis, Insights and Forecast - by Application
- 9. Middle East & Africa 2 Piece Aluminum Can Analysis, Insights and Forecast, 2019-2031
- 9.1. Market Analysis, Insights and Forecast - by Application
- 9.1.1. Beer
- 9.1.2. Carbonated Drinks
- 9.1.3. Others
- 9.2. Market Analysis, Insights and Forecast - by Types
- 9.2.1. DRD (Draw and Redraw) Cans
- 9.2.2. DWI (Drawn and Wall Ironed) Cans
- 9.1. Market Analysis, Insights and Forecast - by Application
- 10. Asia Pacific 2 Piece Aluminum Can Analysis, Insights and Forecast, 2019-2031
- 10.1. Market Analysis, Insights and Forecast - by Application
- 10.1.1. Beer
- 10.1.2. Carbonated Drinks
- 10.1.3. Others
- 10.2. Market Analysis, Insights and Forecast - by Types
- 10.2.1. DRD (Draw and Redraw) Cans
- 10.2.2. DWI (Drawn and Wall Ironed) Cans
- 10.1. Market Analysis, Insights and Forecast - by Application
- 11. Competitive Analysis
- 11.1. Global Market Share Analysis 2024
- 11.2. Company Profiles
- 11.2.1 Ball Corporation
- 11.2.1.1. Overview
- 11.2.1.2. Products
- 11.2.1.3. SWOT Analysis
- 11.2.1.4. Recent Developments
- 11.2.1.5. Financials (Based on Availability)
- 11.2.2 Crown Holdings
- 11.2.2.1. Overview
- 11.2.2.2. Products
- 11.2.2.3. SWOT Analysis
- 11.2.2.4. Recent Developments
- 11.2.2.5. Financials (Based on Availability)
- 11.2.3 Ardagh group
- 11.2.3.1. Overview
- 11.2.3.2. Products
- 11.2.3.3. SWOT Analysis
- 11.2.3.4. Recent Developments
- 11.2.3.5. Financials (Based on Availability)
- 11.2.4 Toyo Seikan
- 11.2.4.1. Overview
- 11.2.4.2. Products
- 11.2.4.3. SWOT Analysis
- 11.2.4.4. Recent Developments
- 11.2.4.5. Financials (Based on Availability)
- 11.2.5 Can Pack Group
- 11.2.5.1. Overview
- 11.2.5.2. Products
- 11.2.5.3. SWOT Analysis
- 11.2.5.4. Recent Developments
- 11.2.5.5. Financials (Based on Availability)
- 11.2.6 Silgan Holdings Inc
- 11.2.6.1. Overview
- 11.2.6.2. Products
- 11.2.6.3. SWOT Analysis
- 11.2.6.4. Recent Developments
- 11.2.6.5. Financials (Based on Availability)
- 11.2.7 Daiwa Can Company
- 11.2.7.1. Overview
- 11.2.7.2. Products
- 11.2.7.3. SWOT Analysis
- 11.2.7.4. Recent Developments
- 11.2.7.5. Financials (Based on Availability)
- 11.2.8 Baosteel Packaging
- 11.2.8.1. Overview
- 11.2.8.2. Products
- 11.2.8.3. SWOT Analysis
- 11.2.8.4. Recent Developments
- 11.2.8.5. Financials (Based on Availability)
- 11.2.9 ORG Technology
- 11.2.9.1. Overview
- 11.2.9.2. Products
- 11.2.9.3. SWOT Analysis
- 11.2.9.4. Recent Developments
- 11.2.9.5. Financials (Based on Availability)
- 11.2.10 ShengXing Group
- 11.2.10.1. Overview
- 11.2.10.2. Products
- 11.2.10.3. SWOT Analysis
- 11.2.10.4. Recent Developments
- 11.2.10.5. Financials (Based on Availability)
- 11.2.11 CPMC Holdings
- 11.2.11.1. Overview
- 11.2.11.2. Products
- 11.2.11.3. SWOT Analysis
- 11.2.11.4. Recent Developments
- 11.2.11.5. Financials (Based on Availability)
- 11.2.12 Hokkan Holdings
- 11.2.12.1. Overview
- 11.2.12.2. Products
- 11.2.12.3. SWOT Analysis
- 11.2.12.4. Recent Developments
- 11.2.12.5. Financials (Based on Availability)
- 11.2.13 Showa Aluminum Can Corporation
- 11.2.13.1. Overview
- 11.2.13.2. Products
- 11.2.13.3. SWOT Analysis
- 11.2.13.4. Recent Developments
- 11.2.13.5. Financials (Based on Availability)
- 11.2.14 United Can (Great China Metal)
- 11.2.14.1. Overview
- 11.2.14.2. Products
- 11.2.14.3. SWOT Analysis
- 11.2.14.4. Recent Developments
- 11.2.14.5. Financials (Based on Availability)
- 11.2.15 Kingcan Holdings
- 11.2.15.1. Overview
- 11.2.15.2. Products
- 11.2.15.3. SWOT Analysis
- 11.2.15.4. Recent Developments
- 11.2.15.5. Financials (Based on Availability)
- 11.2.16 Jiamei Food Packaging
- 11.2.16.1. Overview
- 11.2.16.2. Products
- 11.2.16.3. SWOT Analysis
- 11.2.16.4. Recent Developments
- 11.2.16.5. Financials (Based on Availability)
- 11.2.17 Jiyuan Packaging Holdings
- 11.2.17.1. Overview
- 11.2.17.2. Products
- 11.2.17.3. SWOT Analysis
- 11.2.17.4. Recent Developments
- 11.2.17.5. Financials (Based on Availability)
- 11.2.1 Ball Corporation
List of Figures
- Figure 1: Global 2 Piece Aluminum Can Revenue Breakdown (million, %) by Region 2024 & 2032
- Figure 2: Global 2 Piece Aluminum Can Volume Breakdown (K, %) by Region 2024 & 2032
- Figure 3: North America 2 Piece Aluminum Can Revenue (million), by Application 2024 & 2032
- Figure 4: North America 2 Piece Aluminum Can Volume (K), by Application 2024 & 2032
- Figure 5: North America 2 Piece Aluminum Can Revenue Share (%), by Application 2024 & 2032
- Figure 6: North America 2 Piece Aluminum Can Volume Share (%), by Application 2024 & 2032
- Figure 7: North America 2 Piece Aluminum Can Revenue (million), by Types 2024 & 2032
- Figure 8: North America 2 Piece Aluminum Can Volume (K), by Types 2024 & 2032
- Figure 9: North America 2 Piece Aluminum Can Revenue Share (%), by Types 2024 & 2032
- Figure 10: North America 2 Piece Aluminum Can Volume Share (%), by Types 2024 & 2032
- Figure 11: North America 2 Piece Aluminum Can Revenue (million), by Country 2024 & 2032
- Figure 12: North America 2 Piece Aluminum Can Volume (K), by Country 2024 & 2032
- Figure 13: North America 2 Piece Aluminum Can Revenue Share (%), by Country 2024 & 2032
- Figure 14: North America 2 Piece Aluminum Can Volume Share (%), by Country 2024 & 2032
- Figure 15: South America 2 Piece Aluminum Can Revenue (million), by Application 2024 & 2032
- Figure 16: South America 2 Piece Aluminum Can Volume (K), by Application 2024 & 2032
- Figure 17: South America 2 Piece Aluminum Can Revenue Share (%), by Application 2024 & 2032
- Figure 18: South America 2 Piece Aluminum Can Volume Share (%), by Application 2024 & 2032
- Figure 19: South America 2 Piece Aluminum Can Revenue (million), by Types 2024 & 2032
- Figure 20: South America 2 Piece Aluminum Can Volume (K), by Types 2024 & 2032
- Figure 21: South America 2 Piece Aluminum Can Revenue Share (%), by Types 2024 & 2032
- Figure 22: South America 2 Piece Aluminum Can Volume Share (%), by Types 2024 & 2032
- Figure 23: South America 2 Piece Aluminum Can Revenue (million), by Country 2024 & 2032
- Figure 24: South America 2 Piece Aluminum Can Volume (K), by Country 2024 & 2032
- Figure 25: South America 2 Piece Aluminum Can Revenue Share (%), by Country 2024 & 2032
- Figure 26: South America 2 Piece Aluminum Can Volume Share (%), by Country 2024 & 2032
- Figure 27: Europe 2 Piece Aluminum Can Revenue (million), by Application 2024 & 2032
- Figure 28: Europe 2 Piece Aluminum Can Volume (K), by Application 2024 & 2032
- Figure 29: Europe 2 Piece Aluminum Can Revenue Share (%), by Application 2024 & 2032
- Figure 30: Europe 2 Piece Aluminum Can Volume Share (%), by Application 2024 & 2032
- Figure 31: Europe 2 Piece Aluminum Can Revenue (million), by Types 2024 & 2032
- Figure 32: Europe 2 Piece Aluminum Can Volume (K), by Types 2024 & 2032
- Figure 33: Europe 2 Piece Aluminum Can Revenue Share (%), by Types 2024 & 2032
- Figure 34: Europe 2 Piece Aluminum Can Volume Share (%), by Types 2024 & 2032
- Figure 35: Europe 2 Piece Aluminum Can Revenue (million), by Country 2024 & 2032
- Figure 36: Europe 2 Piece Aluminum Can Volume (K), by Country 2024 & 2032
- Figure 37: Europe 2 Piece Aluminum Can Revenue Share (%), by Country 2024 & 2032
- Figure 38: Europe 2 Piece Aluminum Can Volume Share (%), by Country 2024 & 2032
- Figure 39: Middle East & Africa 2 Piece Aluminum Can Revenue (million), by Application 2024 & 2032
- Figure 40: Middle East & Africa 2 Piece Aluminum Can Volume (K), by Application 2024 & 2032
- Figure 41: Middle East & Africa 2 Piece Aluminum Can Revenue Share (%), by Application 2024 & 2032
- Figure 42: Middle East & Africa 2 Piece Aluminum Can Volume Share (%), by Application 2024 & 2032
- Figure 43: Middle East & Africa 2 Piece Aluminum Can Revenue (million), by Types 2024 & 2032
- Figure 44: Middle East & Africa 2 Piece Aluminum Can Volume (K), by Types 2024 & 2032
- Figure 45: Middle East & Africa 2 Piece Aluminum Can Revenue Share (%), by Types 2024 & 2032
- Figure 46: Middle East & Africa 2 Piece Aluminum Can Volume Share (%), by Types 2024 & 2032
- Figure 47: Middle East & Africa 2 Piece Aluminum Can Revenue (million), by Country 2024 & 2032
- Figure 48: Middle East & Africa 2 Piece Aluminum Can Volume (K), by Country 2024 & 2032
- Figure 49: Middle East & Africa 2 Piece Aluminum Can Revenue Share (%), by Country 2024 & 2032
- Figure 50: Middle East & Africa 2 Piece Aluminum Can Volume Share (%), by Country 2024 & 2032
- Figure 51: Asia Pacific 2 Piece Aluminum Can Revenue (million), by Application 2024 & 2032
- Figure 52: Asia Pacific 2 Piece Aluminum Can Volume (K), by Application 2024 & 2032
- Figure 53: Asia Pacific 2 Piece Aluminum Can Revenue Share (%), by Application 2024 & 2032
- Figure 54: Asia Pacific 2 Piece Aluminum Can Volume Share (%), by Application 2024 & 2032
- Figure 55: Asia Pacific 2 Piece Aluminum Can Revenue (million), by Types 2024 & 2032
- Figure 56: Asia Pacific 2 Piece Aluminum Can Volume (K), by Types 2024 & 2032
- Figure 57: Asia Pacific 2 Piece Aluminum Can Revenue Share (%), by Types 2024 & 2032
- Figure 58: Asia Pacific 2 Piece Aluminum Can Volume Share (%), by Types 2024 & 2032
- Figure 59: Asia Pacific 2 Piece Aluminum Can Revenue (million), by Country 2024 & 2032
- Figure 60: Asia Pacific 2 Piece Aluminum Can Volume (K), by Country 2024 & 2032
- Figure 61: Asia Pacific 2 Piece Aluminum Can Revenue Share (%), by Country 2024 & 2032
- Figure 62: Asia Pacific 2 Piece Aluminum Can Volume Share (%), by Country 2024 & 2032
List of Tables
- Table 1: Global 2 Piece Aluminum Can Revenue million Forecast, by Region 2019 & 2032
- Table 2: Global 2 Piece Aluminum Can Volume K Forecast, by Region 2019 & 2032
- Table 3: Global 2 Piece Aluminum Can Revenue million Forecast, by Application 2019 & 2032
- Table 4: Global 2 Piece Aluminum Can Volume K Forecast, by Application 2019 & 2032
- Table 5: Global 2 Piece Aluminum Can Revenue million Forecast, by Types 2019 & 2032
- Table 6: Global 2 Piece Aluminum Can Volume K Forecast, by Types 2019 & 2032
- Table 7: Global 2 Piece Aluminum Can Revenue million Forecast, by Region 2019 & 2032
- Table 8: Global 2 Piece Aluminum Can Volume K Forecast, by Region 2019 & 2032
- Table 9: Global 2 Piece Aluminum Can Revenue million Forecast, by Application 2019 & 2032
- Table 10: Global 2 Piece Aluminum Can Volume K Forecast, by Application 2019 & 2032
- Table 11: Global 2 Piece Aluminum Can Revenue million Forecast, by Types 2019 & 2032
- Table 12: Global 2 Piece Aluminum Can Volume K Forecast, by Types 2019 & 2032
- Table 13: Global 2 Piece Aluminum Can Revenue million Forecast, by Country 2019 & 2032
- Table 14: Global 2 Piece Aluminum Can Volume K Forecast, by Country 2019 & 2032
- Table 15: United States 2 Piece Aluminum Can Revenue (million) Forecast, by Application 2019 & 2032
- Table 16: United States 2 Piece Aluminum Can Volume (K) Forecast, by Application 2019 & 2032
- Table 17: Canada 2 Piece Aluminum Can Revenue (million) Forecast, by Application 2019 & 2032
- Table 18: Canada 2 Piece Aluminum Can Volume (K) Forecast, by Application 2019 & 2032
- Table 19: Mexico 2 Piece Aluminum Can Revenue (million) Forecast, by Application 2019 & 2032
- Table 20: Mexico 2 Piece Aluminum Can Volume (K) Forecast, by Application 2019 & 2032
- Table 21: Global 2 Piece Aluminum Can Revenue million Forecast, by Application 2019 & 2032
- Table 22: Global 2 Piece Aluminum Can Volume K Forecast, by Application 2019 & 2032
- Table 23: Global 2 Piece Aluminum Can Revenue million Forecast, by Types 2019 & 2032
- Table 24: Global 2 Piece Aluminum Can Volume K Forecast, by Types 2019 & 2032
- Table 25: Global 2 Piece Aluminum Can Revenue million Forecast, by Country 2019 & 2032
- Table 26: Global 2 Piece Aluminum Can Volume K Forecast, by Country 2019 & 2032
- Table 27: Brazil 2 Piece Aluminum Can Revenue (million) Forecast, by Application 2019 & 2032
- Table 28: Brazil 2 Piece Aluminum Can Volume (K) Forecast, by Application 2019 & 2032
- Table 29: Argentina 2 Piece Aluminum Can Revenue (million) Forecast, by Application 2019 & 2032
- Table 30: Argentina 2 Piece Aluminum Can Volume (K) Forecast, by Application 2019 & 2032
- Table 31: Rest of South America 2 Piece Aluminum Can Revenue (million) Forecast, by Application 2019 & 2032
- Table 32: Rest of South America 2 Piece Aluminum Can Volume (K) Forecast, by Application 2019 & 2032
- Table 33: Global 2 Piece Aluminum Can Revenue million Forecast, by Application 2019 & 2032
- Table 34: Global 2 Piece Aluminum Can Volume K Forecast, by Application 2019 & 2032
- Table 35: Global 2 Piece Aluminum Can Revenue million Forecast, by Types 2019 & 2032
- Table 36: Global 2 Piece Aluminum Can Volume K Forecast, by Types 2019 & 2032
- Table 37: Global 2 Piece Aluminum Can Revenue million Forecast, by Country 2019 & 2032
- Table 38: Global 2 Piece Aluminum Can Volume K Forecast, by Country 2019 & 2032
- Table 39: United Kingdom 2 Piece Aluminum Can Revenue (million) Forecast, by Application 2019 & 2032
- Table 40: United Kingdom 2 Piece Aluminum Can Volume (K) Forecast, by Application 2019 & 2032
- Table 41: Germany 2 Piece Aluminum Can Revenue (million) Forecast, by Application 2019 & 2032
- Table 42: Germany 2 Piece Aluminum Can Volume (K) Forecast, by Application 2019 & 2032
- Table 43: France 2 Piece Aluminum Can Revenue (million) Forecast, by Application 2019 & 2032
- Table 44: France 2 Piece Aluminum Can Volume (K) Forecast, by Application 2019 & 2032
- Table 45: Italy 2 Piece Aluminum Can Revenue (million) Forecast, by Application 2019 & 2032
- Table 46: Italy 2 Piece Aluminum Can Volume (K) Forecast, by Application 2019 & 2032
- Table 47: Spain 2 Piece Aluminum Can Revenue (million) Forecast, by Application 2019 & 2032
- Table 48: Spain 2 Piece Aluminum Can Volume (K) Forecast, by Application 2019 & 2032
- Table 49: Russia 2 Piece Aluminum Can Revenue (million) Forecast, by Application 2019 & 2032
- Table 50: Russia 2 Piece Aluminum Can Volume (K) Forecast, by Application 2019 & 2032
- Table 51: Benelux 2 Piece Aluminum Can Revenue (million) Forecast, by Application 2019 & 2032
- Table 52: Benelux 2 Piece Aluminum Can Volume (K) Forecast, by Application 2019 & 2032
- Table 53: Nordics 2 Piece Aluminum Can Revenue (million) Forecast, by Application 2019 & 2032
- Table 54: Nordics 2 Piece Aluminum Can Volume (K) Forecast, by Application 2019 & 2032
- Table 55: Rest of Europe 2 Piece Aluminum Can Revenue (million) Forecast, by Application 2019 & 2032
- Table 56: Rest of Europe 2 Piece Aluminum Can Volume (K) Forecast, by Application 2019 & 2032
- Table 57: Global 2 Piece Aluminum Can Revenue million Forecast, by Application 2019 & 2032
- Table 58: Global 2 Piece Aluminum Can Volume K Forecast, by Application 2019 & 2032
- Table 59: Global 2 Piece Aluminum Can Revenue million Forecast, by Types 2019 & 2032
- Table 60: Global 2 Piece Aluminum Can Volume K Forecast, by Types 2019 & 2032
- Table 61: Global 2 Piece Aluminum Can Revenue million Forecast, by Country 2019 & 2032
- Table 62: Global 2 Piece Aluminum Can Volume K Forecast, by Country 2019 & 2032
- Table 63: Turkey 2 Piece Aluminum Can Revenue (million) Forecast, by Application 2019 & 2032
- Table 64: Turkey 2 Piece Aluminum Can Volume (K) Forecast, by Application 2019 & 2032
- Table 65: Israel 2 Piece Aluminum Can Revenue (million) Forecast, by Application 2019 & 2032
- Table 66: Israel 2 Piece Aluminum Can Volume (K) Forecast, by Application 2019 & 2032
- Table 67: GCC 2 Piece Aluminum Can Revenue (million) Forecast, by Application 2019 & 2032
- Table 68: GCC 2 Piece Aluminum Can Volume (K) Forecast, by Application 2019 & 2032
- Table 69: North Africa 2 Piece Aluminum Can Revenue (million) Forecast, by Application 2019 & 2032
- Table 70: North Africa 2 Piece Aluminum Can Volume (K) Forecast, by Application 2019 & 2032
- Table 71: South Africa 2 Piece Aluminum Can Revenue (million) Forecast, by Application 2019 & 2032
- Table 72: South Africa 2 Piece Aluminum Can Volume (K) Forecast, by Application 2019 & 2032
- Table 73: Rest of Middle East & Africa 2 Piece Aluminum Can Revenue (million) Forecast, by Application 2019 & 2032
- Table 74: Rest of Middle East & Africa 2 Piece Aluminum Can Volume (K) Forecast, by Application 2019 & 2032
- Table 75: Global 2 Piece Aluminum Can Revenue million Forecast, by Application 2019 & 2032
- Table 76: Global 2 Piece Aluminum Can Volume K Forecast, by Application 2019 & 2032
- Table 77: Global 2 Piece Aluminum Can Revenue million Forecast, by Types 2019 & 2032
- Table 78: Global 2 Piece Aluminum Can Volume K Forecast, by Types 2019 & 2032
- Table 79: Global 2 Piece Aluminum Can Revenue million Forecast, by Country 2019 & 2032
- Table 80: Global 2 Piece Aluminum Can Volume K Forecast, by Country 2019 & 2032
- Table 81: China 2 Piece Aluminum Can Revenue (million) Forecast, by Application 2019 & 2032
- Table 82: China 2 Piece Aluminum Can Volume (K) Forecast, by Application 2019 & 2032
- Table 83: India 2 Piece Aluminum Can Revenue (million) Forecast, by Application 2019 & 2032
- Table 84: India 2 Piece Aluminum Can Volume (K) Forecast, by Application 2019 & 2032
- Table 85: Japan 2 Piece Aluminum Can Revenue (million) Forecast, by Application 2019 & 2032
- Table 86: Japan 2 Piece Aluminum Can Volume (K) Forecast, by Application 2019 & 2032
- Table 87: South Korea 2 Piece Aluminum Can Revenue (million) Forecast, by Application 2019 & 2032
- Table 88: South Korea 2 Piece Aluminum Can Volume (K) Forecast, by Application 2019 & 2032
- Table 89: ASEAN 2 Piece Aluminum Can Revenue (million) Forecast, by Application 2019 & 2032
- Table 90: ASEAN 2 Piece Aluminum Can Volume (K) Forecast, by Application 2019 & 2032
- Table 91: Oceania 2 Piece Aluminum Can Revenue (million) Forecast, by Application 2019 & 2032
- Table 92: Oceania 2 Piece Aluminum Can Volume (K) Forecast, by Application 2019 & 2032
- Table 93: Rest of Asia Pacific 2 Piece Aluminum Can Revenue (million) Forecast, by Application 2019 & 2032
- Table 94: Rest of Asia Pacific 2 Piece Aluminum Can Volume (K) Forecast, by Application 2019 & 2032
Frequently Asked Questions
1. What is the projected Compound Annual Growth Rate (CAGR) of the 2 Piece Aluminum Can?
The projected CAGR is approximately 2.9%.
2. Which companies are prominent players in the 2 Piece Aluminum Can?
Key companies in the market include Ball Corporation, Crown Holdings, Ardagh group, Toyo Seikan, Can Pack Group, Silgan Holdings Inc, Daiwa Can Company, Baosteel Packaging, ORG Technology, ShengXing Group, CPMC Holdings, Hokkan Holdings, Showa Aluminum Can Corporation, United Can (Great China Metal), Kingcan Holdings, Jiamei Food Packaging, Jiyuan Packaging Holdings.
3. What are the main segments of the 2 Piece Aluminum Can?
The market segments include Application, Types.
4. Can you provide details about the market size?
The market size is estimated to be USD 34320 million as of 2022.
5. What are some drivers contributing to market growth?
N/A
6. What are the notable trends driving market growth?
N/A
7. Are there any restraints impacting market growth?
N/A
8. Can you provide examples of recent developments in the market?
N/A
9. What pricing options are available for accessing the report?
Pricing options include single-user, multi-user, and enterprise licenses priced at USD 3950.00, USD 5925.00, and USD 7900.00 respectively.
10. Is the market size provided in terms of value or volume?
The market size is provided in terms of value, measured in million and volume, measured in K.
11. Are there any specific market keywords associated with the report?
Yes, the market keyword associated with the report is "2 Piece Aluminum Can," which aids in identifying and referencing the specific market segment covered.
12. How do I determine which pricing option suits my needs best?
The pricing options vary based on user requirements and access needs. Individual users may opt for single-user licenses, while businesses requiring broader access may choose multi-user or enterprise licenses for cost-effective access to the report.
13. Are there any additional resources or data provided in the 2 Piece Aluminum Can report?
While the report offers comprehensive insights, it's advisable to review the specific contents or supplementary materials provided to ascertain if additional resources or data are available.
14. How can I stay updated on further developments or reports in the 2 Piece Aluminum Can?
To stay informed about further developments, trends, and reports in the 2 Piece Aluminum Can, consider subscribing to industry newsletters, following relevant companies and organizations, or regularly checking reputable industry news sources and publications.
Methodology
Step 1 - Identification of Relevant Samples Size from Population Database


Step 2 - Approaches for Defining Global Market Size (Value, Volume* & Price*)

Note*: In applicable scenarios
Step 3 - Data Sources
Primary Research
- Web Analytics
- Survey Reports
- Research Institute
- Latest Research Reports
- Opinion Leaders
Secondary Research
- Annual Reports
- White Paper
- Latest Press Release
- Industry Association
- Paid Database
- Investor Presentations

Step 4 - Data Triangulation
Involves using different sources of information in order to increase the validity of a study
These sources are likely to be stakeholders in a program - participants, other researchers, program staff, other community members, and so on.
Then we put all data in single framework & apply various statistical tools to find out the dynamic on the market.
During the analysis stage, feedback from the stakeholder groups would be compared to determine areas of agreement as well as areas of divergence


