Yams Market Trends and Opportunities for Growth

Yams Market by Production Analysis, by Consumption Analysis, by Import Market Analysis (Value & Volume), by Export Market Analysis (Value & Volume), by Price Trend Analysis, by North America (United States, Canada, Mexico, Rest of North America), by Europe (Germany, United Kingdom, France, Russia, Spain, Rest of Europe), by Asia Pacific (India, China, Japan, Rest of Asia Pacific), by South America (Brazil, Argentina, Rest of South America), by Middle East and Africa (Nigeria, Ghana, Rest of Middle East and Africa) Forecast 2025-2033

Jul 3 2025
Base Year: 2024

180 Pages
Main Logo

Yams Market Trends and Opportunities for Growth


Home
Industries
Agriculture
sponsor image

Tailored for you

  • In-depth Analysis Tailored to Specified Regions or Segments
  • Company Profiles Customized to User Preferences
  • Comprehensive Insights Focused on Specific Segments or Regions
  • Customized Evaluation of Competitive Landscape to Meet Your Needs
  • Tailored Customization to Address Other Specific Requirements
Ask for customization


Key Insights

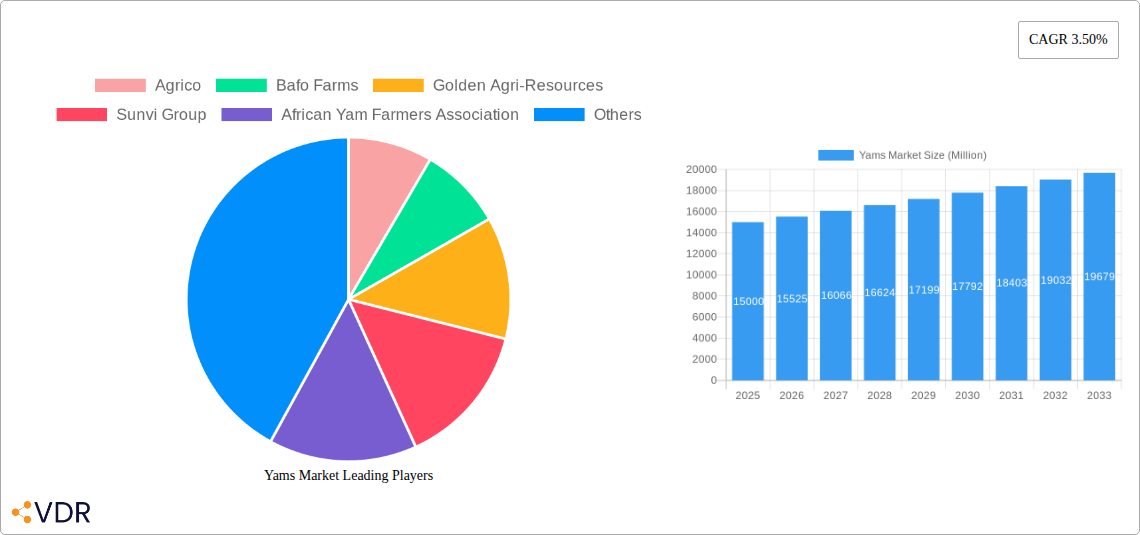
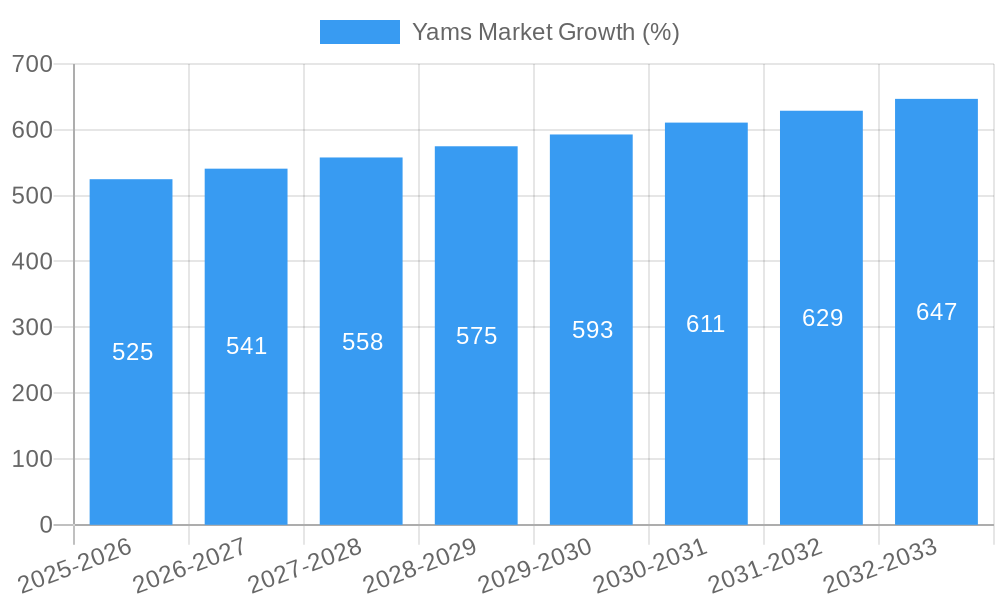
The global yam market, valued at $15 billion in 2025, is projected to experience steady growth, driven by increasing consumer demand for nutritious and versatile food sources. A compound annual growth rate (CAGR) of 3.5% is anticipated from 2025 to 2033, indicating a significant expansion in market size over the forecast period. This growth is fueled by several factors. Rising health consciousness is boosting the consumption of yams, known for their rich vitamin and mineral content. The increasing popularity of yam-based processed foods and beverages, along with its use in the pharmaceutical industry (e.g., as a source of dietary fiber and bioactive compounds) contributes to market expansion. Furthermore, advancements in yam cultivation techniques and increased yields are enhancing supply and accessibility, thereby supporting market growth. However, challenges remain, including susceptibility to pests and diseases, fluctuating yields due to weather patterns, and limitations in post-harvest handling and storage infrastructure in some regions. The market is segmented by yam variety (white, yellow, purple) and end-use (food, beverage, pharmaceutical), with the food segment currently dominating due to the widespread use of yams in various culinary preparations across different cultures. Major players like Agrico, Bafo Farms, Golden Agri-Resources, and Sunvi Group are actively shaping market dynamics through innovation and expansion. Regional market share will vary, with regions like Asia-Pacific and Africa potentially holding significant shares due to the high concentration of yam production and consumption in these areas.

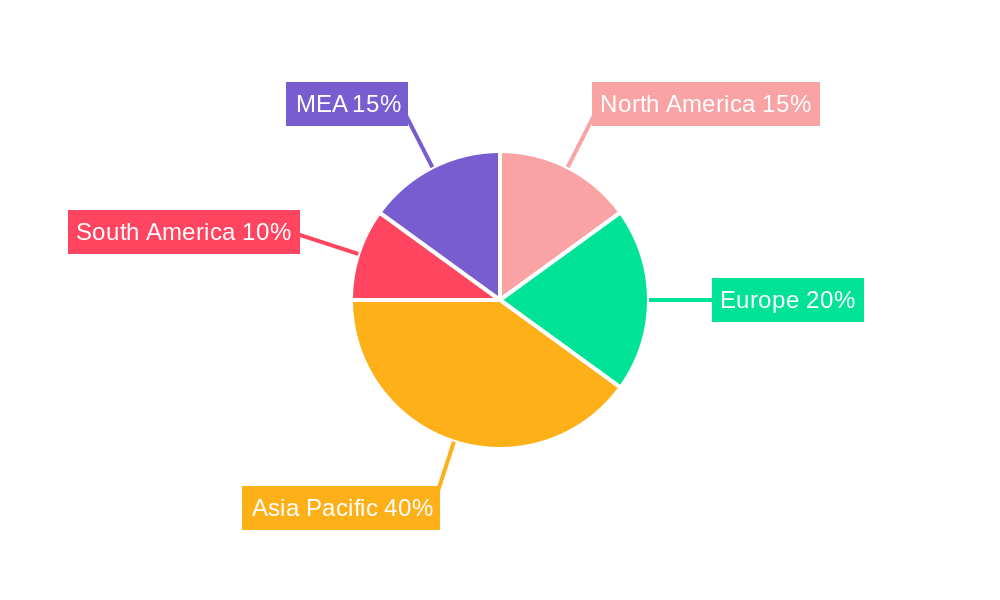
The geographical distribution of the yam market is diverse, with strong growth expected across various regions. North America and Europe are anticipated to witness steady growth driven by increasing awareness of yams' nutritional benefits and their incorporation into diverse culinary trends. The Asia-Pacific region, a significant yam-producing area, will likely show robust growth, driven by increasing demand in major economies like China and India. South America, while also a producer, might experience moderate growth, influenced by local consumption patterns and export potential. The Middle East and Africa regions could see substantial growth, reflecting both production and consumption within these areas, particularly if improved post-harvest handling methods are successfully implemented to reduce waste. The market's future is promising, but success will depend on mitigating the challenges of disease resistance, improving supply chain infrastructure, and promoting sustainable cultivation practices to ensure consistent yield and access for consumers globally.

Yams Market Research Report - Market Size, Growth & Forecast

Comprehensive Yams Market Report: 2019-2033

This in-depth report provides a comprehensive analysis of the global yams market, encompassing historical data (2019-2024), current estimations (2025), and future projections (2025-2033). The study delves into market dynamics, growth trends, regional dominance, product landscapes, and key players, offering invaluable insights for industry professionals, investors, and stakeholders. This report covers the parent market of root vegetables and the child market of yams, offering a granular view of this dynamic sector. The total market value in 2025 is estimated at XX Million.

Yams Market Dynamics & Structure

The global yams market is characterized by a moderately fragmented landscape with both large-scale producers and smallholder farmers contributing significantly to the overall supply. Market concentration is relatively low, with no single dominant player commanding a significant share. Technological innovations, particularly in cultivation techniques (e.g., trellised planting, aerial farming) and post-harvest handling, are gradually improving yields and reducing losses. Regulatory frameworks vary across regions, influencing production practices and trade flows. Competition from other staple crops, such as potatoes and cassava, poses a considerable challenge. The end-user demographic is broad, encompassing diverse consumer segments with varying preferences for yam varieties and end-uses. Mergers and acquisitions (M&A) activity within the sector remains relatively limited, with most growth driven by organic expansion.

  • Market Concentration: Low, with no dominant player. Market share of top 5 players: xx%
  • Technological Innovation: Focus on improved cultivation techniques and post-harvest processing.
  • Regulatory Frameworks: Vary considerably across regions; impacting trade and production.
  • Competitive Substitutes: Potatoes, cassava, and other root vegetables.
  • End-User Demographics: Diverse consumer segments with varying preferences.
  • M&A Activity: Limited, with organic growth as the primary driver. Estimated M&A deal volume (2019-2024): xx deals.

Yams Market Growth Trends & Insights

The global yams market has experienced steady growth during the historical period (2019-2024), driven by increasing consumer demand, particularly in developing economies. Adoption rates are high in regions with favorable climatic conditions and established cultivation practices. Technological disruptions, such as improved storage and preservation techniques, have minimized post-harvest losses and extended the shelf life of yams. Consumer behavior shifts toward healthier and more nutritious food options further bolster market growth. The CAGR for the historical period (2019-2024) is estimated at xx%, with the market expected to reach XX Million in 2025. The projected CAGR for the forecast period (2025-2033) is xx%. Market penetration remains relatively high in major yam-producing regions, with significant growth potential in untapped markets.

Yams Market Growth

Dominant Regions, Countries, or Segments in Yams Market

Africa and Asia are the dominant regions in the global yams market, with Nigeria, Ghana, and Côte d'Ivoire as leading producers. Within yam varieties, white yams hold the largest market share due to their wide adaptability and culinary versatility. The food industry remains the dominant end-use segment, but the pharmaceutical and beverage industries are showing increasing interest in yam-based products due to their nutritional and medicinal properties.

  • Key Drivers (Africa): Favorable climate, established cultivation practices, strong local demand.
  • Key Drivers (Asia): Increasing population, rising disposable incomes, growing awareness of nutritional benefits.
  • Key Drivers (White Yams): Versatility, adaptability to various climates, high yield.
  • Key Drivers (Food Industry): High consumer demand, established supply chains.
  • Growth Potential: Untapped markets in South America and Oceania offer significant growth opportunities.

Yams Market Product Landscape

The yams market offers a variety of products, including fresh yams, processed yam flour, yam chips, and yam-based beverages. Recent innovations focus on improving the shelf life and enhancing the nutritional value of yam products. Technological advancements in processing and packaging have broadened the range of available yam products.

Key Drivers, Barriers & Challenges in Yams Market

Key Drivers:

  • Increasing demand for nutritious and affordable food sources.
  • Growing awareness of yam's health benefits.
  • Technological advancements in cultivation and processing.
  • Government support for yam farming in several countries.

Challenges:

  • Post-harvest losses due to poor storage facilities (estimated at xx% annually).
  • Climate change impacting yields and production in several regions.
  • Limited access to modern farming techniques among smallholder farmers.
  • Fluctuations in global yam prices affecting farmer profitability.

Emerging Opportunities in Yams Market

  • Growing demand for functional foods and health supplements based on yam.
  • Development of value-added yam products (e.g., yam-based snacks, frozen yam products).
  • Expansion into new markets with increasing demand for nutritious foods.
  • Development of sustainable and climate-resilient yam production systems.

Growth Accelerators in the Yams Market Industry

Technological advancements in agricultural practices, coupled with strategic partnerships between farmers, processors, and retailers, are creating numerous opportunities for growth. The expansion of yam cultivation into new regions, alongside targeted marketing campaigns that highlight the nutritional benefits of yams, will further fuel market expansion.

Key Players Shaping the Yams Market Market

  • Agrico
  • Bafo Farms
  • Golden Agri-Resources
  • Sunvi Group
  • African Yam Farmers Association

Notable Milestones in Yams Market Sector

  • August 2022: Formation of the Fiji Yam Farmers Association (FYFA), enhancing farmer organization and market access.
  • May 2021: Adoption of advanced farming techniques in Ghana's Bono region, improving competitiveness.
  • April 2021: Shift to aerial yam farming in Kenya's Murang'a county, optimizing water usage and reducing labor costs.

In-Depth Yams Market Market Outlook

The future of the yams market looks promising, driven by continued demand for nutritious foods and ongoing innovation in cultivation and processing technologies. Strategic investments in research and development, along with supportive government policies, will further enhance market growth. Opportunities exist for companies to capitalize on emerging trends, such as the growing demand for functional foods and sustainable farming practices. The market is poised for significant expansion, with substantial growth potential in both established and emerging markets.

Yams Market Segmentation

  • 1. Production Analysis
  • 2. Consumption Analysis
  • 3. Import Market Analysis (Value & Volume)
  • 4. Export Market Analysis (Value & Volume)
  • 5. Price Trend Analysis

Yams Market Segmentation By Geography

  • 1. North America
    • 1.1. United States
    • 1.2. Canada
    • 1.3. Mexico
    • 1.4. Rest of North America
  • 2. Europe
    • 2.1. Germany
    • 2.2. United Kingdom
    • 2.3. France
    • 2.4. Russia
    • 2.5. Spain
    • 2.6. Rest of Europe
  • 3. Asia Pacific
    • 3.1. India
    • 3.2. China
    • 3.3. Japan
    • 3.4. Rest of Asia Pacific
  • 4. South America
    • 4.1. Brazil
    • 4.2. Argentina
    • 4.3. Rest of South America
  • 5. Middle East and Africa
    • 5.1. Nigeria
    • 5.2. Ghana
    • 5.3. Rest of Middle East and Africa
Yams Market Regional Share


Yams Market REPORT HIGHLIGHTS

AspectsDetails
Study Period 2019-2033
Base Year 2024
Estimated Year 2025
Forecast Period2025-2033
Historical Period2019-2024
Growth RateCAGR of 3.50% from 2019-2033
Segmentation
    • By Production Analysis
    • By Consumption Analysis
    • By Import Market Analysis (Value & Volume)
    • By Export Market Analysis (Value & Volume)
    • By Price Trend Analysis
  • By Geography
    • North America
      • United States
      • Canada
      • Mexico
      • Rest of North America
    • Europe
      • Germany
      • United Kingdom
      • France
      • Russia
      • Spain
      • Rest of Europe
    • Asia Pacific
      • India
      • China
      • Japan
      • Rest of Asia Pacific
    • South America
      • Brazil
      • Argentina
      • Rest of South America
    • Middle East and Africa
      • Nigeria
      • Ghana
      • Rest of Middle East and Africa


Table of Contents

  1. 1. Introduction
    • 1.1. Research Scope
    • 1.2. Market Segmentation
    • 1.3. Research Methodology
    • 1.4. Definitions and Assumptions
  2. 2. Executive Summary
    • 2.1. Introduction
  3. 3. Market Dynamics
    • 3.1. Introduction
      • 3.2. Market Drivers
        • 3.2.1. Awareness About Health Benefits Associated With Pecan Consumption; Wide Application of Pecan
      • 3.3. Market Restrains
        • 3.3.1. Volatility in the Prices; Adverse Weather Conditions Affecting Yield
      • 3.4. Market Trends
        • 3.4.1. Rising Health Benefits of Yams across the Globe
  4. 4. Market Factor Analysis
    • 4.1. Porters Five Forces
    • 4.2. Supply/Value Chain
    • 4.3. PESTEL analysis
    • 4.4. Market Entropy
    • 4.5. Patent/Trademark Analysis
  5. 5. Global Yams Market Analysis, Insights and Forecast, 2019-2031
    • 5.1. Market Analysis, Insights and Forecast - by Production Analysis
      • 5.2. Market Analysis, Insights and Forecast - by Consumption Analysis
        • 5.3. Market Analysis, Insights and Forecast - by Import Market Analysis (Value & Volume)
          • 5.4. Market Analysis, Insights and Forecast - by Export Market Analysis (Value & Volume)
            • 5.5. Market Analysis, Insights and Forecast - by Price Trend Analysis
              • 5.6. Market Analysis, Insights and Forecast - by Region
                • 5.6.1. North America
                • 5.6.2. Europe
                • 5.6.3. Asia Pacific
                • 5.6.4. South America
                • 5.6.5. Middle East and Africa
            • 6. North America Yams Market Analysis, Insights and Forecast, 2019-2031
              • 6.1. Market Analysis, Insights and Forecast - by Production Analysis
                • 6.2. Market Analysis, Insights and Forecast - by Consumption Analysis
                  • 6.3. Market Analysis, Insights and Forecast - by Import Market Analysis (Value & Volume)
                    • 6.4. Market Analysis, Insights and Forecast - by Export Market Analysis (Value & Volume)
                      • 6.5. Market Analysis, Insights and Forecast - by Price Trend Analysis
                      • 7. Europe Yams Market Analysis, Insights and Forecast, 2019-2031
                        • 7.1. Market Analysis, Insights and Forecast - by Production Analysis
                          • 7.2. Market Analysis, Insights and Forecast - by Consumption Analysis
                            • 7.3. Market Analysis, Insights and Forecast - by Import Market Analysis (Value & Volume)
                              • 7.4. Market Analysis, Insights and Forecast - by Export Market Analysis (Value & Volume)
                                • 7.5. Market Analysis, Insights and Forecast - by Price Trend Analysis
                                • 8. Asia Pacific Yams Market Analysis, Insights and Forecast, 2019-2031
                                  • 8.1. Market Analysis, Insights and Forecast - by Production Analysis
                                    • 8.2. Market Analysis, Insights and Forecast - by Consumption Analysis
                                      • 8.3. Market Analysis, Insights and Forecast - by Import Market Analysis (Value & Volume)
                                        • 8.4. Market Analysis, Insights and Forecast - by Export Market Analysis (Value & Volume)
                                          • 8.5. Market Analysis, Insights and Forecast - by Price Trend Analysis
                                          • 9. South America Yams Market Analysis, Insights and Forecast, 2019-2031
                                            • 9.1. Market Analysis, Insights and Forecast - by Production Analysis
                                              • 9.2. Market Analysis, Insights and Forecast - by Consumption Analysis
                                                • 9.3. Market Analysis, Insights and Forecast - by Import Market Analysis (Value & Volume)
                                                  • 9.4. Market Analysis, Insights and Forecast - by Export Market Analysis (Value & Volume)
                                                    • 9.5. Market Analysis, Insights and Forecast - by Price Trend Analysis
                                                    • 10. Middle East and Africa Yams Market Analysis, Insights and Forecast, 2019-2031
                                                      • 10.1. Market Analysis, Insights and Forecast - by Production Analysis
                                                        • 10.2. Market Analysis, Insights and Forecast - by Consumption Analysis
                                                          • 10.3. Market Analysis, Insights and Forecast - by Import Market Analysis (Value & Volume)
                                                            • 10.4. Market Analysis, Insights and Forecast - by Export Market Analysis (Value & Volume)
                                                              • 10.5. Market Analysis, Insights and Forecast - by Price Trend Analysis
                                                              • 11. North America Yams Market Analysis, Insights and Forecast, 2019-2031
                                                                  • 11.1. Market Analysis, Insights and Forecast - By Country/Sub-region
                                                                    • 11.1.1 United States
                                                                    • 11.1.2 Canada
                                                                    • 11.1.3 Mexico
                                                              • 12. Europe Yams Market Analysis, Insights and Forecast, 2019-2031
                                                                  • 12.1. Market Analysis, Insights and Forecast - By Country/Sub-region
                                                                    • 12.1.1 Germany
                                                                    • 12.1.2 United Kingdom
                                                                    • 12.1.3 France
                                                                    • 12.1.4 Spain
                                                                    • 12.1.5 Italy
                                                                    • 12.1.6 Spain
                                                                    • 12.1.7 Belgium
                                                                    • 12.1.8 Netherland
                                                                    • 12.1.9 Nordics
                                                                    • 12.1.10 Rest of Europe
                                                              • 13. Asia Pacific Yams Market Analysis, Insights and Forecast, 2019-2031
                                                                  • 13.1. Market Analysis, Insights and Forecast - By Country/Sub-region
                                                                    • 13.1.1 China
                                                                    • 13.1.2 Japan
                                                                    • 13.1.3 India
                                                                    • 13.1.4 South Korea
                                                                    • 13.1.5 Southeast Asia
                                                                    • 13.1.6 Australia
                                                                    • 13.1.7 Indonesia
                                                                    • 13.1.8 Phillipes
                                                                    • 13.1.9 Singapore
                                                                    • 13.1.10 Thailandc
                                                                    • 13.1.11 Rest of Asia Pacific
                                                              • 14. South America Yams Market Analysis, Insights and Forecast, 2019-2031
                                                                  • 14.1. Market Analysis, Insights and Forecast - By Country/Sub-region
                                                                    • 14.1.1 Brazil
                                                                    • 14.1.2 Argentina
                                                                    • 14.1.3 Peru
                                                                    • 14.1.4 Chile
                                                                    • 14.1.5 Colombia
                                                                    • 14.1.6 Ecuador
                                                                    • 14.1.7 Venezuela
                                                                    • 14.1.8 Rest of South America
                                                              • 15. North America Yams Market Analysis, Insights and Forecast, 2019-2031
                                                                  • 15.1. Market Analysis, Insights and Forecast - By Country/Sub-region
                                                                    • 15.1.1 United States
                                                                    • 15.1.2 Canada
                                                                    • 15.1.3 Mexico
                                                              • 16. MEA Yams Market Analysis, Insights and Forecast, 2019-2031
                                                                  • 16.1. Market Analysis, Insights and Forecast - By Country/Sub-region
                                                                    • 16.1.1 United Arab Emirates
                                                                    • 16.1.2 Saudi Arabia
                                                                    • 16.1.3 South Africa
                                                                    • 16.1.4 Rest of Middle East and Africa
                                                              • 17. Competitive Analysis
                                                                • 17.1. Global Market Share Analysis 2024
                                                                  • 17.2. Company Profiles
                                                                    • 17.2.1 Agrico
                                                                      • 17.2.1.1. Overview
                                                                      • 17.2.1.2. Products
                                                                      • 17.2.1.3. SWOT Analysis
                                                                      • 17.2.1.4. Recent Developments
                                                                      • 17.2.1.5. Financials (Based on Availability)
                                                                    • 17.2.2 Bafo Farms
                                                                      • 17.2.2.1. Overview
                                                                      • 17.2.2.2. Products
                                                                      • 17.2.2.3. SWOT Analysis
                                                                      • 17.2.2.4. Recent Developments
                                                                      • 17.2.2.5. Financials (Based on Availability)
                                                                    • 17.2.3 Golden Agri-Resources
                                                                      • 17.2.3.1. Overview
                                                                      • 17.2.3.2. Products
                                                                      • 17.2.3.3. SWOT Analysis
                                                                      • 17.2.3.4. Recent Developments
                                                                      • 17.2.3.5. Financials (Based on Availability)
                                                                    • 17.2.4 Sunvi Group
                                                                      • 17.2.4.1. Overview
                                                                      • 17.2.4.2. Products
                                                                      • 17.2.4.3. SWOT Analysis
                                                                      • 17.2.4.4. Recent Developments
                                                                      • 17.2.4.5. Financials (Based on Availability)
                                                                    • 17.2.5 African Yam Farmers Association
                                                                      • 17.2.5.1. Overview
                                                                      • 17.2.5.2. Products
                                                                      • 17.2.5.3. SWOT Analysis
                                                                      • 17.2.5.4. Recent Developments
                                                                      • 17.2.5.5. Financials (Based on Availability)

                                                              List of Figures

                                                              1. Figure 1: Global Yams Market Revenue Breakdown (Million, %) by Region 2024 & 2032
                                                              2. Figure 2: Global Yams Market Volume Breakdown (Kiloton, %) by Region 2024 & 2032
                                                              3. Figure 3: North America Yams Market Revenue (Million), by Country 2024 & 2032
                                                              4. Figure 4: North America Yams Market Volume (Kiloton), by Country 2024 & 2032
                                                              5. Figure 5: North America Yams Market Revenue Share (%), by Country 2024 & 2032
                                                              6. Figure 6: North America Yams Market Volume Share (%), by Country 2024 & 2032
                                                              7. Figure 7: Europe Yams Market Revenue (Million), by Country 2024 & 2032
                                                              8. Figure 8: Europe Yams Market Volume (Kiloton), by Country 2024 & 2032
                                                              9. Figure 9: Europe Yams Market Revenue Share (%), by Country 2024 & 2032
                                                              10. Figure 10: Europe Yams Market Volume Share (%), by Country 2024 & 2032
                                                              11. Figure 11: Asia Pacific Yams Market Revenue (Million), by Country 2024 & 2032
                                                              12. Figure 12: Asia Pacific Yams Market Volume (Kiloton), by Country 2024 & 2032
                                                              13. Figure 13: Asia Pacific Yams Market Revenue Share (%), by Country 2024 & 2032
                                                              14. Figure 14: Asia Pacific Yams Market Volume Share (%), by Country 2024 & 2032
                                                              15. Figure 15: South America Yams Market Revenue (Million), by Country 2024 & 2032
                                                              16. Figure 16: South America Yams Market Volume (Kiloton), by Country 2024 & 2032
                                                              17. Figure 17: South America Yams Market Revenue Share (%), by Country 2024 & 2032
                                                              18. Figure 18: South America Yams Market Volume Share (%), by Country 2024 & 2032
                                                              19. Figure 19: North America Yams Market Revenue (Million), by Country 2024 & 2032
                                                              20. Figure 20: North America Yams Market Volume (Kiloton), by Country 2024 & 2032
                                                              21. Figure 21: North America Yams Market Revenue Share (%), by Country 2024 & 2032
                                                              22. Figure 22: North America Yams Market Volume Share (%), by Country 2024 & 2032
                                                              23. Figure 23: MEA Yams Market Revenue (Million), by Country 2024 & 2032
                                                              24. Figure 24: MEA Yams Market Volume (Kiloton), by Country 2024 & 2032
                                                              25. Figure 25: MEA Yams Market Revenue Share (%), by Country 2024 & 2032
                                                              26. Figure 26: MEA Yams Market Volume Share (%), by Country 2024 & 2032
                                                              27. Figure 27: North America Yams Market Revenue (Million), by Production Analysis 2024 & 2032
                                                              28. Figure 28: North America Yams Market Volume (Kiloton), by Production Analysis 2024 & 2032
                                                              29. Figure 29: North America Yams Market Revenue Share (%), by Production Analysis 2024 & 2032
                                                              30. Figure 30: North America Yams Market Volume Share (%), by Production Analysis 2024 & 2032
                                                              31. Figure 31: North America Yams Market Revenue (Million), by Consumption Analysis 2024 & 2032
                                                              32. Figure 32: North America Yams Market Volume (Kiloton), by Consumption Analysis 2024 & 2032
                                                              33. Figure 33: North America Yams Market Revenue Share (%), by Consumption Analysis 2024 & 2032
                                                              34. Figure 34: North America Yams Market Volume Share (%), by Consumption Analysis 2024 & 2032
                                                              35. Figure 35: North America Yams Market Revenue (Million), by Import Market Analysis (Value & Volume) 2024 & 2032
                                                              36. Figure 36: North America Yams Market Volume (Kiloton), by Import Market Analysis (Value & Volume) 2024 & 2032
                                                              37. Figure 37: North America Yams Market Revenue Share (%), by Import Market Analysis (Value & Volume) 2024 & 2032
                                                              38. Figure 38: North America Yams Market Volume Share (%), by Import Market Analysis (Value & Volume) 2024 & 2032
                                                              39. Figure 39: North America Yams Market Revenue (Million), by Export Market Analysis (Value & Volume) 2024 & 2032
                                                              40. Figure 40: North America Yams Market Volume (Kiloton), by Export Market Analysis (Value & Volume) 2024 & 2032
                                                              41. Figure 41: North America Yams Market Revenue Share (%), by Export Market Analysis (Value & Volume) 2024 & 2032
                                                              42. Figure 42: North America Yams Market Volume Share (%), by Export Market Analysis (Value & Volume) 2024 & 2032
                                                              43. Figure 43: North America Yams Market Revenue (Million), by Price Trend Analysis 2024 & 2032
                                                              44. Figure 44: North America Yams Market Volume (Kiloton), by Price Trend Analysis 2024 & 2032
                                                              45. Figure 45: North America Yams Market Revenue Share (%), by Price Trend Analysis 2024 & 2032
                                                              46. Figure 46: North America Yams Market Volume Share (%), by Price Trend Analysis 2024 & 2032
                                                              47. Figure 47: North America Yams Market Revenue (Million), by Country 2024 & 2032
                                                              48. Figure 48: North America Yams Market Volume (Kiloton), by Country 2024 & 2032
                                                              49. Figure 49: North America Yams Market Revenue Share (%), by Country 2024 & 2032
                                                              50. Figure 50: North America Yams Market Volume Share (%), by Country 2024 & 2032
                                                              51. Figure 51: Europe Yams Market Revenue (Million), by Production Analysis 2024 & 2032
                                                              52. Figure 52: Europe Yams Market Volume (Kiloton), by Production Analysis 2024 & 2032
                                                              53. Figure 53: Europe Yams Market Revenue Share (%), by Production Analysis 2024 & 2032
                                                              54. Figure 54: Europe Yams Market Volume Share (%), by Production Analysis 2024 & 2032
                                                              55. Figure 55: Europe Yams Market Revenue (Million), by Consumption Analysis 2024 & 2032
                                                              56. Figure 56: Europe Yams Market Volume (Kiloton), by Consumption Analysis 2024 & 2032
                                                              57. Figure 57: Europe Yams Market Revenue Share (%), by Consumption Analysis 2024 & 2032
                                                              58. Figure 58: Europe Yams Market Volume Share (%), by Consumption Analysis 2024 & 2032
                                                              59. Figure 59: Europe Yams Market Revenue (Million), by Import Market Analysis (Value & Volume) 2024 & 2032
                                                              60. Figure 60: Europe Yams Market Volume (Kiloton), by Import Market Analysis (Value & Volume) 2024 & 2032
                                                              61. Figure 61: Europe Yams Market Revenue Share (%), by Import Market Analysis (Value & Volume) 2024 & 2032
                                                              62. Figure 62: Europe Yams Market Volume Share (%), by Import Market Analysis (Value & Volume) 2024 & 2032
                                                              63. Figure 63: Europe Yams Market Revenue (Million), by Export Market Analysis (Value & Volume) 2024 & 2032
                                                              64. Figure 64: Europe Yams Market Volume (Kiloton), by Export Market Analysis (Value & Volume) 2024 & 2032
                                                              65. Figure 65: Europe Yams Market Revenue Share (%), by Export Market Analysis (Value & Volume) 2024 & 2032
                                                              66. Figure 66: Europe Yams Market Volume Share (%), by Export Market Analysis (Value & Volume) 2024 & 2032
                                                              67. Figure 67: Europe Yams Market Revenue (Million), by Price Trend Analysis 2024 & 2032
                                                              68. Figure 68: Europe Yams Market Volume (Kiloton), by Price Trend Analysis 2024 & 2032
                                                              69. Figure 69: Europe Yams Market Revenue Share (%), by Price Trend Analysis 2024 & 2032
                                                              70. Figure 70: Europe Yams Market Volume Share (%), by Price Trend Analysis 2024 & 2032
                                                              71. Figure 71: Europe Yams Market Revenue (Million), by Country 2024 & 2032
                                                              72. Figure 72: Europe Yams Market Volume (Kiloton), by Country 2024 & 2032
                                                              73. Figure 73: Europe Yams Market Revenue Share (%), by Country 2024 & 2032
                                                              74. Figure 74: Europe Yams Market Volume Share (%), by Country 2024 & 2032
                                                              75. Figure 75: Asia Pacific Yams Market Revenue (Million), by Production Analysis 2024 & 2032
                                                              76. Figure 76: Asia Pacific Yams Market Volume (Kiloton), by Production Analysis 2024 & 2032
                                                              77. Figure 77: Asia Pacific Yams Market Revenue Share (%), by Production Analysis 2024 & 2032
                                                              78. Figure 78: Asia Pacific Yams Market Volume Share (%), by Production Analysis 2024 & 2032
                                                              79. Figure 79: Asia Pacific Yams Market Revenue (Million), by Consumption Analysis 2024 & 2032
                                                              80. Figure 80: Asia Pacific Yams Market Volume (Kiloton), by Consumption Analysis 2024 & 2032
                                                              81. Figure 81: Asia Pacific Yams Market Revenue Share (%), by Consumption Analysis 2024 & 2032
                                                              82. Figure 82: Asia Pacific Yams Market Volume Share (%), by Consumption Analysis 2024 & 2032
                                                              83. Figure 83: Asia Pacific Yams Market Revenue (Million), by Import Market Analysis (Value & Volume) 2024 & 2032
                                                              84. Figure 84: Asia Pacific Yams Market Volume (Kiloton), by Import Market Analysis (Value & Volume) 2024 & 2032
                                                              85. Figure 85: Asia Pacific Yams Market Revenue Share (%), by Import Market Analysis (Value & Volume) 2024 & 2032
                                                              86. Figure 86: Asia Pacific Yams Market Volume Share (%), by Import Market Analysis (Value & Volume) 2024 & 2032
                                                              87. Figure 87: Asia Pacific Yams Market Revenue (Million), by Export Market Analysis (Value & Volume) 2024 & 2032
                                                              88. Figure 88: Asia Pacific Yams Market Volume (Kiloton), by Export Market Analysis (Value & Volume) 2024 & 2032
                                                              89. Figure 89: Asia Pacific Yams Market Revenue Share (%), by Export Market Analysis (Value & Volume) 2024 & 2032
                                                              90. Figure 90: Asia Pacific Yams Market Volume Share (%), by Export Market Analysis (Value & Volume) 2024 & 2032
                                                              91. Figure 91: Asia Pacific Yams Market Revenue (Million), by Price Trend Analysis 2024 & 2032
                                                              92. Figure 92: Asia Pacific Yams Market Volume (Kiloton), by Price Trend Analysis 2024 & 2032
                                                              93. Figure 93: Asia Pacific Yams Market Revenue Share (%), by Price Trend Analysis 2024 & 2032
                                                              94. Figure 94: Asia Pacific Yams Market Volume Share (%), by Price Trend Analysis 2024 & 2032
                                                              95. Figure 95: Asia Pacific Yams Market Revenue (Million), by Country 2024 & 2032
                                                              96. Figure 96: Asia Pacific Yams Market Volume (Kiloton), by Country 2024 & 2032
                                                              97. Figure 97: Asia Pacific Yams Market Revenue Share (%), by Country 2024 & 2032
                                                              98. Figure 98: Asia Pacific Yams Market Volume Share (%), by Country 2024 & 2032
                                                              99. Figure 99: South America Yams Market Revenue (Million), by Production Analysis 2024 & 2032
                                                              100. Figure 100: South America Yams Market Volume (Kiloton), by Production Analysis 2024 & 2032
                                                              101. Figure 101: South America Yams Market Revenue Share (%), by Production Analysis 2024 & 2032
                                                              102. Figure 102: South America Yams Market Volume Share (%), by Production Analysis 2024 & 2032
                                                              103. Figure 103: South America Yams Market Revenue (Million), by Consumption Analysis 2024 & 2032
                                                              104. Figure 104: South America Yams Market Volume (Kiloton), by Consumption Analysis 2024 & 2032
                                                              105. Figure 105: South America Yams Market Revenue Share (%), by Consumption Analysis 2024 & 2032
                                                              106. Figure 106: South America Yams Market Volume Share (%), by Consumption Analysis 2024 & 2032
                                                              107. Figure 107: South America Yams Market Revenue (Million), by Import Market Analysis (Value & Volume) 2024 & 2032
                                                              108. Figure 108: South America Yams Market Volume (Kiloton), by Import Market Analysis (Value & Volume) 2024 & 2032
                                                              109. Figure 109: South America Yams Market Revenue Share (%), by Import Market Analysis (Value & Volume) 2024 & 2032
                                                              110. Figure 110: South America Yams Market Volume Share (%), by Import Market Analysis (Value & Volume) 2024 & 2032
                                                              111. Figure 111: South America Yams Market Revenue (Million), by Export Market Analysis (Value & Volume) 2024 & 2032
                                                              112. Figure 112: South America Yams Market Volume (Kiloton), by Export Market Analysis (Value & Volume) 2024 & 2032
                                                              113. Figure 113: South America Yams Market Revenue Share (%), by Export Market Analysis (Value & Volume) 2024 & 2032
                                                              114. Figure 114: South America Yams Market Volume Share (%), by Export Market Analysis (Value & Volume) 2024 & 2032
                                                              115. Figure 115: South America Yams Market Revenue (Million), by Price Trend Analysis 2024 & 2032
                                                              116. Figure 116: South America Yams Market Volume (Kiloton), by Price Trend Analysis 2024 & 2032
                                                              117. Figure 117: South America Yams Market Revenue Share (%), by Price Trend Analysis 2024 & 2032
                                                              118. Figure 118: South America Yams Market Volume Share (%), by Price Trend Analysis 2024 & 2032
                                                              119. Figure 119: South America Yams Market Revenue (Million), by Country 2024 & 2032
                                                              120. Figure 120: South America Yams Market Volume (Kiloton), by Country 2024 & 2032
                                                              121. Figure 121: South America Yams Market Revenue Share (%), by Country 2024 & 2032
                                                              122. Figure 122: South America Yams Market Volume Share (%), by Country 2024 & 2032
                                                              123. Figure 123: Middle East and Africa Yams Market Revenue (Million), by Production Analysis 2024 & 2032
                                                              124. Figure 124: Middle East and Africa Yams Market Volume (Kiloton), by Production Analysis 2024 & 2032
                                                              125. Figure 125: Middle East and Africa Yams Market Revenue Share (%), by Production Analysis 2024 & 2032
                                                              126. Figure 126: Middle East and Africa Yams Market Volume Share (%), by Production Analysis 2024 & 2032
                                                              127. Figure 127: Middle East and Africa Yams Market Revenue (Million), by Consumption Analysis 2024 & 2032
                                                              128. Figure 128: Middle East and Africa Yams Market Volume (Kiloton), by Consumption Analysis 2024 & 2032
                                                              129. Figure 129: Middle East and Africa Yams Market Revenue Share (%), by Consumption Analysis 2024 & 2032
                                                              130. Figure 130: Middle East and Africa Yams Market Volume Share (%), by Consumption Analysis 2024 & 2032
                                                              131. Figure 131: Middle East and Africa Yams Market Revenue (Million), by Import Market Analysis (Value & Volume) 2024 & 2032
                                                              132. Figure 132: Middle East and Africa Yams Market Volume (Kiloton), by Import Market Analysis (Value & Volume) 2024 & 2032
                                                              133. Figure 133: Middle East and Africa Yams Market Revenue Share (%), by Import Market Analysis (Value & Volume) 2024 & 2032
                                                              134. Figure 134: Middle East and Africa Yams Market Volume Share (%), by Import Market Analysis (Value & Volume) 2024 & 2032
                                                              135. Figure 135: Middle East and Africa Yams Market Revenue (Million), by Export Market Analysis (Value & Volume) 2024 & 2032
                                                              136. Figure 136: Middle East and Africa Yams Market Volume (Kiloton), by Export Market Analysis (Value & Volume) 2024 & 2032
                                                              137. Figure 137: Middle East and Africa Yams Market Revenue Share (%), by Export Market Analysis (Value & Volume) 2024 & 2032
                                                              138. Figure 138: Middle East and Africa Yams Market Volume Share (%), by Export Market Analysis (Value & Volume) 2024 & 2032
                                                              139. Figure 139: Middle East and Africa Yams Market Revenue (Million), by Price Trend Analysis 2024 & 2032
                                                              140. Figure 140: Middle East and Africa Yams Market Volume (Kiloton), by Price Trend Analysis 2024 & 2032
                                                              141. Figure 141: Middle East and Africa Yams Market Revenue Share (%), by Price Trend Analysis 2024 & 2032
                                                              142. Figure 142: Middle East and Africa Yams Market Volume Share (%), by Price Trend Analysis 2024 & 2032
                                                              143. Figure 143: Middle East and Africa Yams Market Revenue (Million), by Country 2024 & 2032
                                                              144. Figure 144: Middle East and Africa Yams Market Volume (Kiloton), by Country 2024 & 2032
                                                              145. Figure 145: Middle East and Africa Yams Market Revenue Share (%), by Country 2024 & 2032
                                                              146. Figure 146: Middle East and Africa Yams Market Volume Share (%), by Country 2024 & 2032

                                                              List of Tables

                                                              1. Table 1: Global Yams Market Revenue Million Forecast, by Region 2019 & 2032
                                                              2. Table 2: Global Yams Market Volume Kiloton Forecast, by Region 2019 & 2032
                                                              3. Table 3: Global Yams Market Revenue Million Forecast, by Production Analysis 2019 & 2032
                                                              4. Table 4: Global Yams Market Volume Kiloton Forecast, by Production Analysis 2019 & 2032
                                                              5. Table 5: Global Yams Market Revenue Million Forecast, by Consumption Analysis 2019 & 2032
                                                              6. Table 6: Global Yams Market Volume Kiloton Forecast, by Consumption Analysis 2019 & 2032
                                                              7. Table 7: Global Yams Market Revenue Million Forecast, by Import Market Analysis (Value & Volume) 2019 & 2032
                                                              8. Table 8: Global Yams Market Volume Kiloton Forecast, by Import Market Analysis (Value & Volume) 2019 & 2032
                                                              9. Table 9: Global Yams Market Revenue Million Forecast, by Export Market Analysis (Value & Volume) 2019 & 2032
                                                              10. Table 10: Global Yams Market Volume Kiloton Forecast, by Export Market Analysis (Value & Volume) 2019 & 2032
                                                              11. Table 11: Global Yams Market Revenue Million Forecast, by Price Trend Analysis 2019 & 2032
                                                              12. Table 12: Global Yams Market Volume Kiloton Forecast, by Price Trend Analysis 2019 & 2032
                                                              13. Table 13: Global Yams Market Revenue Million Forecast, by Region 2019 & 2032
                                                              14. Table 14: Global Yams Market Volume Kiloton Forecast, by Region 2019 & 2032
                                                              15. Table 15: Global Yams Market Revenue Million Forecast, by Country 2019 & 2032
                                                              16. Table 16: Global Yams Market Volume Kiloton Forecast, by Country 2019 & 2032
                                                              17. Table 17: United States Yams Market Revenue (Million) Forecast, by Application 2019 & 2032
                                                              18. Table 18: United States Yams Market Volume (Kiloton) Forecast, by Application 2019 & 2032
                                                              19. Table 19: Canada Yams Market Revenue (Million) Forecast, by Application 2019 & 2032
                                                              20. Table 20: Canada Yams Market Volume (Kiloton) Forecast, by Application 2019 & 2032
                                                              21. Table 21: Mexico Yams Market Revenue (Million) Forecast, by Application 2019 & 2032
                                                              22. Table 22: Mexico Yams Market Volume (Kiloton) Forecast, by Application 2019 & 2032
                                                              23. Table 23: Global Yams Market Revenue Million Forecast, by Country 2019 & 2032
                                                              24. Table 24: Global Yams Market Volume Kiloton Forecast, by Country 2019 & 2032
                                                              25. Table 25: Germany Yams Market Revenue (Million) Forecast, by Application 2019 & 2032
                                                              26. Table 26: Germany Yams Market Volume (Kiloton) Forecast, by Application 2019 & 2032
                                                              27. Table 27: United Kingdom Yams Market Revenue (Million) Forecast, by Application 2019 & 2032
                                                              28. Table 28: United Kingdom Yams Market Volume (Kiloton) Forecast, by Application 2019 & 2032
                                                              29. Table 29: France Yams Market Revenue (Million) Forecast, by Application 2019 & 2032
                                                              30. Table 30: France Yams Market Volume (Kiloton) Forecast, by Application 2019 & 2032
                                                              31. Table 31: Spain Yams Market Revenue (Million) Forecast, by Application 2019 & 2032
                                                              32. Table 32: Spain Yams Market Volume (Kiloton) Forecast, by Application 2019 & 2032
                                                              33. Table 33: Italy Yams Market Revenue (Million) Forecast, by Application 2019 & 2032
                                                              34. Table 34: Italy Yams Market Volume (Kiloton) Forecast, by Application 2019 & 2032
                                                              35. Table 35: Spain Yams Market Revenue (Million) Forecast, by Application 2019 & 2032
                                                              36. Table 36: Spain Yams Market Volume (Kiloton) Forecast, by Application 2019 & 2032
                                                              37. Table 37: Belgium Yams Market Revenue (Million) Forecast, by Application 2019 & 2032
                                                              38. Table 38: Belgium Yams Market Volume (Kiloton) Forecast, by Application 2019 & 2032
                                                              39. Table 39: Netherland Yams Market Revenue (Million) Forecast, by Application 2019 & 2032
                                                              40. Table 40: Netherland Yams Market Volume (Kiloton) Forecast, by Application 2019 & 2032
                                                              41. Table 41: Nordics Yams Market Revenue (Million) Forecast, by Application 2019 & 2032
                                                              42. Table 42: Nordics Yams Market Volume (Kiloton) Forecast, by Application 2019 & 2032
                                                              43. Table 43: Rest of Europe Yams Market Revenue (Million) Forecast, by Application 2019 & 2032
                                                              44. Table 44: Rest of Europe Yams Market Volume (Kiloton) Forecast, by Application 2019 & 2032
                                                              45. Table 45: Global Yams Market Revenue Million Forecast, by Country 2019 & 2032
                                                              46. Table 46: Global Yams Market Volume Kiloton Forecast, by Country 2019 & 2032
                                                              47. Table 47: China Yams Market Revenue (Million) Forecast, by Application 2019 & 2032
                                                              48. Table 48: China Yams Market Volume (Kiloton) Forecast, by Application 2019 & 2032
                                                              49. Table 49: Japan Yams Market Revenue (Million) Forecast, by Application 2019 & 2032
                                                              50. Table 50: Japan Yams Market Volume (Kiloton) Forecast, by Application 2019 & 2032
                                                              51. Table 51: India Yams Market Revenue (Million) Forecast, by Application 2019 & 2032
                                                              52. Table 52: India Yams Market Volume (Kiloton) Forecast, by Application 2019 & 2032
                                                              53. Table 53: South Korea Yams Market Revenue (Million) Forecast, by Application 2019 & 2032
                                                              54. Table 54: South Korea Yams Market Volume (Kiloton) Forecast, by Application 2019 & 2032
                                                              55. Table 55: Southeast Asia Yams Market Revenue (Million) Forecast, by Application 2019 & 2032
                                                              56. Table 56: Southeast Asia Yams Market Volume (Kiloton) Forecast, by Application 2019 & 2032
                                                              57. Table 57: Australia Yams Market Revenue (Million) Forecast, by Application 2019 & 2032
                                                              58. Table 58: Australia Yams Market Volume (Kiloton) Forecast, by Application 2019 & 2032
                                                              59. Table 59: Indonesia Yams Market Revenue (Million) Forecast, by Application 2019 & 2032
                                                              60. Table 60: Indonesia Yams Market Volume (Kiloton) Forecast, by Application 2019 & 2032
                                                              61. Table 61: Phillipes Yams Market Revenue (Million) Forecast, by Application 2019 & 2032
                                                              62. Table 62: Phillipes Yams Market Volume (Kiloton) Forecast, by Application 2019 & 2032
                                                              63. Table 63: Singapore Yams Market Revenue (Million) Forecast, by Application 2019 & 2032
                                                              64. Table 64: Singapore Yams Market Volume (Kiloton) Forecast, by Application 2019 & 2032
                                                              65. Table 65: Thailandc Yams Market Revenue (Million) Forecast, by Application 2019 & 2032
                                                              66. Table 66: Thailandc Yams Market Volume (Kiloton) Forecast, by Application 2019 & 2032
                                                              67. Table 67: Rest of Asia Pacific Yams Market Revenue (Million) Forecast, by Application 2019 & 2032
                                                              68. Table 68: Rest of Asia Pacific Yams Market Volume (Kiloton) Forecast, by Application 2019 & 2032
                                                              69. Table 69: Global Yams Market Revenue Million Forecast, by Country 2019 & 2032
                                                              70. Table 70: Global Yams Market Volume Kiloton Forecast, by Country 2019 & 2032
                                                              71. Table 71: Brazil Yams Market Revenue (Million) Forecast, by Application 2019 & 2032
                                                              72. Table 72: Brazil Yams Market Volume (Kiloton) Forecast, by Application 2019 & 2032
                                                              73. Table 73: Argentina Yams Market Revenue (Million) Forecast, by Application 2019 & 2032
                                                              74. Table 74: Argentina Yams Market Volume (Kiloton) Forecast, by Application 2019 & 2032
                                                              75. Table 75: Peru Yams Market Revenue (Million) Forecast, by Application 2019 & 2032
                                                              76. Table 76: Peru Yams Market Volume (Kiloton) Forecast, by Application 2019 & 2032
                                                              77. Table 77: Chile Yams Market Revenue (Million) Forecast, by Application 2019 & 2032
                                                              78. Table 78: Chile Yams Market Volume (Kiloton) Forecast, by Application 2019 & 2032
                                                              79. Table 79: Colombia Yams Market Revenue (Million) Forecast, by Application 2019 & 2032
                                                              80. Table 80: Colombia Yams Market Volume (Kiloton) Forecast, by Application 2019 & 2032
                                                              81. Table 81: Ecuador Yams Market Revenue (Million) Forecast, by Application 2019 & 2032
                                                              82. Table 82: Ecuador Yams Market Volume (Kiloton) Forecast, by Application 2019 & 2032
                                                              83. Table 83: Venezuela Yams Market Revenue (Million) Forecast, by Application 2019 & 2032
                                                              84. Table 84: Venezuela Yams Market Volume (Kiloton) Forecast, by Application 2019 & 2032
                                                              85. Table 85: Rest of South America Yams Market Revenue (Million) Forecast, by Application 2019 & 2032
                                                              86. Table 86: Rest of South America Yams Market Volume (Kiloton) Forecast, by Application 2019 & 2032
                                                              87. Table 87: Global Yams Market Revenue Million Forecast, by Country 2019 & 2032
                                                              88. Table 88: Global Yams Market Volume Kiloton Forecast, by Country 2019 & 2032
                                                              89. Table 89: United States Yams Market Revenue (Million) Forecast, by Application 2019 & 2032
                                                              90. Table 90: United States Yams Market Volume (Kiloton) Forecast, by Application 2019 & 2032
                                                              91. Table 91: Canada Yams Market Revenue (Million) Forecast, by Application 2019 & 2032
                                                              92. Table 92: Canada Yams Market Volume (Kiloton) Forecast, by Application 2019 & 2032
                                                              93. Table 93: Mexico Yams Market Revenue (Million) Forecast, by Application 2019 & 2032
                                                              94. Table 94: Mexico Yams Market Volume (Kiloton) Forecast, by Application 2019 & 2032
                                                              95. Table 95: Global Yams Market Revenue Million Forecast, by Country 2019 & 2032
                                                              96. Table 96: Global Yams Market Volume Kiloton Forecast, by Country 2019 & 2032
                                                              97. Table 97: United Arab Emirates Yams Market Revenue (Million) Forecast, by Application 2019 & 2032
                                                              98. Table 98: United Arab Emirates Yams Market Volume (Kiloton) Forecast, by Application 2019 & 2032
                                                              99. Table 99: Saudi Arabia Yams Market Revenue (Million) Forecast, by Application 2019 & 2032
                                                              100. Table 100: Saudi Arabia Yams Market Volume (Kiloton) Forecast, by Application 2019 & 2032
                                                              101. Table 101: South Africa Yams Market Revenue (Million) Forecast, by Application 2019 & 2032
                                                              102. Table 102: South Africa Yams Market Volume (Kiloton) Forecast, by Application 2019 & 2032
                                                              103. Table 103: Rest of Middle East and Africa Yams Market Revenue (Million) Forecast, by Application 2019 & 2032
                                                              104. Table 104: Rest of Middle East and Africa Yams Market Volume (Kiloton) Forecast, by Application 2019 & 2032
                                                              105. Table 105: Global Yams Market Revenue Million Forecast, by Production Analysis 2019 & 2032
                                                              106. Table 106: Global Yams Market Volume Kiloton Forecast, by Production Analysis 2019 & 2032
                                                              107. Table 107: Global Yams Market Revenue Million Forecast, by Consumption Analysis 2019 & 2032
                                                              108. Table 108: Global Yams Market Volume Kiloton Forecast, by Consumption Analysis 2019 & 2032
                                                              109. Table 109: Global Yams Market Revenue Million Forecast, by Import Market Analysis (Value & Volume) 2019 & 2032
                                                              110. Table 110: Global Yams Market Volume Kiloton Forecast, by Import Market Analysis (Value & Volume) 2019 & 2032
                                                              111. Table 111: Global Yams Market Revenue Million Forecast, by Export Market Analysis (Value & Volume) 2019 & 2032
                                                              112. Table 112: Global Yams Market Volume Kiloton Forecast, by Export Market Analysis (Value & Volume) 2019 & 2032
                                                              113. Table 113: Global Yams Market Revenue Million Forecast, by Price Trend Analysis 2019 & 2032
                                                              114. Table 114: Global Yams Market Volume Kiloton Forecast, by Price Trend Analysis 2019 & 2032
                                                              115. Table 115: Global Yams Market Revenue Million Forecast, by Country 2019 & 2032
                                                              116. Table 116: Global Yams Market Volume Kiloton Forecast, by Country 2019 & 2032
                                                              117. Table 117: United States Yams Market Revenue (Million) Forecast, by Application 2019 & 2032
                                                              118. Table 118: United States Yams Market Volume (Kiloton) Forecast, by Application 2019 & 2032
                                                              119. Table 119: Canada Yams Market Revenue (Million) Forecast, by Application 2019 & 2032
                                                              120. Table 120: Canada Yams Market Volume (Kiloton) Forecast, by Application 2019 & 2032
                                                              121. Table 121: Mexico Yams Market Revenue (Million) Forecast, by Application 2019 & 2032
                                                              122. Table 122: Mexico Yams Market Volume (Kiloton) Forecast, by Application 2019 & 2032
                                                              123. Table 123: Rest of North America Yams Market Revenue (Million) Forecast, by Application 2019 & 2032
                                                              124. Table 124: Rest of North America Yams Market Volume (Kiloton) Forecast, by Application 2019 & 2032
                                                              125. Table 125: Global Yams Market Revenue Million Forecast, by Production Analysis 2019 & 2032
                                                              126. Table 126: Global Yams Market Volume Kiloton Forecast, by Production Analysis 2019 & 2032
                                                              127. Table 127: Global Yams Market Revenue Million Forecast, by Consumption Analysis 2019 & 2032
                                                              128. Table 128: Global Yams Market Volume Kiloton Forecast, by Consumption Analysis 2019 & 2032
                                                              129. Table 129: Global Yams Market Revenue Million Forecast, by Import Market Analysis (Value & Volume) 2019 & 2032
                                                              130. Table 130: Global Yams Market Volume Kiloton Forecast, by Import Market Analysis (Value & Volume) 2019 & 2032
                                                              131. Table 131: Global Yams Market Revenue Million Forecast, by Export Market Analysis (Value & Volume) 2019 & 2032
                                                              132. Table 132: Global Yams Market Volume Kiloton Forecast, by Export Market Analysis (Value & Volume) 2019 & 2032
                                                              133. Table 133: Global Yams Market Revenue Million Forecast, by Price Trend Analysis 2019 & 2032
                                                              134. Table 134: Global Yams Market Volume Kiloton Forecast, by Price Trend Analysis 2019 & 2032
                                                              135. Table 135: Global Yams Market Revenue Million Forecast, by Country 2019 & 2032
                                                              136. Table 136: Global Yams Market Volume Kiloton Forecast, by Country 2019 & 2032
                                                              137. Table 137: Germany Yams Market Revenue (Million) Forecast, by Application 2019 & 2032
                                                              138. Table 138: Germany Yams Market Volume (Kiloton) Forecast, by Application 2019 & 2032
                                                              139. Table 139: United Kingdom Yams Market Revenue (Million) Forecast, by Application 2019 & 2032
                                                              140. Table 140: United Kingdom Yams Market Volume (Kiloton) Forecast, by Application 2019 & 2032
                                                              141. Table 141: France Yams Market Revenue (Million) Forecast, by Application 2019 & 2032
                                                              142. Table 142: France Yams Market Volume (Kiloton) Forecast, by Application 2019 & 2032
                                                              143. Table 143: Russia Yams Market Revenue (Million) Forecast, by Application 2019 & 2032
                                                              144. Table 144: Russia Yams Market Volume (Kiloton) Forecast, by Application 2019 & 2032
                                                              145. Table 145: Spain Yams Market Revenue (Million) Forecast, by Application 2019 & 2032
                                                              146. Table 146: Spain Yams Market Volume (Kiloton) Forecast, by Application 2019 & 2032
                                                              147. Table 147: Rest of Europe Yams Market Revenue (Million) Forecast, by Application 2019 & 2032
                                                              148. Table 148: Rest of Europe Yams Market Volume (Kiloton) Forecast, by Application 2019 & 2032
                                                              149. Table 149: Global Yams Market Revenue Million Forecast, by Production Analysis 2019 & 2032
                                                              150. Table 150: Global Yams Market Volume Kiloton Forecast, by Production Analysis 2019 & 2032
                                                              151. Table 151: Global Yams Market Revenue Million Forecast, by Consumption Analysis 2019 & 2032
                                                              152. Table 152: Global Yams Market Volume Kiloton Forecast, by Consumption Analysis 2019 & 2032
                                                              153. Table 153: Global Yams Market Revenue Million Forecast, by Import Market Analysis (Value & Volume) 2019 & 2032
                                                              154. Table 154: Global Yams Market Volume Kiloton Forecast, by Import Market Analysis (Value & Volume) 2019 & 2032
                                                              155. Table 155: Global Yams Market Revenue Million Forecast, by Export Market Analysis (Value & Volume) 2019 & 2032
                                                              156. Table 156: Global Yams Market Volume Kiloton Forecast, by Export Market Analysis (Value & Volume) 2019 & 2032
                                                              157. Table 157: Global Yams Market Revenue Million Forecast, by Price Trend Analysis 2019 & 2032
                                                              158. Table 158: Global Yams Market Volume Kiloton Forecast, by Price Trend Analysis 2019 & 2032
                                                              159. Table 159: Global Yams Market Revenue Million Forecast, by Country 2019 & 2032
                                                              160. Table 160: Global Yams Market Volume Kiloton Forecast, by Country 2019 & 2032
                                                              161. Table 161: India Yams Market Revenue (Million) Forecast, by Application 2019 & 2032
                                                              162. Table 162: India Yams Market Volume (Kiloton) Forecast, by Application 2019 & 2032
                                                              163. Table 163: China Yams Market Revenue (Million) Forecast, by Application 2019 & 2032
                                                              164. Table 164: China Yams Market Volume (Kiloton) Forecast, by Application 2019 & 2032
                                                              165. Table 165: Japan Yams Market Revenue (Million) Forecast, by Application 2019 & 2032
                                                              166. Table 166: Japan Yams Market Volume (Kiloton) Forecast, by Application 2019 & 2032
                                                              167. Table 167: Rest of Asia Pacific Yams Market Revenue (Million) Forecast, by Application 2019 & 2032
                                                              168. Table 168: Rest of Asia Pacific Yams Market Volume (Kiloton) Forecast, by Application 2019 & 2032
                                                              169. Table 169: Global Yams Market Revenue Million Forecast, by Production Analysis 2019 & 2032
                                                              170. Table 170: Global Yams Market Volume Kiloton Forecast, by Production Analysis 2019 & 2032
                                                              171. Table 171: Global Yams Market Revenue Million Forecast, by Consumption Analysis 2019 & 2032
                                                              172. Table 172: Global Yams Market Volume Kiloton Forecast, by Consumption Analysis 2019 & 2032
                                                              173. Table 173: Global Yams Market Revenue Million Forecast, by Import Market Analysis (Value & Volume) 2019 & 2032
                                                              174. Table 174: Global Yams Market Volume Kiloton Forecast, by Import Market Analysis (Value & Volume) 2019 & 2032
                                                              175. Table 175: Global Yams Market Revenue Million Forecast, by Export Market Analysis (Value & Volume) 2019 & 2032
                                                              176. Table 176: Global Yams Market Volume Kiloton Forecast, by Export Market Analysis (Value & Volume) 2019 & 2032
                                                              177. Table 177: Global Yams Market Revenue Million Forecast, by Price Trend Analysis 2019 & 2032
                                                              178. Table 178: Global Yams Market Volume Kiloton Forecast, by Price Trend Analysis 2019 & 2032
                                                              179. Table 179: Global Yams Market Revenue Million Forecast, by Country 2019 & 2032
                                                              180. Table 180: Global Yams Market Volume Kiloton Forecast, by Country 2019 & 2032
                                                              181. Table 181: Brazil Yams Market Revenue (Million) Forecast, by Application 2019 & 2032
                                                              182. Table 182: Brazil Yams Market Volume (Kiloton) Forecast, by Application 2019 & 2032
                                                              183. Table 183: Argentina Yams Market Revenue (Million) Forecast, by Application 2019 & 2032
                                                              184. Table 184: Argentina Yams Market Volume (Kiloton) Forecast, by Application 2019 & 2032
                                                              185. Table 185: Rest of South America Yams Market Revenue (Million) Forecast, by Application 2019 & 2032
                                                              186. Table 186: Rest of South America Yams Market Volume (Kiloton) Forecast, by Application 2019 & 2032
                                                              187. Table 187: Global Yams Market Revenue Million Forecast, by Production Analysis 2019 & 2032
                                                              188. Table 188: Global Yams Market Volume Kiloton Forecast, by Production Analysis 2019 & 2032
                                                              189. Table 189: Global Yams Market Revenue Million Forecast, by Consumption Analysis 2019 & 2032
                                                              190. Table 190: Global Yams Market Volume Kiloton Forecast, by Consumption Analysis 2019 & 2032
                                                              191. Table 191: Global Yams Market Revenue Million Forecast, by Import Market Analysis (Value & Volume) 2019 & 2032
                                                              192. Table 192: Global Yams Market Volume Kiloton Forecast, by Import Market Analysis (Value & Volume) 2019 & 2032
                                                              193. Table 193: Global Yams Market Revenue Million Forecast, by Export Market Analysis (Value & Volume) 2019 & 2032
                                                              194. Table 194: Global Yams Market Volume Kiloton Forecast, by Export Market Analysis (Value & Volume) 2019 & 2032
                                                              195. Table 195: Global Yams Market Revenue Million Forecast, by Price Trend Analysis 2019 & 2032
                                                              196. Table 196: Global Yams Market Volume Kiloton Forecast, by Price Trend Analysis 2019 & 2032
                                                              197. Table 197: Global Yams Market Revenue Million Forecast, by Country 2019 & 2032
                                                              198. Table 198: Global Yams Market Volume Kiloton Forecast, by Country 2019 & 2032
                                                              199. Table 199: Nigeria Yams Market Revenue (Million) Forecast, by Application 2019 & 2032
                                                              200. Table 200: Nigeria Yams Market Volume (Kiloton) Forecast, by Application 2019 & 2032
                                                              201. Table 201: Ghana Yams Market Revenue (Million) Forecast, by Application 2019 & 2032
                                                              202. Table 202: Ghana Yams Market Volume (Kiloton) Forecast, by Application 2019 & 2032
                                                              203. Table 203: Rest of Middle East and Africa Yams Market Revenue (Million) Forecast, by Application 2019 & 2032
                                                              204. Table 204: Rest of Middle East and Africa Yams Market Volume (Kiloton) Forecast, by Application 2019 & 2032


                                                              Frequently Asked Questions

                                                              1. What is the projected Compound Annual Growth Rate (CAGR) of the Yams Market?

                                                              The projected CAGR is approximately 3.50%.

                                                              2. Which companies are prominent players in the Yams Market?

                                                              Key companies in the market include Agrico, Bafo Farms, Golden Agri-Resources, Sunvi Group, African Yam Farmers Association.

                                                              3. What are the main segments of the Yams Market?

                                                              The market segments include Production Analysis, Consumption Analysis, Import Market Analysis (Value & Volume), Export Market Analysis (Value & Volume), Price Trend Analysis.

                                                              4. Can you provide details about the market size?

                                                              The market size is estimated to be USD 15 Million as of 2022.

                                                              5. What are some drivers contributing to market growth?

                                                              Awareness About Health Benefits Associated With Pecan Consumption; Wide Application of Pecan.

                                                              6. What are the notable trends driving market growth?

                                                              Rising Health Benefits of Yams across the Globe.

                                                              7. Are there any restraints impacting market growth?

                                                              Volatility in the Prices; Adverse Weather Conditions Affecting Yield.

                                                              8. Can you provide examples of recent developments in the market?

                                                              August 2022: Fiji Yam Farmers Association (FYFA) association, an affiliate of the Fiji Crop and Livestock Council (FCLC), serves the needs of yam farmers and provides a channel of communication for sale and reproduction.

                                                              9. What pricing options are available for accessing the report?

                                                              Pricing options include single-user, multi-user, and enterprise licenses priced at USD 4750, USD 5250, and USD 8750 respectively.

                                                              10. Is the market size provided in terms of value or volume?

                                                              The market size is provided in terms of value, measured in Million and volume, measured in Kiloton.

                                                              11. Are there any specific market keywords associated with the report?

                                                              Yes, the market keyword associated with the report is "Yams Market," which aids in identifying and referencing the specific market segment covered.

                                                              12. How do I determine which pricing option suits my needs best?

                                                              The pricing options vary based on user requirements and access needs. Individual users may opt for single-user licenses, while businesses requiring broader access may choose multi-user or enterprise licenses for cost-effective access to the report.

                                                              13. Are there any additional resources or data provided in the Yams Market report?

                                                              While the report offers comprehensive insights, it's advisable to review the specific contents or supplementary materials provided to ascertain if additional resources or data are available.

                                                              14. How can I stay updated on further developments or reports in the Yams Market?

                                                              To stay informed about further developments, trends, and reports in the Yams Market, consider subscribing to industry newsletters, following relevant companies and organizations, or regularly checking reputable industry news sources and publications.


                                                              Methodology

                                                              Step 1 - Identification of Relevant Samples Size from Population Database

                                                              Step Chart
                                                              Bar Chart
                                                              Method Chart

                                                              Step 2 - Approaches for Defining Global Market Size (Value, Volume* & Price*)

                                                              Approach Chart
                                                              Top-down and bottom-up approaches are used to validate the global market size and estimate the market size for manufactures, regional segments, product, and application.

                                                              Note*: In applicable scenarios

                                                              Step 3 - Data Sources

                                                              Primary Research

                                                              • Web Analytics
                                                              • Survey Reports
                                                              • Research Institute
                                                              • Latest Research Reports
                                                              • Opinion Leaders

                                                              Secondary Research

                                                              • Annual Reports
                                                              • White Paper
                                                              • Latest Press Release
                                                              • Industry Association
                                                              • Paid Database
                                                              • Investor Presentations
                                                              Analyst Chart

                                                              Step 4 - Data Triangulation

                                                              Involves using different sources of information in order to increase the validity of a study

                                                              These sources are likely to be stakeholders in a program - participants, other researchers, program staff, other community members, and so on.

                                                              Then we put all data in single framework & apply various statistical tools to find out the dynamic on the market.

                                                              During the analysis stage, feedback from the stakeholder groups would be compared to determine areas of agreement as well as areas of divergence

                                                              Additionally, after gathering mixed and scattered data from a wide range of sources, data is triangulated and correlated to come up with estimated figures which are further validated through primary mediums or industry experts, opinion leaders.

                                                              About Visionary Data Reports

                                                              Visionary Data Reports provides future-focused market research, advanced analytics, and strategic insights for technology, healthcare, green energy, and finance. Our reports help you anticipate trends, innovate, and lead in your industry. Our expert team combines primary research, data science, and industry knowledge to deliver actionable intelligence. We offer syndicated reports, custom analytics, and consulting services tailored to your business needs. At Visionary Data Reports, we are committed to quality, transparency, and client satisfaction. Every report is rigorously validated to ensure accuracy and relevance. Our global perspective and forward-thinking approach help you understand both current and emerging market dynamics.

                                                              Stay ahead with Visionary Data Reports. Subscribe to our newsletter for the latest insights and research highlights, and follow us on social media for real-time updates. Visionary Data Reports – Your Guide to Tomorrow’s Opportunities.

                                                              • Home
                                                              • About Us
                                                              • Industries
                                                                • Aerospace & Defense
                                                                • Agriculture
                                                                • Animal Nutrition & Wellness
                                                                • Automotive
                                                                • Chemicals & Materials
                                                                • Consumer Goods and Services
                                                                • Energy & Power
                                                                • Financial Services and Investment Intelligence
                                                                • Food & Beverage
                                                                • Home and Property Improvement
                                                                • Hospitality and Tourism
                                                                • Logistics
                                                                • Manufacturing Products and Services
                                                                • Packaging
                                                                • Professional and Commercial Services
                                                                • Real Estate and Construction
                                                                • Retail
                                                                • Technology, Media and Telecom
                                                                • Healthcare
                                                              • Services
                                                              • Contact
                                                              Main Logo
                                                              • Home
                                                              • About Us
                                                              • Industries
                                                                • Aerospace & Defense
                                                                • Agriculture
                                                                • Animal Nutrition & Wellness
                                                                • Automotive
                                                                • Chemicals & Materials
                                                                • Consumer Goods and Services
                                                                • Energy & Power
                                                                • Financial Services and Investment Intelligence
                                                                • Food & Beverage
                                                                • Home and Property Improvement
                                                                • Hospitality and Tourism
                                                                • Logistics
                                                                • Manufacturing Products and Services
                                                                • Packaging
                                                                • Professional and Commercial Services
                                                                • Real Estate and Construction
                                                                • Retail
                                                                • Technology, Media and Telecom
                                                                • Healthcare
                                                              • Services
                                                              • Contact
                                                              +17162654855
                                                              [email protected]

                                                              +17162654855

                                                              [email protected]

                                                              Business Address

                                                              Head Office

                                                              Office no. A 5010, fifth floor, Solitaire Business Hub, Near Phoenix mall, Pune, Maharashtra 411014

                                                              Contact Information

                                                              Craig Francis

                                                              Business Development Head

                                                              +17162654855

                                                              [email protected]

                                                              Connect With Us

                                                              Secure Payment Partners

                                                              payment image
                                                              RetailLogisticsPackagingAutomotiveHealthcareAgricultureEnergy & PowerFood & BeverageAerospace & DefenseChemicals & MaterialsHospitality and TourismAnimal Nutrition & WellnessConsumer Goods and ServicesReal Estate and ConstructionHome and Property ImprovementTechnology, Media and TelecomManufacturing Products and ServicesFinancial Services and Investment Intelligence

                                                              © 2025 All rights reserved


                                                              Privacy Policy
                                                              Terms and Conditions
                                                              FAQ
                                                              artwork spiralartwork spiralRelated Reports
                                                              artwork underline

                                                              Emerging Trends in Brazil Maize Market: A Technology Perspective 2025-2033

                                                              Discover the dynamic Brazil maize market forecast (2025-2033)! This in-depth analysis reveals key growth drivers, including animal feed, biofuel, and human consumption, alongside major players like Syngenta and Corteva. Explore market size, CAGR, and regional insights to understand this lucrative opportunity.

                                                              July 2025
                                                              Base Year: 2024
                                                              No Of Pages: 180
                                                              Price: $3800

                                                              Future Forecasts for North America Seed Treatment Market Industry Growth

                                                              Discover the booming North American seed treatment market! This in-depth analysis reveals a CAGR of 4.20% (2025-2033), driven by precision farming, pest control needs, and government support. Explore key players, market segments (fungicides, insecticides, crops), and regional trends in the US, Canada, and Mexico. Get the data-driven insights you need to succeed.

                                                              July 2025
                                                              Base Year: 2024
                                                              No Of Pages: 150
                                                              Price: $3800

                                                              Africa Chia Seeds Industry Market’s Drivers and Challenges: Strategic Overview 2025-2033

                                                              Discover the booming African chia seed market! Our analysis reveals a $13.87M market in 2025, projected to grow at a 2.10% CAGR through 2033. Explore key trends, segments (organic, hybrid, processed, omega-3 rich), applications (food & beverage, supplements, personal care), and leading companies. Get insights for investment and market entry.

                                                              July 2025
                                                              Base Year: 2024
                                                              No Of Pages: 180
                                                              Price: $4750

                                                              Strategic Trends in Asia-Pacific Seed Coating Materials Market Market 2025-2033

                                                              The Asia-Pacific seed coating materials market is booming, with an 8% CAGR. Discover key trends, leading companies (BASF, Bayer), and segment analysis (polymers, colorants) driving growth in this $XX million market. Explore the forecast to 2033.

                                                              July 2025
                                                              Base Year: 2024
                                                              No Of Pages: 150
                                                              Price: $3800

                                                              Comprehensive Review of UK Fruits and Vegetables Market Growth Potential

                                                              Discover the booming UK fruits and vegetables market! This in-depth analysis reveals a £31.58 billion market with a 2.97% CAGR (2025-2033), driven by health trends and major players like Tesco and Sainsbury's. Explore regional data, consumption patterns, and future growth potential.

                                                              July 2025
                                                              Base Year: 2024
                                                              No Of Pages: 180
                                                              Price: $3800

                                                              Malaysia Agrochemical Market Market’s Drivers and Challenges: Strategic Overview 2025-2033

                                                              Discover the booming Malaysian agrochemical market! This comprehensive analysis reveals a RM 679.59 million market in 2025, projected to grow at a 4.56% CAGR until 2033. Explore key drivers, trends, restraints, and leading companies shaping this dynamic sector. Learn about fertilizers, pesticides, and other agrochemical segments.

                                                              July 2025
                                                              Base Year: 2024
                                                              No Of Pages: 150
                                                              Price: $3800

                                                              Drivers of Change in Agricultural Surfactant Market Market 2025-2033

                                                              The global agricultural surfactant market is booming, projected to reach $3.56 billion by 2033 with a 6.70% CAGR. Driven by precision agriculture and sustainable farming, this market analysis explores key segments (anionic, nonionic, bio-based), top players (BASF, Clariant), and regional growth trends. Discover the future of agricultural surfactants.

                                                              July 2025
                                                              Base Year: 2024
                                                              No Of Pages: 234
                                                              Price: $4750

                                                              Cameroon Grains Industry Industry Analysis and Consumer Behavior

                                                              Discover the booming Cameroon grains industry! Explore market size, growth trends (4.80% CAGR), key players (Sodecoton, CDC, etc.), and challenges impacting cereals, pulses, and oilseeds in Cameroon from 2019-2033. Invest wisely in this promising African market.

                                                              July 2025
                                                              Base Year: 2024
                                                              No Of Pages: 180
                                                              Price: $3800

                                                              Analyzing Consumer Behavior in Agriculture Market in Tanzania Market

                                                              Discover the booming Tanzanian agriculture market! Projected to reach $17.44 billion in 2025, with a 5.63% CAGR, this report analyzes market size, key players (Syngenta, Rijk Zwaan), growth drivers, and future trends in Tanzania's agricultural sector. Explore market segments, including food crops and investment opportunities.

                                                              July 2025
                                                              Base Year: 2024
                                                              No Of Pages: 150
                                                              Price: $3800

                                                              Analyzing Consumer Behavior in Artificial Intelligence in Agriculture Industry Market

                                                              Discover the booming AI in Agriculture market! This comprehensive analysis reveals a 4.20% CAGR, key drivers, trends, restraints, and regional insights from 2019-2033. Learn about leading companies and applications like precision farming, drone analytics, and weather tracking. Explore market size projections and future growth potential.

                                                              July 2025
                                                              Base Year: 2024
                                                              No Of Pages: 150
                                                              Price: $4750

                                                              Exploring Forestry Machinery Market’s Market Size Dynamics 2025-2033

                                                              The global forestry machinery market is booming, projected to reach $15 billion by 2033, driven by rising timber demand and technological advancements. Explore market trends, key players (Deere, Komatsu, etc.), and regional growth in our comprehensive analysis.

                                                              July 2025
                                                              Base Year: 2024
                                                              No Of Pages: 150
                                                              Price: $4750

                                                              Nutrition Canary Seed Market Competitive Strategies: Trends and Forecasts 2025-2033

                                                              Discover the booming nutrition canary seed market! Explore key trends, growth drivers, and regional market share projections for 2025-2033. Learn about leading companies and the increasing demand driven by health-conscious consumers and the birdseed industry.

                                                              July 2025
                                                              Base Year: 2024
                                                              No Of Pages: 234
                                                              Price: $4750

                                                              Consumer Behavior and Cashews Market in South America Trends

                                                              Discover the booming South American cashew market! This comprehensive analysis reveals a $582.24 million market in 2025, projected to grow at a 5.20% CAGR through 2033. Explore key trends, drivers, and leading companies shaping this lucrative industry.

                                                              July 2025
                                                              Base Year: 2024
                                                              No Of Pages: 180
                                                              Price: $3800

                                                              Strategic Growth Drivers for Rye Industry Market

                                                              Discover the latest market analysis of the global rye industry, projecting a steady CAGR of 2.20% to 2033. Explore key drivers, restraints, and regional trends impacting the growth of rye in food, feed, and beverage applications. Learn about leading companies and future market opportunities.

                                                              July 2025
                                                              Base Year: 2024
                                                              No Of Pages: 234
                                                              Price: $4750

                                                              Comprehensive Overview of Water Soluble Fertilizer Industry Trends: 2025-2033

                                                              Discover the booming water-soluble fertilizer market! Explore its $XX million valuation in 2025, projected 3.80% CAGR growth to 2033, key drivers, trends, and regional insights. Learn about top players and lucrative segments like fertigation and horticultural crops.

                                                              July 2025
                                                              Base Year: 2024
                                                              No Of Pages: 150
                                                              Price: $3800

                                                              Asia-Pacific Agricultural Tractors Market Market Expansion: Growth Outlook 2025-2033

                                                              Discover the booming Asia-Pacific Agricultural Tractors market! Our analysis reveals a $15 billion USD market in 2025, projected to grow at a 6% CAGR through 2033. Explore market size, growth trends, and regional breakdowns for India, China, and other key countries. Learn how technological advancements and government initiatives are shaping the future of farming.

                                                              July 2025
                                                              Base Year: 2024
                                                              No Of Pages: 197
                                                              Price: $3800

                                                              Asia-Pacific Agricultural Enzymes Market Market’s Consumer Preferences: Trends and Analysis 2025-2033

                                                              The Asia-Pacific agricultural enzymes market is booming, projected to reach $XX million by 2025, with a CAGR of 10.30%. This report analyzes market drivers, trends, restraints, and key players like Novozymes and BASF, covering segments like carbohydrases and applications in crop protection. Discover regional insights and forecast data for 2025-2033.

                                                              July 2025
                                                              Base Year: 2024
                                                              No Of Pages: 197
                                                              Price: $3800

                                                              Strategic Vision for USA Agricultural Irrigation Machinery Market Industry Trends

                                                              Discover the booming US agricultural irrigation machinery market! This in-depth analysis reveals projected growth to $3.8B by 2033, driven by water scarcity, precision agriculture, and smart irrigation technology. Explore key players, regional trends, and market segmentation in drip, sprinkler, and pivot irrigation.

                                                              July 2025
                                                              Base Year: 2024
                                                              No Of Pages: 150
                                                              Price: $3800

                                                              Electric Lawn Mowers Market Insightful Market Analysis: Trends and Opportunities 2025-2033

                                                              Discover the booming electric lawn mower market! This comprehensive analysis reveals a CAGR of 6.50%, driven by eco-consciousness and technological advancements. Explore market size, key players (Toro, Husqvarna, etc.), regional trends, and future projections (2025-2033) for residential, professional, and golf course applications.

                                                              July 2025
                                                              Base Year: 2024
                                                              No Of Pages: 150
                                                              Price: $4750

                                                              Asia-pacific Forage Seed Market Report 2025: Growth Driven by Government Incentives and Partnerships

                                                              Discover the booming Asia-Pacific forage seed market! Explore key trends, growth drivers (including increasing livestock & adoption of hybrid seeds), and challenges impacting alfalfa, forage corn, and other crops. Learn about leading companies and regional market shares. Projected CAGR of 4.70% to 2033.

                                                              July 2025
                                                              Base Year: 2024
                                                              No Of Pages: 150
                                                              Price: $3800