
Key Insights
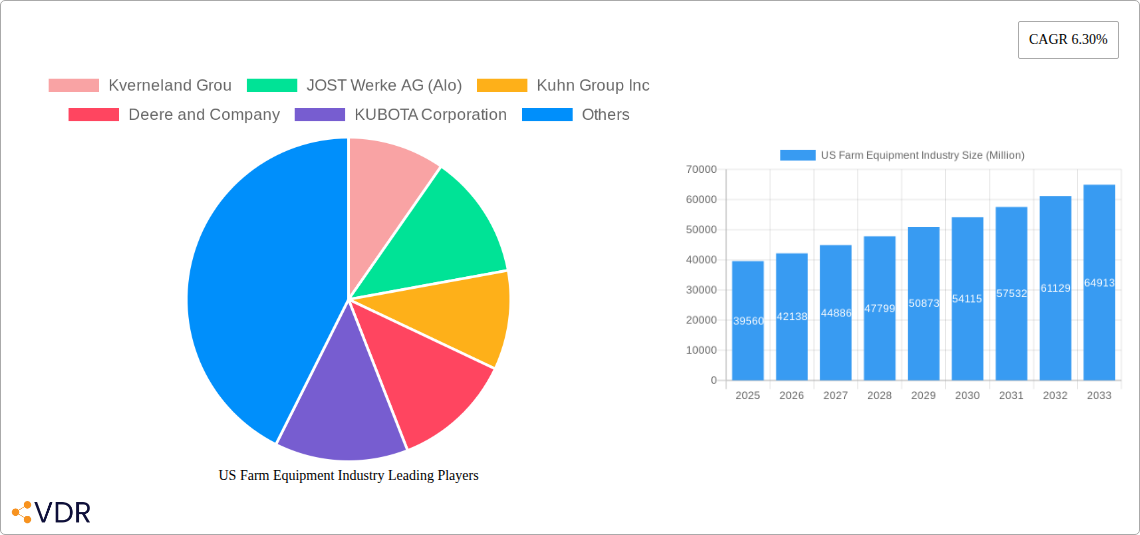
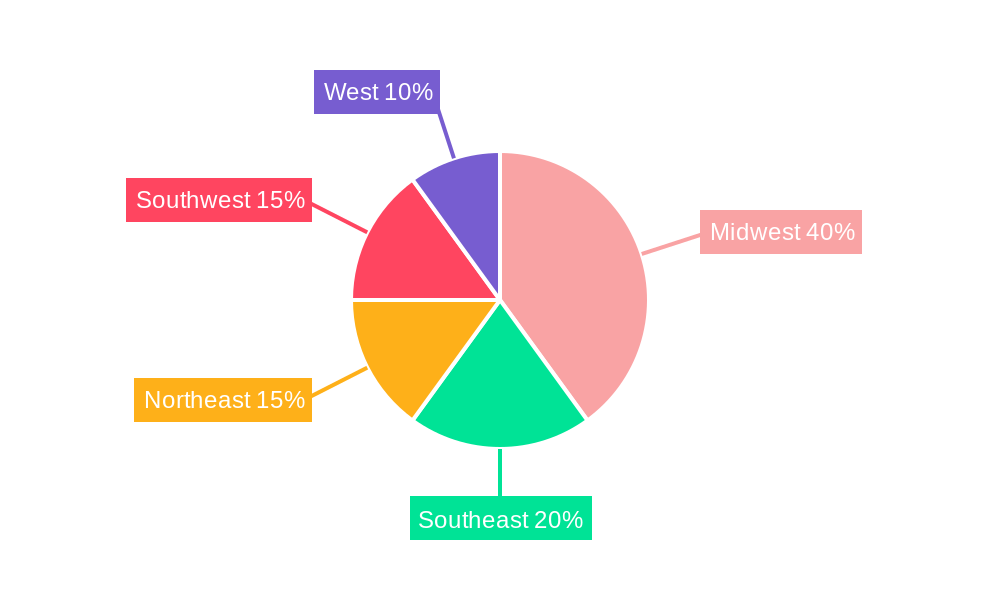
The US farm equipment market, valued at $39.56 billion in 2025, is projected to experience robust growth, driven by several key factors. Technological advancements, such as precision agriculture techniques (GPS-guided machinery, automated planting and harvesting) and the increasing adoption of data analytics for optimized farm management, are significantly boosting efficiency and yields. This is further fueled by government initiatives promoting sustainable farming practices and investments in agricultural infrastructure. The rising global population and growing demand for food security are creating a sustained need for improved agricultural productivity, driving demand for advanced farm equipment. Increased mechanization reduces labor costs and improves operational efficiency, leading farmers to upgrade their equipment. However, challenges remain; fluctuating commodity prices, economic uncertainties, and the initial high cost of advanced technologies can hinder market expansion. The market is segmented across various machinery types, including plowing and cultivating, planting, harvesting, haying and forage, and irrigation equipment. Each segment exhibits unique growth trajectories, with precision planting and harvesting machinery experiencing particularly strong demand. Leading players like Deere & Company, AGCO, and Kubota continue to innovate and expand their market share through product diversification and strategic partnerships. Regional variations in market growth are expected, with the Midwest, given its significant agricultural production, likely to maintain a leading position.
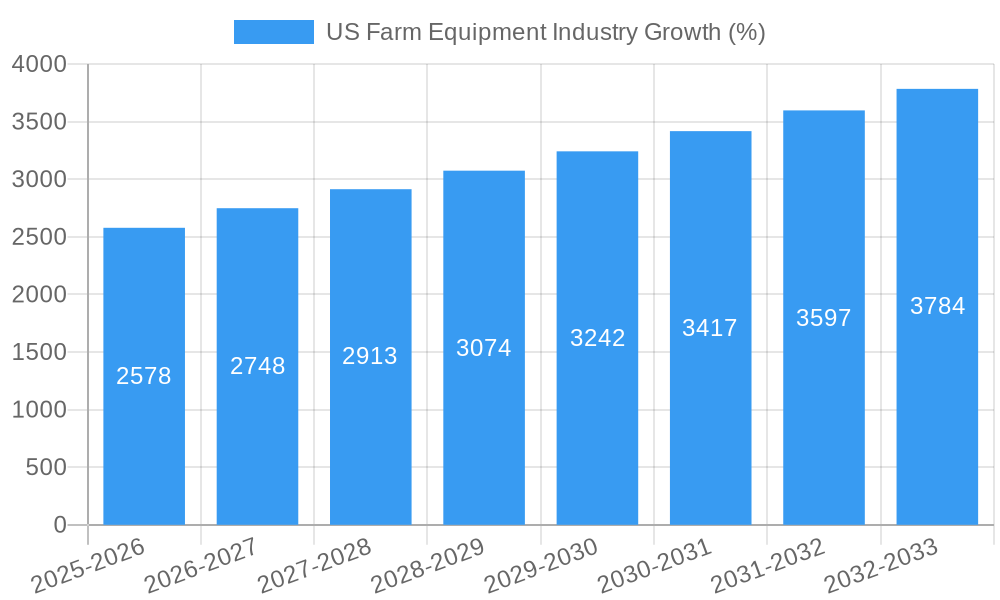
The forecast period (2025-2033) anticipates a Compound Annual Growth Rate (CAGR) of 6.30%, indicating a continuously expanding market. This growth will likely be influenced by factors such as the increasing adoption of sustainable farming practices, advancements in automation and robotics in agricultural machinery, and government support for agricultural modernization. Competition amongst established players and emerging technology providers will intensify, leading to product innovation and potentially more affordable equipment for smaller farms. While economic downturns could temporarily impact investment in new equipment, the long-term trend points towards a sustained upward trajectory for the US farm equipment market, driven by the fundamental need for efficient and productive food production.
US Farm Equipment Industry Market Report: 2019-2033
This comprehensive report provides a detailed analysis of the US farm equipment industry, covering market dynamics, growth trends, key players, and future outlook. With a focus on both parent and child markets, this report is an invaluable resource for industry professionals, investors, and strategic decision-makers. The study period spans 2019-2033, with 2025 as the base and estimated year.
Study Period: 2019-2033 Base Year: 2025 Estimated Year: 2025 Forecast Period: 2025-2033 Historical Period: 2019-2024
US Farm Equipment Industry Market Dynamics & Structure
The US farm equipment market is characterized by a moderately concentrated structure, with several major players holding significant market share. Technological innovation is a crucial driver, particularly in areas like automation, precision agriculture, and data analytics. Stringent regulatory frameworks concerning emissions and safety standards significantly impact equipment design and manufacturing. The market also faces competition from substitute technologies, such as drone-based crop spraying and alternative irrigation systems. End-user demographics are shifting towards larger, more technologically sophisticated farms, driving demand for advanced equipment. Mergers and acquisitions (M&A) activity has been relatively high in recent years, reflecting industry consolidation and the pursuit of technological capabilities.
- Market Concentration: The top 5 players hold approximately xx% of the market share in 2025 (estimated).
- Technological Innovation: Focus on automation, precision agriculture, and data-driven solutions.
- Regulatory Landscape: Stringent emission standards and safety regulations.
- Competitive Substitutes: Drone technology, alternative irrigation methods.
- End-User Demographics: Shift towards larger, technologically advanced farms.
- M&A Activity: xx major deals in the past 5 years, with a total value of approximately $xx million.
US Farm Equipment Industry Growth Trends & Insights
The US farm equipment market experienced a period of growth from 2019 to 2024, followed by a slight dip in 2024 due to [insert reason for dip e.g., global supply chain disruptions, economic slowdown]. However, the market is projected to resume its upward trajectory with a Compound Annual Growth Rate (CAGR) of xx% during the forecast period (2025-2033), reaching a market size of $xx million by 2033. This growth is driven by factors such as increasing farm sizes, rising demand for higher yields, and the adoption of advanced technologies to enhance efficiency and productivity. The penetration rate of precision farming technologies is expected to increase significantly, with a projected xx% adoption rate by 2033. Consumer behavior is evolving towards data-driven decision-making, leading to increased adoption of equipment with integrated data analytics capabilities.
Dominant Regions, Countries, or Segments in US Farm Equipment Industry
The Midwest region of the US consistently dominates the farm equipment market, driven by its extensive arable land and high agricultural output. Within the product segments, the Planting Machinery segment (seed drills, planters, spreaders) exhibits strong growth potential due to increasing demand for high-precision planting techniques. The Harvesting Machinery segment (combine harvesters, forage harvesters) is also a significant contributor, driven by the need for efficient and timely harvesting of crops.
- Key Growth Drivers:
- Midwest Region: High agricultural output and extensive arable land.
- Planting Machinery: High demand for precision planting techniques.
- Harvesting Machinery: Need for efficient and timely crop harvesting.
- Government Subsidies: Agricultural support programs stimulate equipment purchases.
- Favorable Weather Conditions: Positive impact on crop yields and equipment demand.
US Farm Equipment Industry Product Landscape
The US farm equipment market features a diverse range of products, from traditional tillage tools to sophisticated autonomous systems. Recent innovations include GPS-guided machinery, automated planting and harvesting systems, and data analytics platforms for precise crop management. These advancements enhance efficiency, reduce labor costs, and improve yields. Unique selling propositions include improved accuracy, reduced fuel consumption, and enhanced operational safety.
Key Drivers, Barriers & Challenges in US Farm Equipment Industry
Key Drivers:
- Technological advancements in automation and precision agriculture.
- Increasing demand for higher crop yields and efficiency.
- Government support programs and subsidies for agricultural technology adoption.
Key Challenges:
- High initial investment costs for advanced equipment.
- Supply chain disruptions and component shortages.
- Competition from overseas manufacturers.
- Stringent environmental regulations. The impact of these challenges translates to an estimated xx% reduction in market growth over the next five years.
Emerging Opportunities in US Farm Equipment Industry
- Growing adoption of precision agriculture and data analytics.
- Increasing demand for sustainable and environmentally friendly farming practices.
- Development of autonomous and robotic farm equipment.
- Expansion into niche markets, such as vertical farming and indoor agriculture.
Growth Accelerators in the US Farm Equipment Industry
Technological breakthroughs in automation, AI, and robotics will continue to accelerate market growth. Strategic partnerships between equipment manufacturers and technology companies will drive innovation. Expansion into new markets, such as organic farming and sustainable agriculture, will also contribute to market growth.
Key Players Shaping the US Farm Equipment Industry Market
- Kverneland Group
- JOST Werke AG (Alo)
- Kuhn Group Inc
- Deere and Company
- KUBOTA Corporation
- CNH Industrial
- Farmtrac Tractor Europe
- AGCO Corporation
- Deutz-Fahr
- Mahindra Agriculture North America
- Claas KGaA mbH
Notable Milestones in US Farm Equipment Industry Sector
- December 2022: CNH Industrial launched new automation and autonomy solutions, enhancing productivity and addressing farmers' challenges.
- May 2022: AGCO acquired JCA Industries, bolstering its engineering and software development capabilities for automated machinery.
- April 2022: Deere & Company and GUSS Automation formed a joint venture for semi-autonomous sprayers.
In-Depth US Farm Equipment Industry Market Outlook
The US farm equipment market is poised for continued growth, driven by technological advancements, increasing demand for higher yields, and government support. Strategic partnerships and investments in research and development will further accelerate this growth. The market presents significant opportunities for companies that can offer innovative, efficient, and sustainable solutions to meet the evolving needs of the agricultural sector.
US Farm Equipment Industry Segmentation
- 1. Production Analysis
- 2. Consumption Analysis
- 3. Import Market Analysis (Value & Volume)
- 4. Export Market Analysis (Value & Volume)
- 5. Price Trend Analysis
US Farm Equipment Industry Segmentation By Geography
-
1. North America
- 1.1. United States
- 1.2. Canada
- 1.3. Mexico
-
2. South America
- 2.1. Brazil
- 2.2. Argentina
- 2.3. Rest of South America
-
3. Europe
- 3.1. United Kingdom
- 3.2. Germany
- 3.3. France
- 3.4. Italy
- 3.5. Spain
- 3.6. Russia
- 3.7. Benelux
- 3.8. Nordics
- 3.9. Rest of Europe
-
4. Middle East & Africa
- 4.1. Turkey
- 4.2. Israel
- 4.3. GCC
- 4.4. North Africa
- 4.5. South Africa
- 4.6. Rest of Middle East & Africa
-
5. Asia Pacific
- 5.1. China
- 5.2. India
- 5.3. Japan
- 5.4. South Korea
- 5.5. ASEAN
- 5.6. Oceania
- 5.7. Rest of Asia Pacific
US Farm Equipment Industry REPORT HIGHLIGHTS
| Aspects | Details |
|---|---|
| Study Period | 2019-2033 |
| Base Year | 2024 |
| Estimated Year | 2025 |
| Forecast Period | 2025-2033 |
| Historical Period | 2019-2024 |
| Growth Rate | CAGR of 6.30% from 2019-2033 |
| Segmentation |
|
Table of Contents
- 1. Introduction
- 1.1. Research Scope
- 1.2. Market Segmentation
- 1.3. Research Methodology
- 1.4. Definitions and Assumptions
- 2. Executive Summary
- 2.1. Introduction
- 3. Market Dynamics
- 3.1. Introduction
- 3.2. Market Drivers
- 3.2.1. Low Availability of Skilled Labor; Technological Advancements
- 3.3. Market Restrains
- 3.3.1. Increasing Farm Expenditure; Security Concerns in Modern Farming Machinery
- 3.4. Market Trends
- 3.4.1. Increasing Average Farm Size
- 4. Market Factor Analysis
- 4.1. Porters Five Forces
- 4.2. Supply/Value Chain
- 4.3. PESTEL analysis
- 4.4. Market Entropy
- 4.5. Patent/Trademark Analysis
- 5. Global US Farm Equipment Industry Analysis, Insights and Forecast, 2019-2031
- 5.1. Market Analysis, Insights and Forecast - by Production Analysis
- 5.2. Market Analysis, Insights and Forecast - by Consumption Analysis
- 5.3. Market Analysis, Insights and Forecast - by Import Market Analysis (Value & Volume)
- 5.4. Market Analysis, Insights and Forecast - by Export Market Analysis (Value & Volume)
- 5.5. Market Analysis, Insights and Forecast - by Price Trend Analysis
- 5.6. Market Analysis, Insights and Forecast - by Region
- 5.6.1. North America
- 5.6.2. South America
- 5.6.3. Europe
- 5.6.4. Middle East & Africa
- 5.6.5. Asia Pacific
- 5.1. Market Analysis, Insights and Forecast - by Production Analysis
- 6. North America US Farm Equipment Industry Analysis, Insights and Forecast, 2019-2031
- 6.1. Market Analysis, Insights and Forecast - by Production Analysis
- 6.2. Market Analysis, Insights and Forecast - by Consumption Analysis
- 6.3. Market Analysis, Insights and Forecast - by Import Market Analysis (Value & Volume)
- 6.4. Market Analysis, Insights and Forecast - by Export Market Analysis (Value & Volume)
- 6.5. Market Analysis, Insights and Forecast - by Price Trend Analysis
- 6.1. Market Analysis, Insights and Forecast - by Production Analysis
- 7. South America US Farm Equipment Industry Analysis, Insights and Forecast, 2019-2031
- 7.1. Market Analysis, Insights and Forecast - by Production Analysis
- 7.2. Market Analysis, Insights and Forecast - by Consumption Analysis
- 7.3. Market Analysis, Insights and Forecast - by Import Market Analysis (Value & Volume)
- 7.4. Market Analysis, Insights and Forecast - by Export Market Analysis (Value & Volume)
- 7.5. Market Analysis, Insights and Forecast - by Price Trend Analysis
- 7.1. Market Analysis, Insights and Forecast - by Production Analysis
- 8. Europe US Farm Equipment Industry Analysis, Insights and Forecast, 2019-2031
- 8.1. Market Analysis, Insights and Forecast - by Production Analysis
- 8.2. Market Analysis, Insights and Forecast - by Consumption Analysis
- 8.3. Market Analysis, Insights and Forecast - by Import Market Analysis (Value & Volume)
- 8.4. Market Analysis, Insights and Forecast - by Export Market Analysis (Value & Volume)
- 8.5. Market Analysis, Insights and Forecast - by Price Trend Analysis
- 8.1. Market Analysis, Insights and Forecast - by Production Analysis
- 9. Middle East & Africa US Farm Equipment Industry Analysis, Insights and Forecast, 2019-2031
- 9.1. Market Analysis, Insights and Forecast - by Production Analysis
- 9.2. Market Analysis, Insights and Forecast - by Consumption Analysis
- 9.3. Market Analysis, Insights and Forecast - by Import Market Analysis (Value & Volume)
- 9.4. Market Analysis, Insights and Forecast - by Export Market Analysis (Value & Volume)
- 9.5. Market Analysis, Insights and Forecast - by Price Trend Analysis
- 9.1. Market Analysis, Insights and Forecast - by Production Analysis
- 10. Asia Pacific US Farm Equipment Industry Analysis, Insights and Forecast, 2019-2031
- 10.1. Market Analysis, Insights and Forecast - by Production Analysis
- 10.2. Market Analysis, Insights and Forecast - by Consumption Analysis
- 10.3. Market Analysis, Insights and Forecast - by Import Market Analysis (Value & Volume)
- 10.4. Market Analysis, Insights and Forecast - by Export Market Analysis (Value & Volume)
- 10.5. Market Analysis, Insights and Forecast - by Price Trend Analysis
- 10.1. Market Analysis, Insights and Forecast - by Production Analysis
- 11. Northeast US Farm Equipment Industry Analysis, Insights and Forecast, 2019-2031
- 12. Southeast US Farm Equipment Industry Analysis, Insights and Forecast, 2019-2031
- 13. Midwest US Farm Equipment Industry Analysis, Insights and Forecast, 2019-2031
- 14. Southwest US Farm Equipment Industry Analysis, Insights and Forecast, 2019-2031
- 15. West US Farm Equipment Industry Analysis, Insights and Forecast, 2019-2031
- 16. Competitive Analysis
- 16.1. Global Market Share Analysis 2024
- 16.2. Company Profiles
- 16.2.1 Kverneland Grou
- 16.2.1.1. Overview
- 16.2.1.2. Products
- 16.2.1.3. SWOT Analysis
- 16.2.1.4. Recent Developments
- 16.2.1.5. Financials (Based on Availability)
- 16.2.2 JOST Werke AG (Alo)
- 16.2.2.1. Overview
- 16.2.2.2. Products
- 16.2.2.3. SWOT Analysis
- 16.2.2.4. Recent Developments
- 16.2.2.5. Financials (Based on Availability)
- 16.2.3 Kuhn Group Inc
- 16.2.3.1. Overview
- 16.2.3.2. Products
- 16.2.3.3. SWOT Analysis
- 16.2.3.4. Recent Developments
- 16.2.3.5. Financials (Based on Availability)
- 16.2.4 Deere and Company
- 16.2.4.1. Overview
- 16.2.4.2. Products
- 16.2.4.3. SWOT Analysis
- 16.2.4.4. Recent Developments
- 16.2.4.5. Financials (Based on Availability)
- 16.2.5 KUBOTA Corporation
- 16.2.5.1. Overview
- 16.2.5.2. Products
- 16.2.5.3. SWOT Analysis
- 16.2.5.4. Recent Developments
- 16.2.5.5. Financials (Based on Availability)
- 16.2.6 CNH Industrial
- 16.2.6.1. Overview
- 16.2.6.2. Products
- 16.2.6.3. SWOT Analysis
- 16.2.6.4. Recent Developments
- 16.2.6.5. Financials (Based on Availability)
- 16.2.7 Farmtrac Tractor Europe
- 16.2.7.1. Overview
- 16.2.7.2. Products
- 16.2.7.3. SWOT Analysis
- 16.2.7.4. Recent Developments
- 16.2.7.5. Financials (Based on Availability)
- 16.2.8 AGCO Corporation
- 16.2.8.1. Overview
- 16.2.8.2. Products
- 16.2.8.3. SWOT Analysis
- 16.2.8.4. Recent Developments
- 16.2.8.5. Financials (Based on Availability)
- 16.2.9 Deutz-Fahr
- 16.2.9.1. Overview
- 16.2.9.2. Products
- 16.2.9.3. SWOT Analysis
- 16.2.9.4. Recent Developments
- 16.2.9.5. Financials (Based on Availability)
- 16.2.10 Mahindra Agriculture North America
- 16.2.10.1. Overview
- 16.2.10.2. Products
- 16.2.10.3. SWOT Analysis
- 16.2.10.4. Recent Developments
- 16.2.10.5. Financials (Based on Availability)
- 16.2.11 Claas KGaA mbH
- 16.2.11.1. Overview
- 16.2.11.2. Products
- 16.2.11.3. SWOT Analysis
- 16.2.11.4. Recent Developments
- 16.2.11.5. Financials (Based on Availability)
- 16.2.1 Kverneland Grou
List of Figures
- Figure 1: Global US Farm Equipment Industry Revenue Breakdown (Million, %) by Region 2024 & 2032
- Figure 2: United states US Farm Equipment Industry Revenue (Million), by Country 2024 & 2032
- Figure 3: United states US Farm Equipment Industry Revenue Share (%), by Country 2024 & 2032
- Figure 4: North America US Farm Equipment Industry Revenue (Million), by Production Analysis 2024 & 2032
- Figure 5: North America US Farm Equipment Industry Revenue Share (%), by Production Analysis 2024 & 2032
- Figure 6: North America US Farm Equipment Industry Revenue (Million), by Consumption Analysis 2024 & 2032
- Figure 7: North America US Farm Equipment Industry Revenue Share (%), by Consumption Analysis 2024 & 2032
- Figure 8: North America US Farm Equipment Industry Revenue (Million), by Import Market Analysis (Value & Volume) 2024 & 2032
- Figure 9: North America US Farm Equipment Industry Revenue Share (%), by Import Market Analysis (Value & Volume) 2024 & 2032
- Figure 10: North America US Farm Equipment Industry Revenue (Million), by Export Market Analysis (Value & Volume) 2024 & 2032
- Figure 11: North America US Farm Equipment Industry Revenue Share (%), by Export Market Analysis (Value & Volume) 2024 & 2032
- Figure 12: North America US Farm Equipment Industry Revenue (Million), by Price Trend Analysis 2024 & 2032
- Figure 13: North America US Farm Equipment Industry Revenue Share (%), by Price Trend Analysis 2024 & 2032
- Figure 14: North America US Farm Equipment Industry Revenue (Million), by Country 2024 & 2032
- Figure 15: North America US Farm Equipment Industry Revenue Share (%), by Country 2024 & 2032
- Figure 16: South America US Farm Equipment Industry Revenue (Million), by Production Analysis 2024 & 2032
- Figure 17: South America US Farm Equipment Industry Revenue Share (%), by Production Analysis 2024 & 2032
- Figure 18: South America US Farm Equipment Industry Revenue (Million), by Consumption Analysis 2024 & 2032
- Figure 19: South America US Farm Equipment Industry Revenue Share (%), by Consumption Analysis 2024 & 2032
- Figure 20: South America US Farm Equipment Industry Revenue (Million), by Import Market Analysis (Value & Volume) 2024 & 2032
- Figure 21: South America US Farm Equipment Industry Revenue Share (%), by Import Market Analysis (Value & Volume) 2024 & 2032
- Figure 22: South America US Farm Equipment Industry Revenue (Million), by Export Market Analysis (Value & Volume) 2024 & 2032
- Figure 23: South America US Farm Equipment Industry Revenue Share (%), by Export Market Analysis (Value & Volume) 2024 & 2032
- Figure 24: South America US Farm Equipment Industry Revenue (Million), by Price Trend Analysis 2024 & 2032
- Figure 25: South America US Farm Equipment Industry Revenue Share (%), by Price Trend Analysis 2024 & 2032
- Figure 26: South America US Farm Equipment Industry Revenue (Million), by Country 2024 & 2032
- Figure 27: South America US Farm Equipment Industry Revenue Share (%), by Country 2024 & 2032
- Figure 28: Europe US Farm Equipment Industry Revenue (Million), by Production Analysis 2024 & 2032
- Figure 29: Europe US Farm Equipment Industry Revenue Share (%), by Production Analysis 2024 & 2032
- Figure 30: Europe US Farm Equipment Industry Revenue (Million), by Consumption Analysis 2024 & 2032
- Figure 31: Europe US Farm Equipment Industry Revenue Share (%), by Consumption Analysis 2024 & 2032
- Figure 32: Europe US Farm Equipment Industry Revenue (Million), by Import Market Analysis (Value & Volume) 2024 & 2032
- Figure 33: Europe US Farm Equipment Industry Revenue Share (%), by Import Market Analysis (Value & Volume) 2024 & 2032
- Figure 34: Europe US Farm Equipment Industry Revenue (Million), by Export Market Analysis (Value & Volume) 2024 & 2032
- Figure 35: Europe US Farm Equipment Industry Revenue Share (%), by Export Market Analysis (Value & Volume) 2024 & 2032
- Figure 36: Europe US Farm Equipment Industry Revenue (Million), by Price Trend Analysis 2024 & 2032
- Figure 37: Europe US Farm Equipment Industry Revenue Share (%), by Price Trend Analysis 2024 & 2032
- Figure 38: Europe US Farm Equipment Industry Revenue (Million), by Country 2024 & 2032
- Figure 39: Europe US Farm Equipment Industry Revenue Share (%), by Country 2024 & 2032
- Figure 40: Middle East & Africa US Farm Equipment Industry Revenue (Million), by Production Analysis 2024 & 2032
- Figure 41: Middle East & Africa US Farm Equipment Industry Revenue Share (%), by Production Analysis 2024 & 2032
- Figure 42: Middle East & Africa US Farm Equipment Industry Revenue (Million), by Consumption Analysis 2024 & 2032
- Figure 43: Middle East & Africa US Farm Equipment Industry Revenue Share (%), by Consumption Analysis 2024 & 2032
- Figure 44: Middle East & Africa US Farm Equipment Industry Revenue (Million), by Import Market Analysis (Value & Volume) 2024 & 2032
- Figure 45: Middle East & Africa US Farm Equipment Industry Revenue Share (%), by Import Market Analysis (Value & Volume) 2024 & 2032
- Figure 46: Middle East & Africa US Farm Equipment Industry Revenue (Million), by Export Market Analysis (Value & Volume) 2024 & 2032
- Figure 47: Middle East & Africa US Farm Equipment Industry Revenue Share (%), by Export Market Analysis (Value & Volume) 2024 & 2032
- Figure 48: Middle East & Africa US Farm Equipment Industry Revenue (Million), by Price Trend Analysis 2024 & 2032
- Figure 49: Middle East & Africa US Farm Equipment Industry Revenue Share (%), by Price Trend Analysis 2024 & 2032
- Figure 50: Middle East & Africa US Farm Equipment Industry Revenue (Million), by Country 2024 & 2032
- Figure 51: Middle East & Africa US Farm Equipment Industry Revenue Share (%), by Country 2024 & 2032
- Figure 52: Asia Pacific US Farm Equipment Industry Revenue (Million), by Production Analysis 2024 & 2032
- Figure 53: Asia Pacific US Farm Equipment Industry Revenue Share (%), by Production Analysis 2024 & 2032
- Figure 54: Asia Pacific US Farm Equipment Industry Revenue (Million), by Consumption Analysis 2024 & 2032
- Figure 55: Asia Pacific US Farm Equipment Industry Revenue Share (%), by Consumption Analysis 2024 & 2032
- Figure 56: Asia Pacific US Farm Equipment Industry Revenue (Million), by Import Market Analysis (Value & Volume) 2024 & 2032
- Figure 57: Asia Pacific US Farm Equipment Industry Revenue Share (%), by Import Market Analysis (Value & Volume) 2024 & 2032
- Figure 58: Asia Pacific US Farm Equipment Industry Revenue (Million), by Export Market Analysis (Value & Volume) 2024 & 2032
- Figure 59: Asia Pacific US Farm Equipment Industry Revenue Share (%), by Export Market Analysis (Value & Volume) 2024 & 2032
- Figure 60: Asia Pacific US Farm Equipment Industry Revenue (Million), by Price Trend Analysis 2024 & 2032
- Figure 61: Asia Pacific US Farm Equipment Industry Revenue Share (%), by Price Trend Analysis 2024 & 2032
- Figure 62: Asia Pacific US Farm Equipment Industry Revenue (Million), by Country 2024 & 2032
- Figure 63: Asia Pacific US Farm Equipment Industry Revenue Share (%), by Country 2024 & 2032
List of Tables
- Table 1: Global US Farm Equipment Industry Revenue Million Forecast, by Region 2019 & 2032
- Table 2: Global US Farm Equipment Industry Revenue Million Forecast, by Production Analysis 2019 & 2032
- Table 3: Global US Farm Equipment Industry Revenue Million Forecast, by Consumption Analysis 2019 & 2032
- Table 4: Global US Farm Equipment Industry Revenue Million Forecast, by Import Market Analysis (Value & Volume) 2019 & 2032
- Table 5: Global US Farm Equipment Industry Revenue Million Forecast, by Export Market Analysis (Value & Volume) 2019 & 2032
- Table 6: Global US Farm Equipment Industry Revenue Million Forecast, by Price Trend Analysis 2019 & 2032
- Table 7: Global US Farm Equipment Industry Revenue Million Forecast, by Region 2019 & 2032
- Table 8: Global US Farm Equipment Industry Revenue Million Forecast, by Country 2019 & 2032
- Table 9: Northeast US Farm Equipment Industry Revenue (Million) Forecast, by Application 2019 & 2032
- Table 10: Southeast US Farm Equipment Industry Revenue (Million) Forecast, by Application 2019 & 2032
- Table 11: Midwest US Farm Equipment Industry Revenue (Million) Forecast, by Application 2019 & 2032
- Table 12: Southwest US Farm Equipment Industry Revenue (Million) Forecast, by Application 2019 & 2032
- Table 13: West US Farm Equipment Industry Revenue (Million) Forecast, by Application 2019 & 2032
- Table 14: Global US Farm Equipment Industry Revenue Million Forecast, by Production Analysis 2019 & 2032
- Table 15: Global US Farm Equipment Industry Revenue Million Forecast, by Consumption Analysis 2019 & 2032
- Table 16: Global US Farm Equipment Industry Revenue Million Forecast, by Import Market Analysis (Value & Volume) 2019 & 2032
- Table 17: Global US Farm Equipment Industry Revenue Million Forecast, by Export Market Analysis (Value & Volume) 2019 & 2032
- Table 18: Global US Farm Equipment Industry Revenue Million Forecast, by Price Trend Analysis 2019 & 2032
- Table 19: Global US Farm Equipment Industry Revenue Million Forecast, by Country 2019 & 2032
- Table 20: United States US Farm Equipment Industry Revenue (Million) Forecast, by Application 2019 & 2032
- Table 21: Canada US Farm Equipment Industry Revenue (Million) Forecast, by Application 2019 & 2032
- Table 22: Mexico US Farm Equipment Industry Revenue (Million) Forecast, by Application 2019 & 2032
- Table 23: Global US Farm Equipment Industry Revenue Million Forecast, by Production Analysis 2019 & 2032
- Table 24: Global US Farm Equipment Industry Revenue Million Forecast, by Consumption Analysis 2019 & 2032
- Table 25: Global US Farm Equipment Industry Revenue Million Forecast, by Import Market Analysis (Value & Volume) 2019 & 2032
- Table 26: Global US Farm Equipment Industry Revenue Million Forecast, by Export Market Analysis (Value & Volume) 2019 & 2032
- Table 27: Global US Farm Equipment Industry Revenue Million Forecast, by Price Trend Analysis 2019 & 2032
- Table 28: Global US Farm Equipment Industry Revenue Million Forecast, by Country 2019 & 2032
- Table 29: Brazil US Farm Equipment Industry Revenue (Million) Forecast, by Application 2019 & 2032
- Table 30: Argentina US Farm Equipment Industry Revenue (Million) Forecast, by Application 2019 & 2032
- Table 31: Rest of South America US Farm Equipment Industry Revenue (Million) Forecast, by Application 2019 & 2032
- Table 32: Global US Farm Equipment Industry Revenue Million Forecast, by Production Analysis 2019 & 2032
- Table 33: Global US Farm Equipment Industry Revenue Million Forecast, by Consumption Analysis 2019 & 2032
- Table 34: Global US Farm Equipment Industry Revenue Million Forecast, by Import Market Analysis (Value & Volume) 2019 & 2032
- Table 35: Global US Farm Equipment Industry Revenue Million Forecast, by Export Market Analysis (Value & Volume) 2019 & 2032
- Table 36: Global US Farm Equipment Industry Revenue Million Forecast, by Price Trend Analysis 2019 & 2032
- Table 37: Global US Farm Equipment Industry Revenue Million Forecast, by Country 2019 & 2032
- Table 38: United Kingdom US Farm Equipment Industry Revenue (Million) Forecast, by Application 2019 & 2032
- Table 39: Germany US Farm Equipment Industry Revenue (Million) Forecast, by Application 2019 & 2032
- Table 40: France US Farm Equipment Industry Revenue (Million) Forecast, by Application 2019 & 2032
- Table 41: Italy US Farm Equipment Industry Revenue (Million) Forecast, by Application 2019 & 2032
- Table 42: Spain US Farm Equipment Industry Revenue (Million) Forecast, by Application 2019 & 2032
- Table 43: Russia US Farm Equipment Industry Revenue (Million) Forecast, by Application 2019 & 2032
- Table 44: Benelux US Farm Equipment Industry Revenue (Million) Forecast, by Application 2019 & 2032
- Table 45: Nordics US Farm Equipment Industry Revenue (Million) Forecast, by Application 2019 & 2032
- Table 46: Rest of Europe US Farm Equipment Industry Revenue (Million) Forecast, by Application 2019 & 2032
- Table 47: Global US Farm Equipment Industry Revenue Million Forecast, by Production Analysis 2019 & 2032
- Table 48: Global US Farm Equipment Industry Revenue Million Forecast, by Consumption Analysis 2019 & 2032
- Table 49: Global US Farm Equipment Industry Revenue Million Forecast, by Import Market Analysis (Value & Volume) 2019 & 2032
- Table 50: Global US Farm Equipment Industry Revenue Million Forecast, by Export Market Analysis (Value & Volume) 2019 & 2032
- Table 51: Global US Farm Equipment Industry Revenue Million Forecast, by Price Trend Analysis 2019 & 2032
- Table 52: Global US Farm Equipment Industry Revenue Million Forecast, by Country 2019 & 2032
- Table 53: Turkey US Farm Equipment Industry Revenue (Million) Forecast, by Application 2019 & 2032
- Table 54: Israel US Farm Equipment Industry Revenue (Million) Forecast, by Application 2019 & 2032
- Table 55: GCC US Farm Equipment Industry Revenue (Million) Forecast, by Application 2019 & 2032
- Table 56: North Africa US Farm Equipment Industry Revenue (Million) Forecast, by Application 2019 & 2032
- Table 57: South Africa US Farm Equipment Industry Revenue (Million) Forecast, by Application 2019 & 2032
- Table 58: Rest of Middle East & Africa US Farm Equipment Industry Revenue (Million) Forecast, by Application 2019 & 2032
- Table 59: Global US Farm Equipment Industry Revenue Million Forecast, by Production Analysis 2019 & 2032
- Table 60: Global US Farm Equipment Industry Revenue Million Forecast, by Consumption Analysis 2019 & 2032
- Table 61: Global US Farm Equipment Industry Revenue Million Forecast, by Import Market Analysis (Value & Volume) 2019 & 2032
- Table 62: Global US Farm Equipment Industry Revenue Million Forecast, by Export Market Analysis (Value & Volume) 2019 & 2032
- Table 63: Global US Farm Equipment Industry Revenue Million Forecast, by Price Trend Analysis 2019 & 2032
- Table 64: Global US Farm Equipment Industry Revenue Million Forecast, by Country 2019 & 2032
- Table 65: China US Farm Equipment Industry Revenue (Million) Forecast, by Application 2019 & 2032
- Table 66: India US Farm Equipment Industry Revenue (Million) Forecast, by Application 2019 & 2032
- Table 67: Japan US Farm Equipment Industry Revenue (Million) Forecast, by Application 2019 & 2032
- Table 68: South Korea US Farm Equipment Industry Revenue (Million) Forecast, by Application 2019 & 2032
- Table 69: ASEAN US Farm Equipment Industry Revenue (Million) Forecast, by Application 2019 & 2032
- Table 70: Oceania US Farm Equipment Industry Revenue (Million) Forecast, by Application 2019 & 2032
- Table 71: Rest of Asia Pacific US Farm Equipment Industry Revenue (Million) Forecast, by Application 2019 & 2032
Frequently Asked Questions
1. What is the projected Compound Annual Growth Rate (CAGR) of the US Farm Equipment Industry?
The projected CAGR is approximately 6.30%.
2. Which companies are prominent players in the US Farm Equipment Industry?
Key companies in the market include Kverneland Grou, JOST Werke AG (Alo), Kuhn Group Inc, Deere and Company, KUBOTA Corporation, CNH Industrial, Farmtrac Tractor Europe, AGCO Corporation, Deutz-Fahr, Mahindra Agriculture North America, Claas KGaA mbH.
3. What are the main segments of the US Farm Equipment Industry?
The market segments include Production Analysis, Consumption Analysis, Import Market Analysis (Value & Volume), Export Market Analysis (Value & Volume), Price Trend Analysis.
4. Can you provide details about the market size?
The market size is estimated to be USD 39.56 Million as of 2022.
5. What are some drivers contributing to market growth?
Low Availability of Skilled Labor; Technological Advancements.
6. What are the notable trends driving market growth?
Increasing Average Farm Size.
7. Are there any restraints impacting market growth?
Increasing Farm Expenditure; Security Concerns in Modern Farming Machinery.
8. Can you provide examples of recent developments in the market?
December 2022: CNH Industrial added new Automation and Autonomy Solutions to the Ag Tech portfolio in Phoenix, Arizona, and the USA. These New Driverless Tillage and Driver Assist Harvest solutions from Raven, and Baler Automation from Case IH and New Holland, can deliver automation and autonomous equipment enhancements and help solve farmers' most significant challenges to increasing productivity.
9. What pricing options are available for accessing the report?
Pricing options include single-user, multi-user, and enterprise licenses priced at USD 3800, USD 4500, and USD 5800 respectively.
10. Is the market size provided in terms of value or volume?
The market size is provided in terms of value, measured in Million.
11. Are there any specific market keywords associated with the report?
Yes, the market keyword associated with the report is "US Farm Equipment Industry," which aids in identifying and referencing the specific market segment covered.
12. How do I determine which pricing option suits my needs best?
The pricing options vary based on user requirements and access needs. Individual users may opt for single-user licenses, while businesses requiring broader access may choose multi-user or enterprise licenses for cost-effective access to the report.
13. Are there any additional resources or data provided in the US Farm Equipment Industry report?
While the report offers comprehensive insights, it's advisable to review the specific contents or supplementary materials provided to ascertain if additional resources or data are available.
14. How can I stay updated on further developments or reports in the US Farm Equipment Industry?
To stay informed about further developments, trends, and reports in the US Farm Equipment Industry, consider subscribing to industry newsletters, following relevant companies and organizations, or regularly checking reputable industry news sources and publications.
Methodology
Step 1 - Identification of Relevant Samples Size from Population Database


Step 2 - Approaches for Defining Global Market Size (Value, Volume* & Price*)

Note*: In applicable scenarios
Step 3 - Data Sources
Primary Research
- Web Analytics
- Survey Reports
- Research Institute
- Latest Research Reports
- Opinion Leaders
Secondary Research
- Annual Reports
- White Paper
- Latest Press Release
- Industry Association
- Paid Database
- Investor Presentations

Step 4 - Data Triangulation
Involves using different sources of information in order to increase the validity of a study
These sources are likely to be stakeholders in a program - participants, other researchers, program staff, other community members, and so on.
Then we put all data in single framework & apply various statistical tools to find out the dynamic on the market.
During the analysis stage, feedback from the stakeholder groups would be compared to determine areas of agreement as well as areas of divergence


