

Key Insights
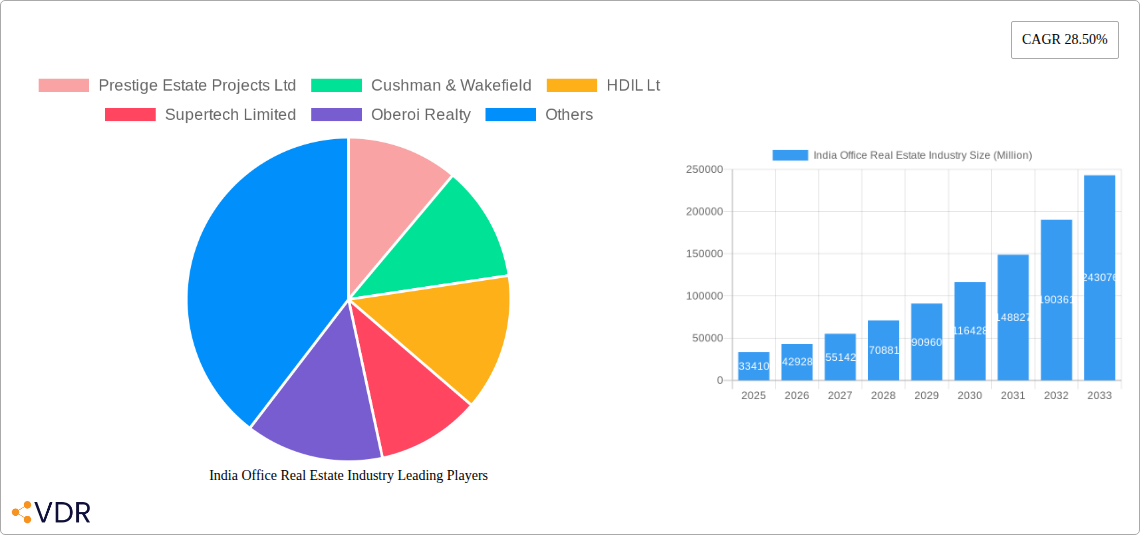
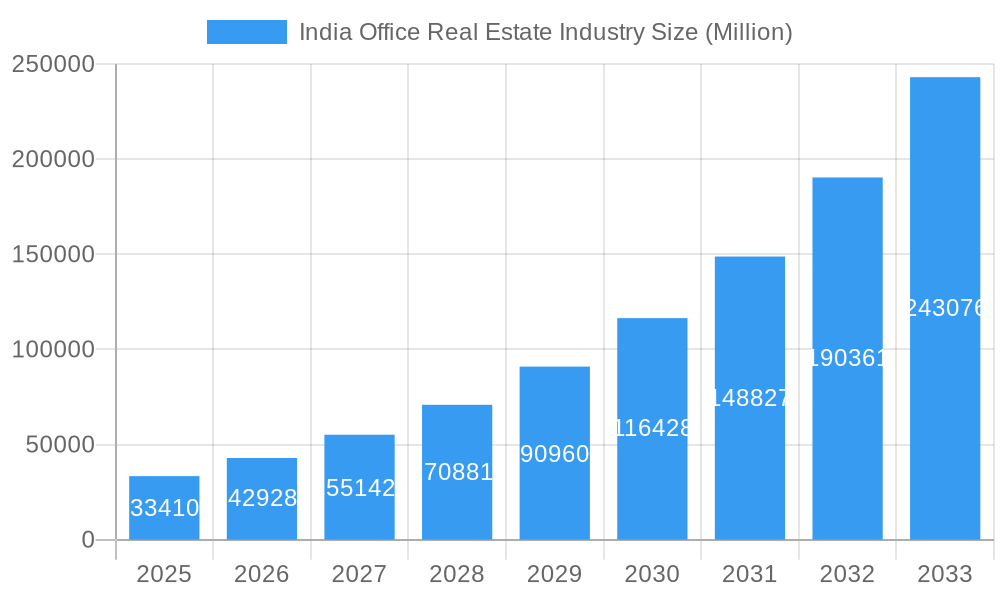
The Indian office real estate market, valued at ₹33.41 billion in 2025, is experiencing robust growth, projected to expand at a compound annual growth rate (CAGR) of 28.50% from 2025 to 2033. This surge is fueled by several key factors. The burgeoning IT and ITeS sectors, particularly concentrated in major cities like Bengaluru, Hyderabad, and Mumbai, are driving significant demand for office spaces. Furthermore, a growing preference for flexible workspaces and co-working hubs, coupled with increasing foreign direct investment (FDI) in the Indian economy, is further propelling market expansion. Strong economic growth and a young, dynamic workforce also contribute to this positive trend. However, challenges remain. The market faces constraints such as fluctuating property prices, limited availability of prime office space in certain key locations, and the potential impact of economic downturns on corporate leasing decisions. Nevertheless, the long-term outlook for the Indian office real estate market remains optimistic, with continued growth anticipated across all major regions – North, South, East, and West India – albeit at varying paces due to regional economic disparities and infrastructure development. The presence of major real estate players like DLF Limited, Prestige Estate Projects Ltd, and others indicates a competitive yet dynamic landscape.
India Office Real Estate Industry Market Size (In Billion)
The segmentation by major cities highlights the concentration of office space demand in metropolitan areas. Bengaluru and Hyderabad, known for their technological hubs, lead the market, while Mumbai, a major financial center, also contributes significantly. While "Other Cities" represent a considerable portion, their growth is expected to be influenced by infrastructure improvements and economic diversification in those regions. The historical period (2019-2024) likely showcased a period of growth that set the stage for the projected expansion, with the base year of 2025 marking a significant milestone. The forecast period (2025-2033) presents a promising investment opportunity, provided careful consideration is given to the identified market constraints and regional variations in growth potential. Continued monitoring of economic indicators and regulatory changes will be crucial for effective market navigation.
India Office Real Estate Industry Company Market Share
India Office Real Estate Industry: A Comprehensive Market Report (2019-2033)
This in-depth report provides a comprehensive analysis of the India office real estate industry, covering market dynamics, growth trends, key players, and future outlook. The study period spans 2019-2033, with 2025 as the base and estimated year. This report is invaluable for investors, developers, real estate professionals, and anyone seeking to understand this dynamic market. It leverages proprietary data and publicly available information to provide a robust forecast.
India Office Real Estate Industry Market Dynamics & Structure
This section analyzes the market concentration, technological advancements, regulatory landscape, competitive dynamics, end-user demographics, and M&A activity within the Indian office real estate sector. The Indian office market is characterized by a moderately concentrated landscape, with a few major players holding significant market share. However, the entry of numerous smaller players is increasing competition. Technological innovation, driven by smart building technologies and data analytics, is transforming the sector, enhancing efficiency and sustainability. Regulatory frameworks, while evolving, continue to play a key role in shaping market development and investment decisions.
- Market Concentration: Top 5 players hold approximately xx% of market share (2024).
- Technological Innovation: Adoption of BIM (Building Information Modeling), IoT (Internet of Things), and smart building technologies is increasing.
- Regulatory Framework: RERA (Real Estate Regulatory Authority) and other regulations influence development and investment.
- Competitive Substitutes: Co-working spaces and flexible office solutions are emerging as alternatives.
- End-User Demographics: A growing IT sector and multinational corporations drive demand in major cities.
- M&A Trends: The number of M&A deals in the sector averaged xx per year during 2019-2024, with deal values totaling xx Million.
India Office Real Estate Industry Growth Trends & Insights
The Indian office real estate market experienced significant growth during the historical period (2019-2024), driven by robust economic growth and increasing urbanization. The market size, valued at xx Million in 2024, is projected to reach xx Million by 2033, exhibiting a Compound Annual Growth Rate (CAGR) of xx%. This growth is fueled by increasing demand from IT/ITeS companies, BFSI (Banking, Financial Services, and Insurance), and other sectors. Technological disruptions, such as the rise of co-working spaces and flexible office solutions, are reshaping consumer preferences and impacting the market dynamics. A shift towards sustainable and technologically advanced office spaces is also observed. Market penetration of smart building technologies is expected to increase from xx% in 2024 to xx% by 2033.
Dominant Regions, Countries, or Segments in India Office Real Estate Industry
Mumbai, Bengaluru, and Hyderabad are the dominant cities driving India's office real estate market growth. Mumbai's established financial hub status and high demand for commercial spaces contributes significantly to its dominance. Bengaluru's IT sector boom drives strong demand for office space, while Hyderabad's growing IT and pharmaceutical sectors also fuel the market.
- Mumbai: Strong financial sector, high demand, established infrastructure. Market share xx% in 2024. Projected growth CAGR of xx% during 2025-2033.
- Bengaluru: IT hub, large talent pool, robust growth in technology companies. Market share xx% in 2024. Projected growth CAGR of xx% during 2025-2033.
- Hyderabad: Growth in IT, pharmaceuticals, and other sectors. Market share xx% in 2024. Projected growth CAGR of xx% during 2025-2033.
- Other Cities: Developing markets show potential, but growth is slower compared to top three.
India Office Real Estate Industry Product Landscape
The Indian office real estate market offers a diverse range of products, catering to varied needs and budgets. From Grade A high-rise buildings in prime locations to more affordable options in suburban areas, the product landscape is constantly evolving. Technological advancements are driving the integration of smart building technologies, enhancing energy efficiency, security, and tenant experience. Unique selling propositions include sustainable features, advanced amenities, and flexible lease terms.
Key Drivers, Barriers & Challenges in India Office Real Estate Industry
Key Drivers: Strong economic growth, urbanization, increasing demand from IT/ITeS and other sectors, government initiatives promoting infrastructure development, and technological advancements are key drivers.
Challenges: High construction costs, land acquisition challenges, regulatory hurdles, and competition from co-working spaces are major challenges. Supply chain disruptions have also impacted project timelines and costs. For example, the increase in steel prices impacted construction costs by xx% in 2022.
Emerging Opportunities in India Office Real Estate Industry
Emerging opportunities include the growth of co-working spaces and flexible office solutions, demand for sustainable and green buildings, technological advancements enhancing building management, and expansion into tier-2 and tier-3 cities. The increasing adoption of hybrid work models also creates new opportunities for flexible office spaces and innovative workspace designs.
Growth Accelerators in the India Office Real Estate Industry Industry
Long-term growth will be driven by continued economic expansion, government initiatives to improve infrastructure, and technological advancements in building design and management. Strategic partnerships between developers and technology companies are crucial for integrating innovative solutions and enhancing the overall tenant experience. Expansion into untapped markets in tier-2 and tier-3 cities presents significant growth potential.
Key Players Shaping the India Office Real Estate Industry Market
- Prestige Estate Projects Ltd
- Cushman & Wakefield
- HDIL Ltd
- Supertech Limited
- Oberoi Realty
- CBRE Group
- Indiabulls Real Estate
- JLL
- Savills
- DLF Limited
Notable Milestones in India Office Real Estate Industry Sector
- October 2022: Colliers International announced plans for over 300 million square feet of commercial office development across six major Indian cities.
- August 2022: Hines Ltd. announced plans for a 9 lakh square feet office building in Mumbai, adding to its existing 1.4 million square feet in Gurugram.
In-Depth India Office Real Estate Industry Market Outlook
The Indian office real estate market is poised for continued growth, driven by sustained economic expansion and increasing demand from various sectors. Strategic investments in infrastructure, technological advancements, and the adoption of sustainable practices will be crucial for long-term success. The market presents significant opportunities for developers, investors, and technology providers who can adapt to changing market dynamics and capitalize on emerging trends. The focus on flexible workspaces and sustainable development will shape the future of the industry.
India Office Real Estate Industry Segmentation
-
1. Major Cities
- 1.1. Bengaluru
- 1.2. Hyderabad
- 1.3. Mumbai
- 1.4. Other Cities
India Office Real Estate Industry Segmentation By Geography
- 1. India
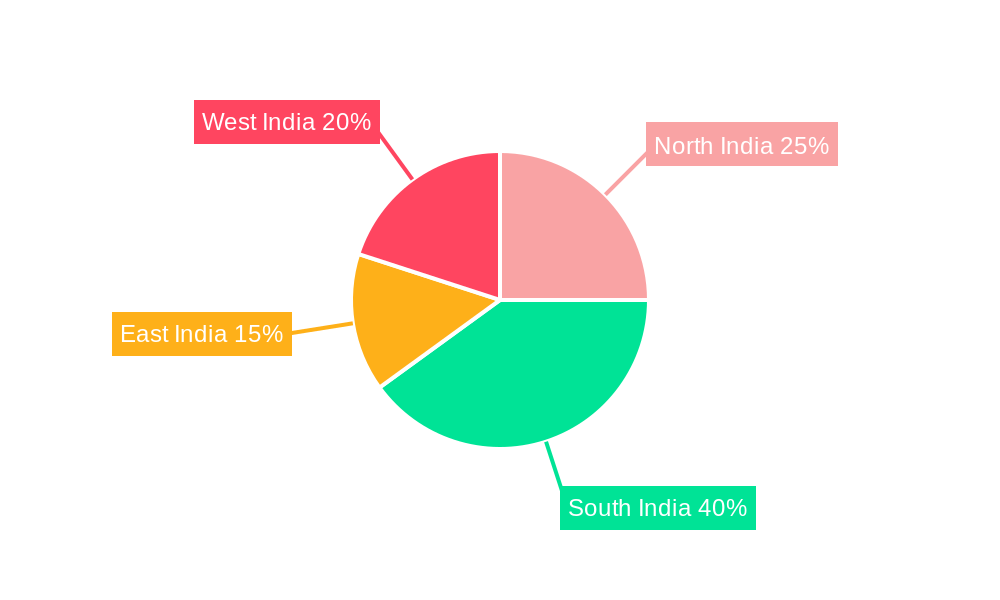
India Office Real Estate Industry Regional Market Share
Geographic Coverage of India Office Real Estate Industry
India Office Real Estate Industry REPORT HIGHLIGHTS
| Aspects | Details |
|---|---|
| Study Period | 2020-2034 |
| Base Year | 2025 |
| Estimated Year | 2026 |
| Forecast Period | 2026-2034 |
| Historical Period | 2020-2025 |
| Growth Rate | CAGR of 28.50% from 2020-2034 |
| Segmentation |
|
Table of Contents
- 1. Introduction
- 1.1. Research Scope
- 1.2. Market Segmentation
- 1.3. Research Objective
- 1.4. Definitions and Assumptions
- 2. Executive Summary
- 2.1. Market Snapshot
- 3. Market Dynamics
- 3.1. Market Drivers
- 3.2. Market Restrains
- 3.3. Market Trends
- 3.4. Market Opportunities
- 4. Market Factor Analysis
- 4.1. Porters Five Forces
- 4.1.1. Bargaining Power of Suppliers
- 4.1.2. Bargaining Power of Buyers
- 4.1.3. Threat of New Entrants
- 4.1.4. Threat of Substitutes
- 4.1.5. Competitive Rivalry
- 4.2. PESTEL analysis
- 4.3. BCG Analysis
- 4.3.1. Stars (High Growth, High Market Share)
- 4.3.2. Cash Cows (Low Growth, High Market Share)
- 4.3.3. Question Mark (High Growth, Low Market Share)
- 4.3.4. Dogs (Low Growth, Low Market Share)
- 4.4. Ansoff Matrix Analysis
- 4.5. Supply Chain Analysis
- 4.6. Regulatory Landscape
- 4.7. Current Market Potential and Opportunity Assessment (TAM–SAM–SOM Framework)
- 4.8. VDR Analyst Note
- 4.1. Porters Five Forces
- 5. Market Analysis, Insights and Forecast 2021-2033
- 5.1. Market Analysis, Insights and Forecast - by Major Cities
- 5.1.1. Bengaluru
- 5.1.2. Hyderabad
- 5.1.3. Mumbai
- 5.1.4. Other Cities
- 5.2. Market Analysis, Insights and Forecast - by Region
- 5.2.1. India
- 5.1. Market Analysis, Insights and Forecast - by Major Cities
- 6. India Office Real Estate Industry Analysis, Insights and Forecast, 2021-2033
- 6.1. Market Analysis, Insights and Forecast - by Major Cities
- 6.1.1. Bengaluru
- 6.1.2. Hyderabad
- 6.1.3. Mumbai
- 6.1.4. Other Cities
- 6.1. Market Analysis, Insights and Forecast - by Major Cities
- 7. Competitive Analysis
- 7.1. Company Profiles
- 7.1.1 Prestige Estate Projects Ltd
- 7.1.1.1. Company Overview
- 7.1.1.2. Products
- 7.1.1.3. Company Financials
- 7.1.1.4. SWOT Analysis
- 7.1.2 Cushman & Wakefield
- 7.1.2.1. Company Overview
- 7.1.2.2. Products
- 7.1.2.3. Company Financials
- 7.1.2.4. SWOT Analysis
- 7.1.3 HDIL Lt
- 7.1.3.1. Company Overview
- 7.1.3.2. Products
- 7.1.3.3. Company Financials
- 7.1.3.4. SWOT Analysis
- 7.1.4 Supertech Limited
- 7.1.4.1. Company Overview
- 7.1.4.2. Products
- 7.1.4.3. Company Financials
- 7.1.4.4. SWOT Analysis
- 7.1.5 Oberoi Realty
- 7.1.5.1. Company Overview
- 7.1.5.2. Products
- 7.1.5.3. Company Financials
- 7.1.5.4. SWOT Analysis
- 7.1.6 CBRE Group
- 7.1.6.1. Company Overview
- 7.1.6.2. Products
- 7.1.6.3. Company Financials
- 7.1.6.4. SWOT Analysis
- 7.1.7 Indiabulls Real Estate
- 7.1.7.1. Company Overview
- 7.1.7.2. Products
- 7.1.7.3. Company Financials
- 7.1.7.4. SWOT Analysis
- 7.1.8 JLL
- 7.1.8.1. Company Overview
- 7.1.8.2. Products
- 7.1.8.3. Company Financials
- 7.1.8.4. SWOT Analysis
- 7.1.9 Savills
- 7.1.9.1. Company Overview
- 7.1.9.2. Products
- 7.1.9.3. Company Financials
- 7.1.9.4. SWOT Analysis
- 7.1.10 DLF Limited
- 7.1.10.1. Company Overview
- 7.1.10.2. Products
- 7.1.10.3. Company Financials
- 7.1.10.4. SWOT Analysis
- 7.1.1 Prestige Estate Projects Ltd
- 7.2. Market Entropy
- 7.2.1 Company's Key Areas Served
- 7.2.2 Recent Developments
- 7.3. Company Market Share Analysis 2025
- 7.3.1 Top 5 Companies Market Share Analysis
- 7.3.2 Top 3 Companies Market Share Analysis
- 7.4. List of Potential Customers
- 8. Research Methodology
List of Figures
- Figure 1: India Office Real Estate Industry Revenue Breakdown (Million, %) by Product 2025 & 2033
- Figure 2: India Office Real Estate Industry Share (%) by Company 2025
List of Tables
- Table 1: India Office Real Estate Industry Revenue Million Forecast, by Major Cities 2020 & 2033
- Table 2: India Office Real Estate Industry Revenue Million Forecast, by Region 2020 & 2033
- Table 3: India Office Real Estate Industry Revenue Million Forecast, by Major Cities 2020 & 2033
- Table 4: India Office Real Estate Industry Revenue Million Forecast, by Country 2020 & 2033
Frequently Asked Questions
1. What is the projected Compound Annual Growth Rate (CAGR) of the India Office Real Estate Industry?
The projected CAGR is approximately 28.50%.
2. Which companies are prominent players in the India Office Real Estate Industry?
Key companies in the market include Prestige Estate Projects Ltd, Cushman & Wakefield, HDIL Lt, Supertech Limited, Oberoi Realty, CBRE Group, Indiabulls Real Estate, JLL, Savills, DLF Limited.
3. What are the main segments of the India Office Real Estate Industry?
The market segments include Major Cities.
4. Can you provide details about the market size?
The market size is estimated to be USD 33.41 Million as of 2022.
5. What are some drivers contributing to market growth?
Improvements in Infrastructure and New Development; Population Growth and Demographic Changes.
6. What are the notable trends driving market growth?
Demand for Office Space Increased in 2021.
7. Are there any restraints impacting market growth?
Housing Shortages; Increasing Awareness towards Environmental Issues.
8. Can you provide examples of recent developments in the market?
October 2022: Colliers International, a global real estate consulting firm, announced that the major six cities in India (Bengaluru, Chennai, Delhi-NCR, Hyderabad, Mumbai, and Pune) planned to develop more than 300 million square feet of existing and upcoming commercial office buildings.
9. What pricing options are available for accessing the report?
Pricing options include single-user, multi-user, and enterprise licenses priced at USD 3800, USD 4500, and USD 5800 respectively.
10. Is the market size provided in terms of value or volume?
The market size is provided in terms of value, measured in Million.
11. Are there any specific market keywords associated with the report?
Yes, the market keyword associated with the report is "India Office Real Estate Industry," which aids in identifying and referencing the specific market segment covered.
12. How do I determine which pricing option suits my needs best?
The pricing options vary based on user requirements and access needs. Individual users may opt for single-user licenses, while businesses requiring broader access may choose multi-user or enterprise licenses for cost-effective access to the report.
13. Are there any additional resources or data provided in the India Office Real Estate Industry report?
While the report offers comprehensive insights, it's advisable to review the specific contents or supplementary materials provided to ascertain if additional resources or data are available.
14. How can I stay updated on further developments or reports in the India Office Real Estate Industry?
To stay informed about further developments, trends, and reports in the India Office Real Estate Industry, consider subscribing to industry newsletters, following relevant companies and organizations, or regularly checking reputable industry news sources and publications.
Methodology
Step 1 - Identification of Relevant Samples Size from Population Database


Step 2 - Approaches for Defining Global Market Size (Value, Volume* & Price*)

Note*: In applicable scenarios
Step 3 - Data Sources
Primary Research
- Web Analytics
- Survey Reports
- Research Institute
- Latest Research Reports
- Opinion Leaders
Secondary Research
- Annual Reports
- White Paper
- Latest Press Release
- Industry Association
- Paid Database
- Investor Presentations

Step 4 - Data Triangulation
Involves using different sources of information in order to increase the validity of a study
These sources are likely to be stakeholders in a program - participants, other researchers, program staff, other community members, and so on.
Then we put all data in single framework & apply various statistical tools to find out the dynamic on the market.
During the analysis stage, feedback from the stakeholder groups would be compared to determine areas of agreement as well as areas of divergence