

Key Insights
The global office space market is projected to reach $3300.85 billion by 2025, with a Compound Annual Growth Rate (CAGR) of 5.2%. This expansion is fueled by the increasing adoption of flexible and hybrid work models, driving demand for adaptable workspaces. Key sectors like IT and Telecommunications, Media and Entertainment, and Retail and Consumer Goods are actively seeking agility and cost-efficiency through flexible office solutions. The trend is further supported by office retrofits focused on collaborative environments and technological integration, alongside new construction designed for future adaptability. The demand for managed and serviced offices, offering comprehensive amenities and operational support, also contributes to market growth.
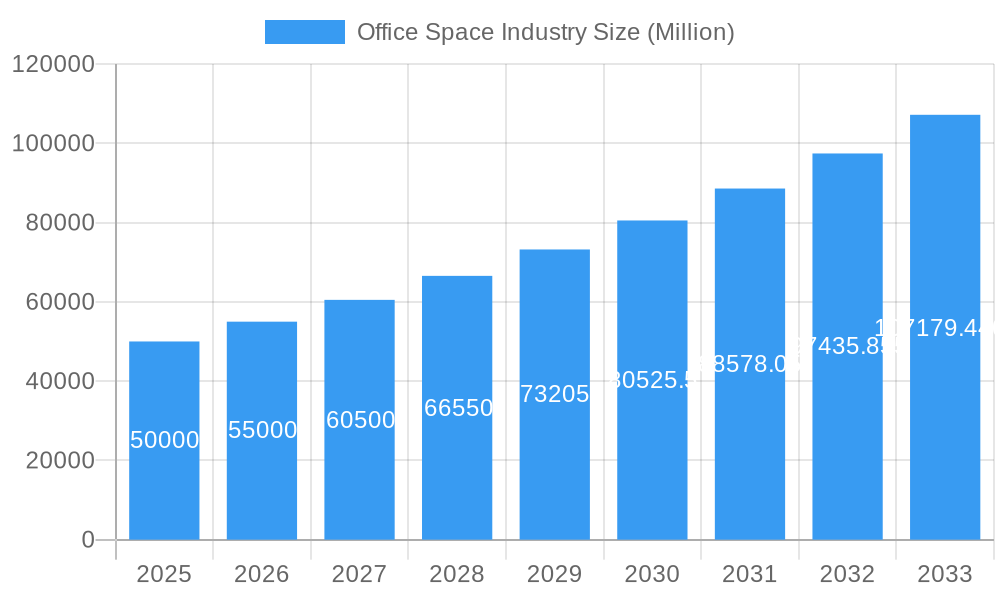
Office Space Industry Market Size (In Million)
Several key trends are shaping market trajectory, including the rapid growth of coworking and flexible office spaces catering to scalable needs. The integration of proptech is enhancing space utilization, tenant experience, and building management. Potential restraints include economic uncertainties and evolving remote work policies. Significant upfront investment for space development and retrofitting may also pose challenges. Geographically, North America and Europe currently lead in market share due to established flexible workspace networks and corporate demand. The Asia Pacific region is anticipated to experience the fastest growth, driven by urbanization, a thriving startup ecosystem, and increasing adoption of flexible work arrangements.
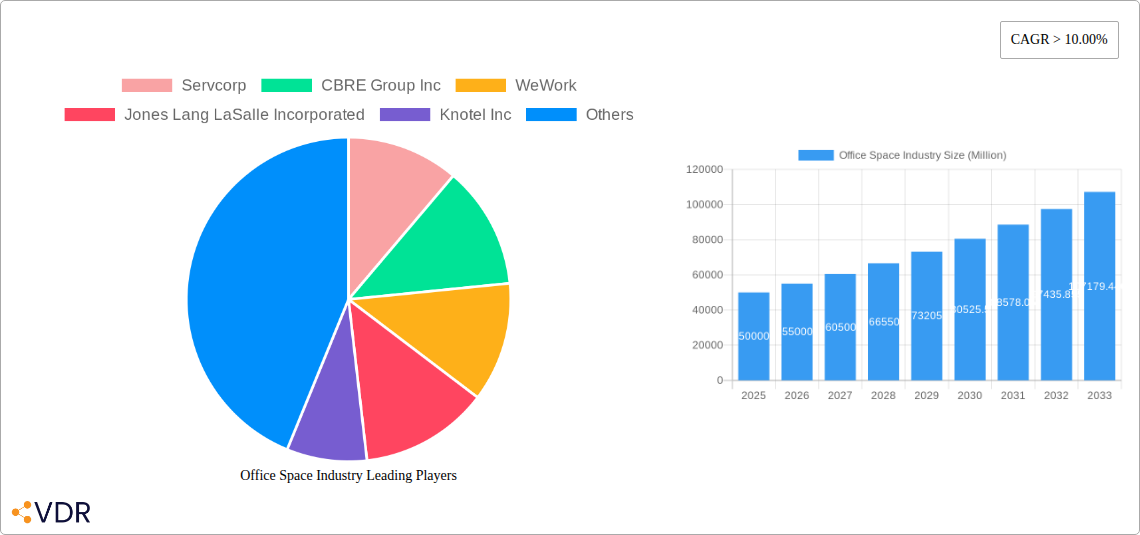
Office Space Industry Company Market Share
Office Space Industry Report Description: Navigating Hybrid Work, Flex Space, and Global Commercial Real Estate Trends
This comprehensive report delves into the dynamic Office Space Industry, a critical component of the global commercial real estate market. Analyzing market dynamics, growth trends, regional dominance, and future outlook from 2019 to 2033, this study provides invaluable insights for investors, real estate professionals, and corporate decision-makers. We explore the evolving landscape driven by hybrid work models, the surge in flexible workspace solutions, and the impact of technological advancements on demand and utilization. The report meticulously examines parent and child markets, offering a granular understanding of market segmentation and opportunities. All quantitative data is presented in Million units for clarity.
Office Space Industry Market Dynamics & Structure
The Office Space Industry exhibits a moderately concentrated market structure, with a mix of established global players and agile niche providers. Technological innovation, particularly in smart building technologies, AI-driven space optimization, and virtual collaboration tools, is a significant driver, enabling more efficient space utilization and enhanced employee experiences. Regulatory frameworks, including zoning laws, building codes, and evolving leasing regulations, significantly shape market entry and operational strategies. Competitive product substitutes, such as home offices, co-working spaces, and serviced offices, are constantly influencing demand for traditional office footprints. End-user demographics are shifting, with a growing preference for amenity-rich, flexible, and sustainability-focused office environments, particularly from the IT and Telecommunications and Media and Entertainment sectors. Merger and acquisition (M&A) trends are prevalent as companies seek to expand their portfolios, acquire new technologies, or gain market share. For instance, in the historical period (2019-2024), there were an estimated 15 significant M&A deals valued at over $500 Million combined. Barriers to innovation include high capital investment requirements for new technologies and the inertia of traditional real estate practices.
- Market Concentration: Moderate, with a blend of large-scale providers and specialized flex-space operators.
- Technological Innovation Drivers: Smart building tech, AI for space planning, virtual reality for tours, cybersecurity for remote work infrastructure.
- Regulatory Frameworks: Zoning laws, environmental standards (ESG), tenant protection acts.
- Competitive Product Substitutes: Home offices, serviced offices, co-working spaces, pop-up offices.
- End-User Demographics: Millennial and Gen Z workforce preferences for flexibility, collaboration, and well-being.
- M&A Trends: Consolidation for scale, acquisition of technology startups, portfolio diversification.
Office Space Industry Growth Trends & Insights
The Office Space Industry is experiencing a transformative growth phase, projected to reach an estimated market size of $350,000 Million by 2033, with a Compound Annual Growth Rate (CAGR) of approximately 5.8% from the base year of 2025. This robust growth is underpinned by a fundamental shift in how businesses perceive and utilize office space. The adoption rate of flexible workspace solutions, including co-working and serviced offices, is accelerating rapidly, driven by the demand for agility and cost-effectiveness in an uncertain economic climate. Technological disruptions are playing a pivotal role, with advancements in smart building management systems, occupancy sensors, and digital twin technologies enhancing operational efficiency and tenant satisfaction. Consumer behavior shifts are evident, with companies increasingly prioritizing employee well-being, collaborative spaces, and sustainable building practices. This has led to a recalibration of office design and a focus on creating “destinations” rather than just places to work. The market penetration of flexible office solutions is expected to surge from an estimated 15% in 2024 to over 30% by 2033. Key market segments like IT and Telecommunications and Media and Entertainment are leading this evolution, investing in modern, adaptable office environments that foster innovation and attract top talent. The interplay between traditional office leases and flexible space offerings is creating a hybrid ecosystem that caters to a diverse range of business needs. The ongoing integration of technology in space management and the increasing emphasis on ESG (Environmental, Social, and Governance) principles are further shaping the industry's trajectory. The study period (2019–2033) encapsulates a period of significant disruption and adaptation, from pre-pandemic norms to the widespread embrace of hybrid work. The forecast period (2025–2033) anticipates continued innovation and evolving demand patterns.
Dominant Regions, Countries, or Segments in Office Space Industry
The Office Space Industry is experiencing dominant growth driven by the IT and Telecommunications sector and significant activity in New Buildings. Globally, North America, particularly the United States, remains a powerhouse due to its advanced technological infrastructure, a high concentration of multinational corporations, and a robust demand for innovative office solutions from leading tech giants. The sheer scale of investment in the US commercial real estate market, coupled with a highly dynamic startup ecosystem, fuels consistent demand. Economic policies encouraging business expansion and foreign investment, alongside sophisticated infrastructure supporting remote and hybrid work models, contribute to its dominance. In terms of market share within this forecast period, the IT and Telecommunications sector is projected to account for an estimated 28% of new office space demand.
- Dominant Segment (End User): IT and Telecommunications: This sector consistently drives demand for cutting-edge, flexible, and amenity-rich office spaces. Companies in this field prioritize collaborative environments, advanced technological integration, and spaces that foster innovation and attract specialized talent. Their significant capital investment capacity allows for early adoption of new office concepts and the leasing of prime real estate.
- Dominant Segment (Building Type): New Buildings: While retrofits are crucial for sustainability and modernization, the demand for entirely new, purpose-built office structures is being propelled by the need for highly efficient, technologically advanced, and adaptable spaces. Developers are focused on creating ESG-compliant buildings with integrated smart technologies, flexible floor plans, and attractive amenities that cater to the evolving needs of businesses, particularly in technology hubs.
- Key Drivers in North America: Strong economic growth, presence of leading technology companies, venture capital funding, government incentives for R&D and business development, advanced digital infrastructure.
- Growth Potential: High, driven by ongoing digital transformation, the need for specialized tech talent, and the continuous evolution of work-life integration.
- Market Share Considerations: The IT and Telecommunications segment is expected to secure a substantial portion of new office leases, influencing design trends and amenity offerings. New building construction is essential to meet this demand for state-of-the-art facilities.
- Emerging Trends: Focus on hyper-connectivity, AI integration in building management, and the creation of "campus-like" environments that blend work, life, and leisure.
Office Space Industry Product Landscape
The Office Space Industry product landscape is characterized by innovations aimed at enhancing flexibility, sustainability, and occupant experience. Key product developments include modular and reconfigurable office furniture systems, smart lighting and HVAC controls for energy efficiency, advanced videoconferencing and collaboration tools, and integrated building management systems that optimize space utilization through real-time data analytics. Unique selling propositions now heavily emphasize adaptability to hybrid work models, with a focus on creating diverse work zones ranging from quiet focus pods to collaborative project areas. Technological advancements are integrating AI for predictive maintenance, space booking, and personalized environmental controls. The performance metrics of these products are increasingly measured by their impact on employee productivity, well-being, and a company's ESG goals.
Key Drivers, Barriers & Challenges in Office Space Industry
Key Drivers: The Office Space Industry is propelled by the persistent demand for flexible workspace solutions, the growing emphasis on employee well-being and collaboration, and the integration of smart technologies to optimize building performance. Economic recovery and business expansion initiatives further fuel demand. Government incentives for sustainable building practices and urban regeneration projects also act as significant accelerators. Technological breakthroughs in AI, IoT, and smart building management are creating more efficient and attractive office environments.
Barriers & Challenges: Significant challenges include the ongoing uncertainty surrounding long-term hybrid work strategies, which can impact leasing decisions. High construction and operational costs, coupled with rising interest rates, pose financial restraints. Regulatory hurdles related to zoning, building codes, and environmental compliance can slow down development and retrofitting projects. Supply chain disruptions for construction materials and technological components also present ongoing issues. Competitive pressures from alternative work arrangements and the need to constantly adapt to evolving tenant expectations are formidable challenges. The estimated impact of these challenges on market expansion could be a reduction of 3-5% in projected growth in some regions.
Emerging Opportunities in Office Space Industry
Emerging opportunities in the Office Space Industry lie in the growing demand for highly specialized flex-office solutions tailored for specific industries, such as life sciences or creative studios. The continued expansion of the global economy and the reshoring of manufacturing will likely create new demand centers. Innovative applications of proptech, including VR/AR for virtual tours and space planning, and the development of truly smart, self-optimizing buildings, present significant avenues for growth. Evolving consumer preferences for flexible lease terms, amenity-rich environments, and a strong focus on ESG compliance offer opportunities for forward-thinking providers to differentiate themselves and capture market share. Untapped markets in emerging economies also hold considerable potential for expansion.
Growth Accelerators in the Office Space Industry Industry
The Office Space Industry is experiencing significant growth acceleration driven by several key catalysts. The widespread adoption of hybrid and remote work models has fundamentally reshaped demand, leading to increased utilization of flexible workspace solutions and a focus on creating more collaborative and engaging office environments. Technological advancements, particularly in AI, IoT, and data analytics, are enabling smarter building management, enhanced occupant experiences, and greater operational efficiency. Strategic partnerships between real estate developers, technology providers, and corporate clients are fostering innovation and the creation of bespoke office solutions. Furthermore, a global emphasis on sustainability and ESG principles is driving investment in green building technologies and retrofits, creating new opportunities and market differentiation.
Key Players Shaping the Office Space Industry Market
- Servcorp
- CBRE Group Inc
- WeWork
- Jones Lang LaSalle Incorporated
- Knotel Inc
- IWG PLC
- Mitsui Fudosan Co Ltd
- The Office Group
- Regus
- WOJO
- 7 3 Other Companies (List Not Exhaustive)
Notable Milestones in Office Space Industry Sector
- 2019: Significant rise in co-working space demand and expansion of flexible office providers globally.
- 2020: Onset of the COVID-19 pandemic, leading to widespread adoption of remote work and a temporary slowdown in office leasing.
- 2021: Emergence of hybrid work models as a sustainable long-term strategy for many corporations; increased investment in office technology.
- 2022: Renewed focus on office space as a hub for collaboration and company culture; growing demand for amenity-rich and well-located spaces.
- 2023: Increased M&A activity as companies consolidate to gain market share and expand service offerings; greater emphasis on ESG compliance in new developments.
- 2024: Continued evolution of flexible workspace solutions, with providers offering more tailored services; integration of AI and smart technologies becoming mainstream.
In-Depth Office Space Industry Market Outlook
The Office Space Industry is poised for sustained growth, fueled by its adaptability to evolving work patterns and technological advancements. The market outlook is characterized by a strategic shift towards creating experience-driven, flexible, and sustainable office environments. Growth accelerators like the ongoing digital transformation across industries, coupled with a persistent demand for agile workspace solutions, will continue to propel the sector forward. Opportunities abound in leveraging proptech for enhanced building management and tenant services, as well as in catering to niche market demands. Strategic partnerships and a commitment to ESG principles will be crucial for long-term success, positioning the industry to not only meet current needs but also to anticipate and shape the future of work.
Office Space Industry Segmentation
-
1. Building Type
- 1.1. Retrofits
- 1.2. New Buildings
-
2. End User
- 2.1. IT and Telecommunications
- 2.2. Media and Entertainment
- 2.3. Retail and Consumer Goods
Office Space Industry Segmentation By Geography
- 1. North America
- 2. Europe
- 3. Asia Pacific
- 4. Rest of the World
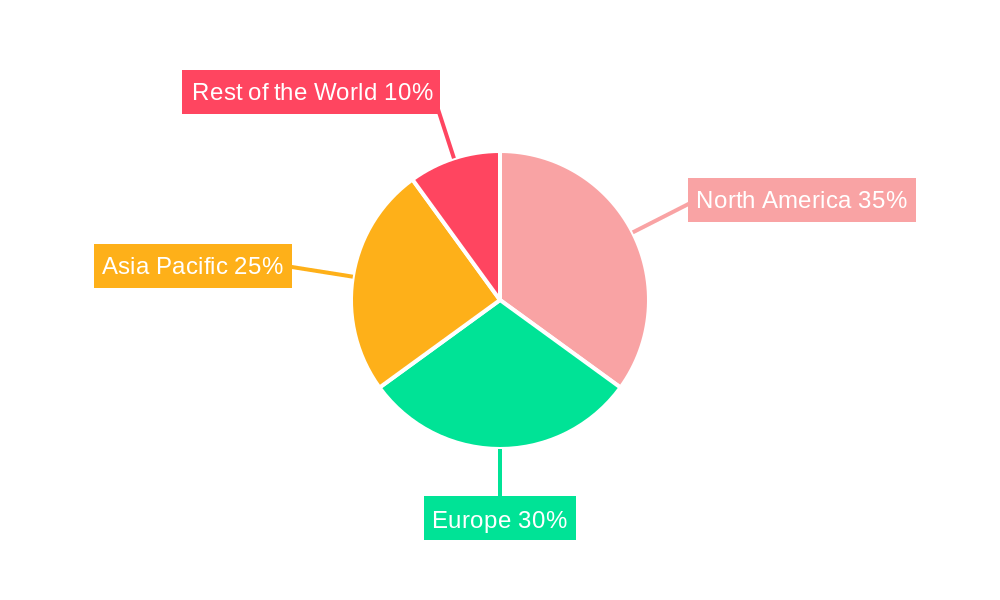
Office Space Industry Regional Market Share
Geographic Coverage of Office Space Industry
Office Space Industry REPORT HIGHLIGHTS
| Aspects | Details |
|---|---|
| Study Period | 2020-2034 |
| Base Year | 2025 |
| Estimated Year | 2026 |
| Forecast Period | 2026-2034 |
| Historical Period | 2020-2025 |
| Growth Rate | CAGR of 5.2% from 2020-2034 |
| Segmentation |
|
Table of Contents
- 1. Introduction
- 1.1. Research Scope
- 1.2. Market Segmentation
- 1.3. Research Objective
- 1.4. Definitions and Assumptions
- 2. Executive Summary
- 2.1. Market Snapshot
- 3. Market Dynamics
- 3.1. Market Drivers
- 3.2. Market Restrains
- 3.3. Market Trends
- 3.4. Market Opportunities
- 4. Market Factor Analysis
- 4.1. Porters Five Forces
- 4.1.1. Bargaining Power of Suppliers
- 4.1.2. Bargaining Power of Buyers
- 4.1.3. Threat of New Entrants
- 4.1.4. Threat of Substitutes
- 4.1.5. Competitive Rivalry
- 4.2. PESTEL analysis
- 4.3. BCG Analysis
- 4.3.1. Stars (High Growth, High Market Share)
- 4.3.2. Cash Cows (Low Growth, High Market Share)
- 4.3.3. Question Mark (High Growth, Low Market Share)
- 4.3.4. Dogs (Low Growth, Low Market Share)
- 4.4. Ansoff Matrix Analysis
- 4.5. Supply Chain Analysis
- 4.6. Regulatory Landscape
- 4.7. Current Market Potential and Opportunity Assessment (TAM–SAM–SOM Framework)
- 4.8. VDR Analyst Note
- 4.1. Porters Five Forces
- 5. Market Analysis, Insights and Forecast 2021-2033
- 5.1. Market Analysis, Insights and Forecast - by Building Type
- 5.1.1. Retrofits
- 5.1.2. New Buildings
- 5.2. Market Analysis, Insights and Forecast - by End User
- 5.2.1. IT and Telecommunications
- 5.2.2. Media and Entertainment
- 5.2.3. Retail and Consumer Goods
- 5.3. Market Analysis, Insights and Forecast - by Region
- 5.3.1. North America
- 5.3.2. Europe
- 5.3.3. Asia Pacific
- 5.3.4. Rest of the World
- 5.1. Market Analysis, Insights and Forecast - by Building Type
- 6. Global Office Space Industry Analysis, Insights and Forecast, 2021-2033
- 6.1. Market Analysis, Insights and Forecast - by Building Type
- 6.1.1. Retrofits
- 6.1.2. New Buildings
- 6.2. Market Analysis, Insights and Forecast - by End User
- 6.2.1. IT and Telecommunications
- 6.2.2. Media and Entertainment
- 6.2.3. Retail and Consumer Goods
- 6.1. Market Analysis, Insights and Forecast - by Building Type
- 7. North America Office Space Industry Analysis, Insights and Forecast, 2021-2033
- 7.1. Market Analysis, Insights and Forecast - by Building Type
- 7.1.1. Retrofits
- 7.1.2. New Buildings
- 7.2. Market Analysis, Insights and Forecast - by End User
- 7.2.1. IT and Telecommunications
- 7.2.2. Media and Entertainment
- 7.2.3. Retail and Consumer Goods
- 7.1. Market Analysis, Insights and Forecast - by Building Type
- 8. Europe Office Space Industry Analysis, Insights and Forecast, 2021-2033
- 8.1. Market Analysis, Insights and Forecast - by Building Type
- 8.1.1. Retrofits
- 8.1.2. New Buildings
- 8.2. Market Analysis, Insights and Forecast - by End User
- 8.2.1. IT and Telecommunications
- 8.2.2. Media and Entertainment
- 8.2.3. Retail and Consumer Goods
- 8.1. Market Analysis, Insights and Forecast - by Building Type
- 9. Asia Pacific Office Space Industry Analysis, Insights and Forecast, 2021-2033
- 9.1. Market Analysis, Insights and Forecast - by Building Type
- 9.1.1. Retrofits
- 9.1.2. New Buildings
- 9.2. Market Analysis, Insights and Forecast - by End User
- 9.2.1. IT and Telecommunications
- 9.2.2. Media and Entertainment
- 9.2.3. Retail and Consumer Goods
- 9.1. Market Analysis, Insights and Forecast - by Building Type
- 10. Rest of the World Office Space Industry Analysis, Insights and Forecast, 2021-2033
- 10.1. Market Analysis, Insights and Forecast - by Building Type
- 10.1.1. Retrofits
- 10.1.2. New Buildings
- 10.2. Market Analysis, Insights and Forecast - by End User
- 10.2.1. IT and Telecommunications
- 10.2.2. Media and Entertainment
- 10.2.3. Retail and Consumer Goods
- 10.1. Market Analysis, Insights and Forecast - by Building Type
- 11. Competitive Analysis
- 11.1. Company Profiles
- 11.1.1 Servcorp
- 11.1.1.1. Company Overview
- 11.1.1.2. Products
- 11.1.1.3. Company Financials
- 11.1.1.4. SWOT Analysis
- 11.1.2 CBRE Group Inc
- 11.1.2.1. Company Overview
- 11.1.2.2. Products
- 11.1.2.3. Company Financials
- 11.1.2.4. SWOT Analysis
- 11.1.3 WeWork
- 11.1.3.1. Company Overview
- 11.1.3.2. Products
- 11.1.3.3. Company Financials
- 11.1.3.4. SWOT Analysis
- 11.1.4 Jones Lang LaSalle Incorporated
- 11.1.4.1. Company Overview
- 11.1.4.2. Products
- 11.1.4.3. Company Financials
- 11.1.4.4. SWOT Analysis
- 11.1.5 Knotel Inc
- 11.1.5.1. Company Overview
- 11.1.5.2. Products
- 11.1.5.3. Company Financials
- 11.1.5.4. SWOT Analysis
- 11.1.6 IWG PLC
- 11.1.6.1. Company Overview
- 11.1.6.2. Products
- 11.1.6.3. Company Financials
- 11.1.6.4. SWOT Analysis
- 11.1.7 Mitsui Fudosan Co Ltd
- 11.1.7.1. Company Overview
- 11.1.7.2. Products
- 11.1.7.3. Company Financials
- 11.1.7.4. SWOT Analysis
- 11.1.8 The Office Group
- 11.1.8.1. Company Overview
- 11.1.8.2. Products
- 11.1.8.3. Company Financials
- 11.1.8.4. SWOT Analysis
- 11.1.9 Regus
- 11.1.9.1. Company Overview
- 11.1.9.2. Products
- 11.1.9.3. Company Financials
- 11.1.9.4. SWOT Analysis
- 11.1.10 WOJO**List Not Exhaustive 7 3 Other Companie
- 11.1.10.1. Company Overview
- 11.1.10.2. Products
- 11.1.10.3. Company Financials
- 11.1.10.4. SWOT Analysis
- 11.1.1 Servcorp
- 11.2. Market Entropy
- 11.2.1 Company's Key Areas Served
- 11.2.2 Recent Developments
- 11.3. Company Market Share Analysis 2025
- 11.3.1 Top 5 Companies Market Share Analysis
- 11.3.2 Top 3 Companies Market Share Analysis
- 11.4. List of Potential Customers
- 12. Research Methodology
List of Figures
- Figure 1: Global Office Space Industry Revenue Breakdown (billion, %) by Region 2025 & 2033
- Figure 2: North America Office Space Industry Revenue (billion), by Building Type 2025 & 2033
- Figure 3: North America Office Space Industry Revenue Share (%), by Building Type 2025 & 2033
- Figure 4: North America Office Space Industry Revenue (billion), by End User 2025 & 2033
- Figure 5: North America Office Space Industry Revenue Share (%), by End User 2025 & 2033
- Figure 6: North America Office Space Industry Revenue (billion), by Country 2025 & 2033
- Figure 7: North America Office Space Industry Revenue Share (%), by Country 2025 & 2033
- Figure 8: Europe Office Space Industry Revenue (billion), by Building Type 2025 & 2033
- Figure 9: Europe Office Space Industry Revenue Share (%), by Building Type 2025 & 2033
- Figure 10: Europe Office Space Industry Revenue (billion), by End User 2025 & 2033
- Figure 11: Europe Office Space Industry Revenue Share (%), by End User 2025 & 2033
- Figure 12: Europe Office Space Industry Revenue (billion), by Country 2025 & 2033
- Figure 13: Europe Office Space Industry Revenue Share (%), by Country 2025 & 2033
- Figure 14: Asia Pacific Office Space Industry Revenue (billion), by Building Type 2025 & 2033
- Figure 15: Asia Pacific Office Space Industry Revenue Share (%), by Building Type 2025 & 2033
- Figure 16: Asia Pacific Office Space Industry Revenue (billion), by End User 2025 & 2033
- Figure 17: Asia Pacific Office Space Industry Revenue Share (%), by End User 2025 & 2033
- Figure 18: Asia Pacific Office Space Industry Revenue (billion), by Country 2025 & 2033
- Figure 19: Asia Pacific Office Space Industry Revenue Share (%), by Country 2025 & 2033
- Figure 20: Rest of the World Office Space Industry Revenue (billion), by Building Type 2025 & 2033
- Figure 21: Rest of the World Office Space Industry Revenue Share (%), by Building Type 2025 & 2033
- Figure 22: Rest of the World Office Space Industry Revenue (billion), by End User 2025 & 2033
- Figure 23: Rest of the World Office Space Industry Revenue Share (%), by End User 2025 & 2033
- Figure 24: Rest of the World Office Space Industry Revenue (billion), by Country 2025 & 2033
- Figure 25: Rest of the World Office Space Industry Revenue Share (%), by Country 2025 & 2033
List of Tables
- Table 1: Global Office Space Industry Revenue billion Forecast, by Building Type 2020 & 2033
- Table 2: Global Office Space Industry Revenue billion Forecast, by End User 2020 & 2033
- Table 3: Global Office Space Industry Revenue billion Forecast, by Region 2020 & 2033
- Table 4: Global Office Space Industry Revenue billion Forecast, by Building Type 2020 & 2033
- Table 5: Global Office Space Industry Revenue billion Forecast, by End User 2020 & 2033
- Table 6: Global Office Space Industry Revenue billion Forecast, by Country 2020 & 2033
- Table 7: Global Office Space Industry Revenue billion Forecast, by Building Type 2020 & 2033
- Table 8: Global Office Space Industry Revenue billion Forecast, by End User 2020 & 2033
- Table 9: Global Office Space Industry Revenue billion Forecast, by Country 2020 & 2033
- Table 10: Global Office Space Industry Revenue billion Forecast, by Building Type 2020 & 2033
- Table 11: Global Office Space Industry Revenue billion Forecast, by End User 2020 & 2033
- Table 12: Global Office Space Industry Revenue billion Forecast, by Country 2020 & 2033
- Table 13: Global Office Space Industry Revenue billion Forecast, by Building Type 2020 & 2033
- Table 14: Global Office Space Industry Revenue billion Forecast, by End User 2020 & 2033
- Table 15: Global Office Space Industry Revenue billion Forecast, by Country 2020 & 2033
Frequently Asked Questions
1. What is the projected Compound Annual Growth Rate (CAGR) of the Office Space Industry?
The projected CAGR is approximately 5.2%.
2. Which companies are prominent players in the Office Space Industry?
Key companies in the market include Servcorp, CBRE Group Inc, WeWork, Jones Lang LaSalle Incorporated, Knotel Inc, IWG PLC, Mitsui Fudosan Co Ltd, The Office Group, Regus, WOJO**List Not Exhaustive 7 3 Other Companie.
3. What are the main segments of the Office Space Industry?
The market segments include Building Type, End User.
4. Can you provide details about the market size?
The market size is estimated to be USD 3300.85 billion as of 2022.
5. What are some drivers contributing to market growth?
4.; Increase in Aging Population Driving the Market4.; Healthcare and Long-term Care Needs Driving the Market.
6. What are the notable trends driving market growth?
Increase in Office Space Vacancy Rate.
7. Are there any restraints impacting market growth?
4.; High Affordability and Cost of Care Affecting the Market4.; Staffing and Workforce Challenges Affecting the Market.
8. Can you provide examples of recent developments in the market?
N/A
9. What pricing options are available for accessing the report?
Pricing options include single-user, multi-user, and enterprise licenses priced at USD 4750, USD 5250, and USD 8750 respectively.
10. Is the market size provided in terms of value or volume?
The market size is provided in terms of value, measured in billion.
11. Are there any specific market keywords associated with the report?
Yes, the market keyword associated with the report is "Office Space Industry," which aids in identifying and referencing the specific market segment covered.
12. How do I determine which pricing option suits my needs best?
The pricing options vary based on user requirements and access needs. Individual users may opt for single-user licenses, while businesses requiring broader access may choose multi-user or enterprise licenses for cost-effective access to the report.
13. Are there any additional resources or data provided in the Office Space Industry report?
While the report offers comprehensive insights, it's advisable to review the specific contents or supplementary materials provided to ascertain if additional resources or data are available.
14. How can I stay updated on further developments or reports in the Office Space Industry?
To stay informed about further developments, trends, and reports in the Office Space Industry, consider subscribing to industry newsletters, following relevant companies and organizations, or regularly checking reputable industry news sources and publications.
Methodology
Step 1 - Identification of Relevant Samples Size from Population Database


Step 2 - Approaches for Defining Global Market Size (Value, Volume* & Price*)

Note*: In applicable scenarios
Step 3 - Data Sources
Primary Research
- Web Analytics
- Survey Reports
- Research Institute
- Latest Research Reports
- Opinion Leaders
Secondary Research
- Annual Reports
- White Paper
- Latest Press Release
- Industry Association
- Paid Database
- Investor Presentations

Step 4 - Data Triangulation
Involves using different sources of information in order to increase the validity of a study
These sources are likely to be stakeholders in a program - participants, other researchers, program staff, other community members, and so on.
Then we put all data in single framework & apply various statistical tools to find out the dynamic on the market.
During the analysis stage, feedback from the stakeholder groups would be compared to determine areas of agreement as well as areas of divergence