Hydroponics Industry Market’s Growth Catalysts

Hydroponics Industry by Production Analysis, by Consumption Analysis, by Import Market Analysis (Value & Volume), by Export Market Analysis (Value & Volume), by Price Trend Analysis, by North America (United States, Canada, Mexico), by South America (Brazil, Argentina, Rest of South America), by Europe (United Kingdom, Germany, France, Italy, Spain, Russia, Benelux, Nordics, Rest of Europe), by Middle East & Africa (Turkey, Israel, GCC, North Africa, South Africa, Rest of Middle East & Africa), by Asia Pacific (China, India, Japan, South Korea, ASEAN, Oceania, Rest of Asia Pacific) Forecast 2025-2033

Jun 27 2025
Base Year: 2024

150 Pages
Main Logo

Hydroponics Industry Market’s Growth Catalysts


Home
Industries
Agriculture
sponsor image

Tailored for you

  • In-depth Analysis Tailored to Specified Regions or Segments
  • Company Profiles Customized to User Preferences
  • Comprehensive Insights Focused on Specific Segments or Regions
  • Customized Evaluation of Competitive Landscape to Meet Your Needs
  • Tailored Customization to Address Other Specific Requirements
Ask for customization


Key Insights

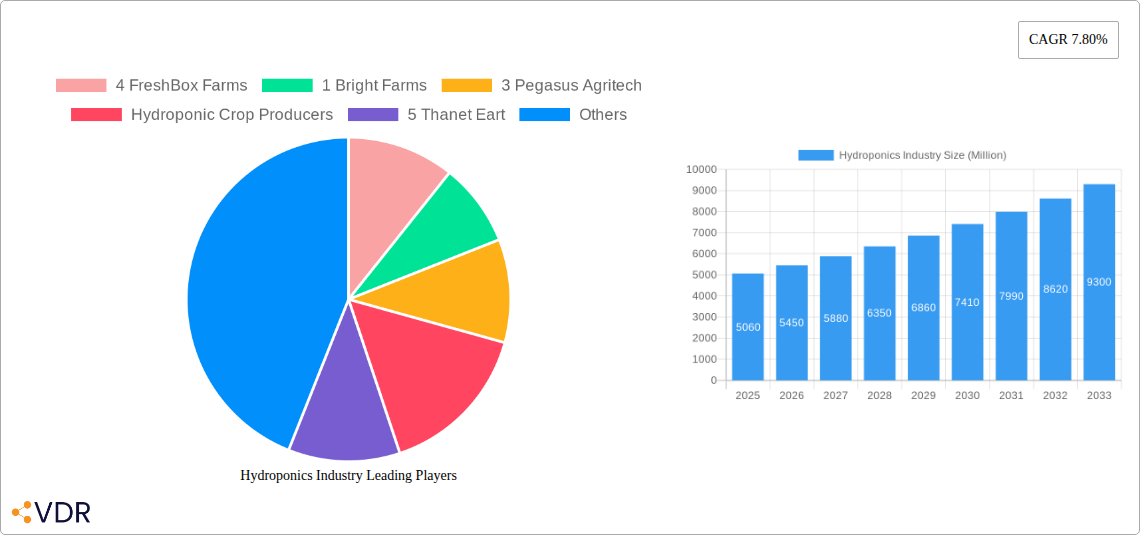
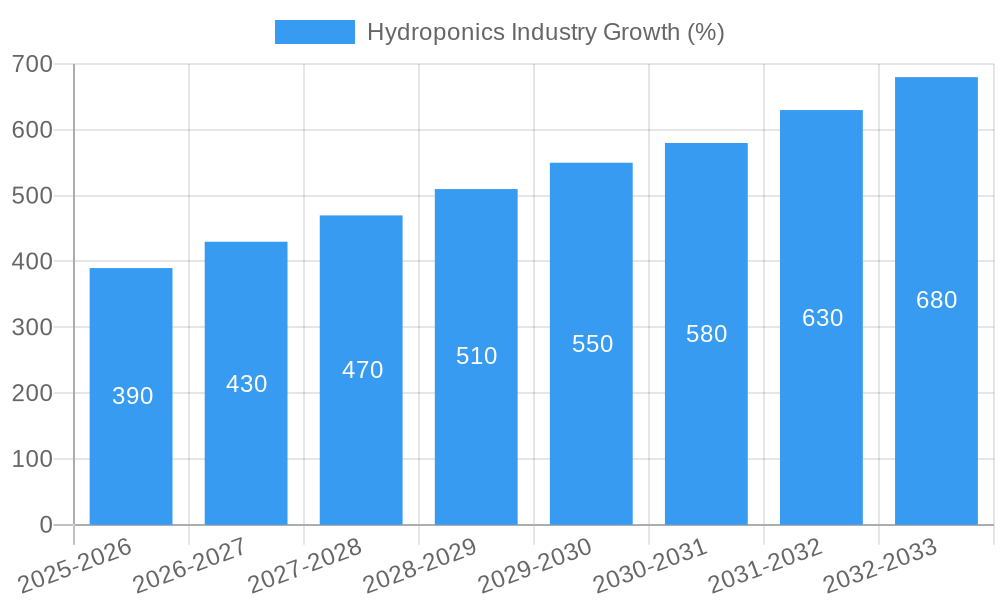
The global hydroponics market, valued at $5.06 billion in 2025, is projected to experience robust growth, driven by a Compound Annual Growth Rate (CAGR) of 7.80% from 2025 to 2033. This expansion is fueled by several key factors. Increasing urbanization and the consequent shrinking of arable land are forcing a shift towards more efficient and space-saving agricultural techniques. Consumer demand for fresh, locally sourced produce is also on the rise, creating a significant opportunity for hydroponic farms to cater to this preference. Furthermore, technological advancements in hydroponic systems, such as automation and precision nutrient delivery, are enhancing productivity and reducing operational costs, making hydroponics a more attractive option for both large-scale commercial operations and smaller, localized farms. The growing awareness of sustainable agricultural practices and the potential for reduced water consumption compared to traditional farming methods further contribute to the market's upward trajectory. Significant growth is anticipated across various crop types, with tomatoes, lettuce, leafy greens, peppers, cucumbers, and microgreens leading the market segments. Key players like Village Farms International Inc., Bright Farms, and 4 FreshBox Farms are driving innovation and market expansion through strategic partnerships, technological advancements, and expansion into new geographical regions.

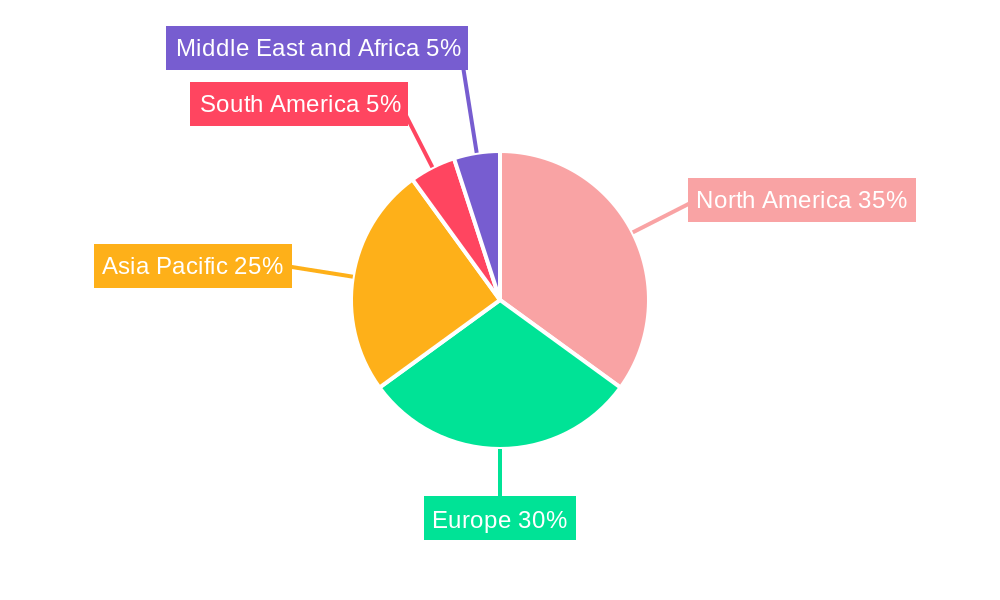
The geographical distribution of the market reflects varying levels of adoption and development. North America and Europe currently hold significant market shares, owing to established hydroponic infrastructure and strong consumer demand for high-quality produce. However, the Asia-Pacific region is poised for significant growth, driven by increasing population density, rising disposable incomes, and government initiatives promoting sustainable agriculture. The market segmentation by hydroponic system type (aggregate and open systems) also contributes to market dynamism, with advancements in each type leading to specialized applications and niche market opportunities. Continued technological innovation, coupled with increasing consumer awareness of sustainable food production, strongly suggests that the hydroponics market will continue its impressive growth trajectory throughout the forecast period.

Hydroponics Industry Research Report - Market Size, Growth & Forecast

Hydroponics Industry Market Report: 2019-2033

This comprehensive report provides an in-depth analysis of the hydroponics industry, encompassing market dynamics, growth trends, regional insights, and key player strategies. The study period covers 2019-2033, with a base year of 2025 and a forecast period of 2025-2033. This report is crucial for industry professionals, investors, and stakeholders seeking to understand and capitalize on the burgeoning opportunities within this dynamic sector. The report analyzes both the parent market (controlled environment agriculture) and the child market (hydroponic systems and related technologies).

Hydroponics Industry Market Dynamics & Structure

The hydroponics market is characterized by moderate concentration, with several large players and numerous smaller, specialized firms. Technological innovation, particularly in automation, sensing, and lighting, is a significant driver of growth. Regulatory frameworks, varying by region, influence market access and operational costs. Competitive substitutes include traditional agriculture and other controlled environment agriculture methods. The end-user base encompasses commercial growers, small-scale farmers, and even home enthusiasts. M&A activity is relatively frequent, particularly among companies focusing on vertical farming and technological advancements.

  • Market Concentration: Moderately concentrated, with a few dominant players holding xx% market share.
  • Technological Innovation: Significant investments in automation, AI-powered systems, and LED lighting are driving efficiency and yield improvements.
  • Regulatory Landscape: Varies significantly across regions, impacting operational costs and market entry.
  • Competitive Substitutes: Traditional agriculture, aquaponics, and aeroponics pose competitive pressure.
  • End-User Demographics: Includes commercial farms, small-scale operations, and home growers.
  • M&A Activity: xx M&A deals were recorded in the historical period, primarily driven by technological acquisition and market expansion. Deal value totaled approximately xx Million.

Hydroponics Industry Growth Trends & Insights

The hydroponics industry is experiencing robust growth, driven by increasing consumer demand for fresh produce, water scarcity concerns, and technological advancements leading to higher yields and efficiency. The global market size was valued at xx Million in 2024, exhibiting a CAGR of xx% during the historical period. The market penetration rate is increasing steadily, particularly in developed regions. Technological disruptions, such as AI-powered farming systems and precision irrigation, are further accelerating market expansion. Shifts in consumer preferences toward sustainable and locally sourced food are also positively influencing demand. The forecast period projects a market value of xx Million by 2033, driven by continued technological advancements and expanding consumer demand.

Hydroponics Industry Growth

Dominant Regions, Countries, or Segments in Hydroponics Industry

North America and Europe currently lead the hydroponics market, driven by strong consumer demand, established infrastructure, and supportive government policies. Within these regions, the United States and the Netherlands hold prominent positions. However, significant growth potential exists in emerging markets, particularly in Asia and the Middle East, fueled by increasing food security concerns and government initiatives to promote sustainable agriculture.

Dominant Segments:

  • Type: Liquid Hydroponic Systems dominate the market with xx% market share, due to their relatively lower setup cost and ease of operation. Aggregate Hydroponic Systems represent xx% of the market.
  • Crop Type: Lettuce and leafy greens currently hold the largest market share at xx%, followed by tomatoes at xx%. The Microgreens segment exhibits high growth potential, with an estimated CAGR of xx% during the forecast period.
  • Key Drivers: Government incentives for sustainable agriculture, increasing demand for fresh produce, advancements in LED lighting and automation, and growing awareness of water conservation contribute significantly to market growth.

Hydroponics Industry Product Landscape

The hydroponics product landscape is evolving rapidly, with a focus on innovative systems offering improved efficiency, yield, and resource utilization. Key product innovations include automated nutrient delivery systems, sophisticated climate control technologies, and AI-powered monitoring platforms. These advancements significantly enhance crop quality and reduce operational costs. The unique selling propositions center on improved yields, reduced water consumption, and year-round production capabilities.

Key Drivers, Barriers & Challenges in Hydroponics Industry

Key Drivers:

  • Increasing demand for fresh produce and organic food.
  • Water scarcity and the need for water-efficient agriculture.
  • Technological advancements leading to higher yields and efficiency.
  • Government support for sustainable agriculture practices.

Key Barriers & Challenges:

  • High initial investment costs for setting up hydroponic systems.
  • Technical expertise required for successful operation.
  • Energy consumption in certain systems, leading to potential higher operational costs.
  • Potential vulnerability to disease outbreaks or pest infestations.

Emerging Opportunities in Hydroponics Industry

Emerging opportunities include expansion into untapped markets in developing countries, development of specialized hydroponic systems for specific crops, increased adoption of vertical farming technologies in urban areas, and growing interest in the production of high-value crops through hydroponics. The integration of IoT and AI into systems also provides new avenues for optimization and higher yields.

Growth Accelerators in the Hydroponics Industry

Technological breakthroughs in automation, AI, and sensor technologies are driving efficiency gains and higher yields. Strategic partnerships between technology providers and growers are accelerating market adoption. Expansion into new geographic markets, particularly in regions facing water stress, presents significant growth opportunities.

Key Players Shaping the Hydroponics Industry Market

  • 4 FreshBox Farms
  • Bright Farms
  • 3 Pegasus Agritech
  • Hydroponic Crop Producers
  • 5 Thanet Eart
  • 2 Village Farms International Inc

Notable Milestones in Hydroponics Industry Sector

  • July 2022: Bustanica unveils the world's largest hydroponic farm, receiving a USD 40 million investment, showcasing significant investor confidence in the sector.
  • October 2022: GrowGeneration Corp expands its retail presence, indicating increasing market accessibility and consumer interest.
  • January 2024: Bright Farms expands its operations, demonstrating the industry's growth and scalability.
  • March 2024: INSONGREEN expands into the Middle East and Africa, highlighting the global relevance of hydroponics in addressing food security challenges.

In-Depth Hydroponics Industry Market Outlook

The hydroponics industry is poised for continued strong growth, driven by technological advancements, increasing consumer demand, and supportive government policies. Strategic partnerships and investments in research and development will play a crucial role in shaping the future of the industry. The potential for market expansion into new geographic regions and the development of innovative hydroponic systems present significant opportunities for growth and investment. The focus on sustainability and efficient resource utilization will continue to be key drivers of market expansion.

Hydroponics Industry Segmentation

  • 1. Production Analysis
  • 2. Consumption Analysis
  • 3. Import Market Analysis (Value & Volume)
  • 4. Export Market Analysis (Value & Volume)
  • 5. Price Trend Analysis

Hydroponics Industry Segmentation By Geography

  • 1. North America
    • 1.1. United States
    • 1.2. Canada
    • 1.3. Mexico
  • 2. South America
    • 2.1. Brazil
    • 2.2. Argentina
    • 2.3. Rest of South America
  • 3. Europe
    • 3.1. United Kingdom
    • 3.2. Germany
    • 3.3. France
    • 3.4. Italy
    • 3.5. Spain
    • 3.6. Russia
    • 3.7. Benelux
    • 3.8. Nordics
    • 3.9. Rest of Europe
  • 4. Middle East & Africa
    • 4.1. Turkey
    • 4.2. Israel
    • 4.3. GCC
    • 4.4. North Africa
    • 4.5. South Africa
    • 4.6. Rest of Middle East & Africa
  • 5. Asia Pacific
    • 5.1. China
    • 5.2. India
    • 5.3. Japan
    • 5.4. South Korea
    • 5.5. ASEAN
    • 5.6. Oceania
    • 5.7. Rest of Asia Pacific
Hydroponics Industry Regional Share


Hydroponics Industry REPORT HIGHLIGHTS

AspectsDetails
Study Period 2019-2033
Base Year 2024
Estimated Year 2025
Forecast Period2025-2033
Historical Period2019-2024
Growth RateCAGR of 7.80% from 2019-2033
Segmentation
    • By Production Analysis
    • By Consumption Analysis
    • By Import Market Analysis (Value & Volume)
    • By Export Market Analysis (Value & Volume)
    • By Price Trend Analysis
  • By Geography
    • North America
      • United States
      • Canada
      • Mexico
    • South America
      • Brazil
      • Argentina
      • Rest of South America
    • Europe
      • United Kingdom
      • Germany
      • France
      • Italy
      • Spain
      • Russia
      • Benelux
      • Nordics
      • Rest of Europe
    • Middle East & Africa
      • Turkey
      • Israel
      • GCC
      • North Africa
      • South Africa
      • Rest of Middle East & Africa
    • Asia Pacific
      • China
      • India
      • Japan
      • South Korea
      • ASEAN
      • Oceania
      • Rest of Asia Pacific


Table of Contents

  1. 1. Introduction
    • 1.1. Research Scope
    • 1.2. Market Segmentation
    • 1.3. Research Methodology
    • 1.4. Definitions and Assumptions
  2. 2. Executive Summary
    • 2.1. Introduction
  3. 3. Market Dynamics
    • 3.1. Introduction
      • 3.2. Market Drivers
        • 3.2.1. Need for Custom Product Development; Use of CROs for Regulatory Services
      • 3.3. Market Restrains
        • 3.3.1. Data and Cyber Security Concerns; Lack of Experts and Professionals in this Industry
      • 3.4. Market Trends
        • 3.4.1. Higher Consumption of Salads and Exotic Vegetables
  4. 4. Market Factor Analysis
    • 4.1. Porters Five Forces
    • 4.2. Supply/Value Chain
    • 4.3. PESTEL analysis
    • 4.4. Market Entropy
    • 4.5. Patent/Trademark Analysis
  5. 5. Global Hydroponics Industry Analysis, Insights and Forecast, 2019-2031
    • 5.1. Market Analysis, Insights and Forecast - by Production Analysis
      • 5.2. Market Analysis, Insights and Forecast - by Consumption Analysis
        • 5.3. Market Analysis, Insights and Forecast - by Import Market Analysis (Value & Volume)
          • 5.4. Market Analysis, Insights and Forecast - by Export Market Analysis (Value & Volume)
            • 5.5. Market Analysis, Insights and Forecast - by Price Trend Analysis
              • 5.6. Market Analysis, Insights and Forecast - by Region
                • 5.6.1. North America
                • 5.6.2. South America
                • 5.6.3. Europe
                • 5.6.4. Middle East & Africa
                • 5.6.5. Asia Pacific
            • 6. North America Hydroponics Industry Analysis, Insights and Forecast, 2019-2031
              • 6.1. Market Analysis, Insights and Forecast - by Production Analysis
                • 6.2. Market Analysis, Insights and Forecast - by Consumption Analysis
                  • 6.3. Market Analysis, Insights and Forecast - by Import Market Analysis (Value & Volume)
                    • 6.4. Market Analysis, Insights and Forecast - by Export Market Analysis (Value & Volume)
                      • 6.5. Market Analysis, Insights and Forecast - by Price Trend Analysis
                      • 7. South America Hydroponics Industry Analysis, Insights and Forecast, 2019-2031
                        • 7.1. Market Analysis, Insights and Forecast - by Production Analysis
                          • 7.2. Market Analysis, Insights and Forecast - by Consumption Analysis
                            • 7.3. Market Analysis, Insights and Forecast - by Import Market Analysis (Value & Volume)
                              • 7.4. Market Analysis, Insights and Forecast - by Export Market Analysis (Value & Volume)
                                • 7.5. Market Analysis, Insights and Forecast - by Price Trend Analysis
                                • 8. Europe Hydroponics Industry Analysis, Insights and Forecast, 2019-2031
                                  • 8.1. Market Analysis, Insights and Forecast - by Production Analysis
                                    • 8.2. Market Analysis, Insights and Forecast - by Consumption Analysis
                                      • 8.3. Market Analysis, Insights and Forecast - by Import Market Analysis (Value & Volume)
                                        • 8.4. Market Analysis, Insights and Forecast - by Export Market Analysis (Value & Volume)
                                          • 8.5. Market Analysis, Insights and Forecast - by Price Trend Analysis
                                          • 9. Middle East & Africa Hydroponics Industry Analysis, Insights and Forecast, 2019-2031
                                            • 9.1. Market Analysis, Insights and Forecast - by Production Analysis
                                              • 9.2. Market Analysis, Insights and Forecast - by Consumption Analysis
                                                • 9.3. Market Analysis, Insights and Forecast - by Import Market Analysis (Value & Volume)
                                                  • 9.4. Market Analysis, Insights and Forecast - by Export Market Analysis (Value & Volume)
                                                    • 9.5. Market Analysis, Insights and Forecast - by Price Trend Analysis
                                                    • 10. Asia Pacific Hydroponics Industry Analysis, Insights and Forecast, 2019-2031
                                                      • 10.1. Market Analysis, Insights and Forecast - by Production Analysis
                                                        • 10.2. Market Analysis, Insights and Forecast - by Consumption Analysis
                                                          • 10.3. Market Analysis, Insights and Forecast - by Import Market Analysis (Value & Volume)
                                                            • 10.4. Market Analysis, Insights and Forecast - by Export Market Analysis (Value & Volume)
                                                              • 10.5. Market Analysis, Insights and Forecast - by Price Trend Analysis
                                                              • 11. North America Hydroponics Industry Analysis, Insights and Forecast, 2019-2031
                                                                  • 11.1. Market Analysis, Insights and Forecast - By Country/Sub-region
                                                                    • 11.1.1 United States
                                                                    • 11.1.2 Canada
                                                                    • 11.1.3 Mexico
                                                                    • 11.1.4 Rest of North America
                                                              • 12. Europe Hydroponics Industry Analysis, Insights and Forecast, 2019-2031
                                                                  • 12.1. Market Analysis, Insights and Forecast - By Country/Sub-region
                                                                    • 12.1.1 Germany
                                                                    • 12.1.2 United Kingdom
                                                                    • 12.1.3 France
                                                                    • 12.1.4 Spain
                                                                    • 12.1.5 Italy
                                                                    • 12.1.6 Netherlands
                                                                    • 12.1.7 Rest of Europe
                                                              • 13. Asia Pacific Hydroponics Industry Analysis, Insights and Forecast, 2019-2031
                                                                  • 13.1. Market Analysis, Insights and Forecast - By Country/Sub-region
                                                                    • 13.1.1 China
                                                                    • 13.1.2 Japan
                                                                    • 13.1.3 India
                                                                    • 13.1.4 Australia
                                                                    • 13.1.5 Rest of Asia Pacific
                                                              • 14. South America Hydroponics Industry Analysis, Insights and Forecast, 2019-2031
                                                                  • 14.1. Market Analysis, Insights and Forecast - By Country/Sub-region
                                                                    • 14.1.1 Brazil
                                                                    • 14.1.2 Argentina
                                                                    • 14.1.3 Rest of South America
                                                              • 15. Middle East and Africa Hydroponics Industry Analysis, Insights and Forecast, 2019-2031
                                                                  • 15.1. Market Analysis, Insights and Forecast - By Country/Sub-region
                                                                    • 15.1.1 Saudi Arabia
                                                                    • 15.1.2 United Arab Emirates
                                                                    • 15.1.3 South Africa
                                                                    • 15.1.4 Rest of Middle East and Africa
                                                              • 16. Competitive Analysis
                                                                • 16.1. Global Market Share Analysis 2024
                                                                  • 16.2. Company Profiles
                                                                    • 16.2.1 4 FreshBox Farms
                                                                      • 16.2.1.1. Overview
                                                                      • 16.2.1.2. Products
                                                                      • 16.2.1.3. SWOT Analysis
                                                                      • 16.2.1.4. Recent Developments
                                                                      • 16.2.1.5. Financials (Based on Availability)
                                                                    • 16.2.2 1 Bright Farms
                                                                      • 16.2.2.1. Overview
                                                                      • 16.2.2.2. Products
                                                                      • 16.2.2.3. SWOT Analysis
                                                                      • 16.2.2.4. Recent Developments
                                                                      • 16.2.2.5. Financials (Based on Availability)
                                                                    • 16.2.3 3 Pegasus Agritech
                                                                      • 16.2.3.1. Overview
                                                                      • 16.2.3.2. Products
                                                                      • 16.2.3.3. SWOT Analysis
                                                                      • 16.2.3.4. Recent Developments
                                                                      • 16.2.3.5. Financials (Based on Availability)
                                                                    • 16.2.4 Hydroponic Crop Producers
                                                                      • 16.2.4.1. Overview
                                                                      • 16.2.4.2. Products
                                                                      • 16.2.4.3. SWOT Analysis
                                                                      • 16.2.4.4. Recent Developments
                                                                      • 16.2.4.5. Financials (Based on Availability)
                                                                    • 16.2.5 5 Thanet Eart
                                                                      • 16.2.5.1. Overview
                                                                      • 16.2.5.2. Products
                                                                      • 16.2.5.3. SWOT Analysis
                                                                      • 16.2.5.4. Recent Developments
                                                                      • 16.2.5.5. Financials (Based on Availability)
                                                                    • 16.2.6 2 Village Farms International Inc
                                                                      • 16.2.6.1. Overview
                                                                      • 16.2.6.2. Products
                                                                      • 16.2.6.3. SWOT Analysis
                                                                      • 16.2.6.4. Recent Developments
                                                                      • 16.2.6.5. Financials (Based on Availability)

                                                              List of Figures

                                                              1. Figure 1: Global Hydroponics Industry Revenue Breakdown (Million, %) by Region 2024 & 2032
                                                              2. Figure 2: North America Hydroponics Industry Revenue (Million), by Country 2024 & 2032
                                                              3. Figure 3: North America Hydroponics Industry Revenue Share (%), by Country 2024 & 2032
                                                              4. Figure 4: Europe Hydroponics Industry Revenue (Million), by Country 2024 & 2032
                                                              5. Figure 5: Europe Hydroponics Industry Revenue Share (%), by Country 2024 & 2032
                                                              6. Figure 6: Asia Pacific Hydroponics Industry Revenue (Million), by Country 2024 & 2032
                                                              7. Figure 7: Asia Pacific Hydroponics Industry Revenue Share (%), by Country 2024 & 2032
                                                              8. Figure 8: South America Hydroponics Industry Revenue (Million), by Country 2024 & 2032
                                                              9. Figure 9: South America Hydroponics Industry Revenue Share (%), by Country 2024 & 2032
                                                              10. Figure 10: Middle East and Africa Hydroponics Industry Revenue (Million), by Country 2024 & 2032
                                                              11. Figure 11: Middle East and Africa Hydroponics Industry Revenue Share (%), by Country 2024 & 2032
                                                              12. Figure 12: North America Hydroponics Industry Revenue (Million), by Production Analysis 2024 & 2032
                                                              13. Figure 13: North America Hydroponics Industry Revenue Share (%), by Production Analysis 2024 & 2032
                                                              14. Figure 14: North America Hydroponics Industry Revenue (Million), by Consumption Analysis 2024 & 2032
                                                              15. Figure 15: North America Hydroponics Industry Revenue Share (%), by Consumption Analysis 2024 & 2032
                                                              16. Figure 16: North America Hydroponics Industry Revenue (Million), by Import Market Analysis (Value & Volume) 2024 & 2032
                                                              17. Figure 17: North America Hydroponics Industry Revenue Share (%), by Import Market Analysis (Value & Volume) 2024 & 2032
                                                              18. Figure 18: North America Hydroponics Industry Revenue (Million), by Export Market Analysis (Value & Volume) 2024 & 2032
                                                              19. Figure 19: North America Hydroponics Industry Revenue Share (%), by Export Market Analysis (Value & Volume) 2024 & 2032
                                                              20. Figure 20: North America Hydroponics Industry Revenue (Million), by Price Trend Analysis 2024 & 2032
                                                              21. Figure 21: North America Hydroponics Industry Revenue Share (%), by Price Trend Analysis 2024 & 2032
                                                              22. Figure 22: North America Hydroponics Industry Revenue (Million), by Country 2024 & 2032
                                                              23. Figure 23: North America Hydroponics Industry Revenue Share (%), by Country 2024 & 2032
                                                              24. Figure 24: South America Hydroponics Industry Revenue (Million), by Production Analysis 2024 & 2032
                                                              25. Figure 25: South America Hydroponics Industry Revenue Share (%), by Production Analysis 2024 & 2032
                                                              26. Figure 26: South America Hydroponics Industry Revenue (Million), by Consumption Analysis 2024 & 2032
                                                              27. Figure 27: South America Hydroponics Industry Revenue Share (%), by Consumption Analysis 2024 & 2032
                                                              28. Figure 28: South America Hydroponics Industry Revenue (Million), by Import Market Analysis (Value & Volume) 2024 & 2032
                                                              29. Figure 29: South America Hydroponics Industry Revenue Share (%), by Import Market Analysis (Value & Volume) 2024 & 2032
                                                              30. Figure 30: South America Hydroponics Industry Revenue (Million), by Export Market Analysis (Value & Volume) 2024 & 2032
                                                              31. Figure 31: South America Hydroponics Industry Revenue Share (%), by Export Market Analysis (Value & Volume) 2024 & 2032
                                                              32. Figure 32: South America Hydroponics Industry Revenue (Million), by Price Trend Analysis 2024 & 2032
                                                              33. Figure 33: South America Hydroponics Industry Revenue Share (%), by Price Trend Analysis 2024 & 2032
                                                              34. Figure 34: South America Hydroponics Industry Revenue (Million), by Country 2024 & 2032
                                                              35. Figure 35: South America Hydroponics Industry Revenue Share (%), by Country 2024 & 2032
                                                              36. Figure 36: Europe Hydroponics Industry Revenue (Million), by Production Analysis 2024 & 2032
                                                              37. Figure 37: Europe Hydroponics Industry Revenue Share (%), by Production Analysis 2024 & 2032
                                                              38. Figure 38: Europe Hydroponics Industry Revenue (Million), by Consumption Analysis 2024 & 2032
                                                              39. Figure 39: Europe Hydroponics Industry Revenue Share (%), by Consumption Analysis 2024 & 2032
                                                              40. Figure 40: Europe Hydroponics Industry Revenue (Million), by Import Market Analysis (Value & Volume) 2024 & 2032
                                                              41. Figure 41: Europe Hydroponics Industry Revenue Share (%), by Import Market Analysis (Value & Volume) 2024 & 2032
                                                              42. Figure 42: Europe Hydroponics Industry Revenue (Million), by Export Market Analysis (Value & Volume) 2024 & 2032
                                                              43. Figure 43: Europe Hydroponics Industry Revenue Share (%), by Export Market Analysis (Value & Volume) 2024 & 2032
                                                              44. Figure 44: Europe Hydroponics Industry Revenue (Million), by Price Trend Analysis 2024 & 2032
                                                              45. Figure 45: Europe Hydroponics Industry Revenue Share (%), by Price Trend Analysis 2024 & 2032
                                                              46. Figure 46: Europe Hydroponics Industry Revenue (Million), by Country 2024 & 2032
                                                              47. Figure 47: Europe Hydroponics Industry Revenue Share (%), by Country 2024 & 2032
                                                              48. Figure 48: Middle East & Africa Hydroponics Industry Revenue (Million), by Production Analysis 2024 & 2032
                                                              49. Figure 49: Middle East & Africa Hydroponics Industry Revenue Share (%), by Production Analysis 2024 & 2032
                                                              50. Figure 50: Middle East & Africa Hydroponics Industry Revenue (Million), by Consumption Analysis 2024 & 2032
                                                              51. Figure 51: Middle East & Africa Hydroponics Industry Revenue Share (%), by Consumption Analysis 2024 & 2032
                                                              52. Figure 52: Middle East & Africa Hydroponics Industry Revenue (Million), by Import Market Analysis (Value & Volume) 2024 & 2032
                                                              53. Figure 53: Middle East & Africa Hydroponics Industry Revenue Share (%), by Import Market Analysis (Value & Volume) 2024 & 2032
                                                              54. Figure 54: Middle East & Africa Hydroponics Industry Revenue (Million), by Export Market Analysis (Value & Volume) 2024 & 2032
                                                              55. Figure 55: Middle East & Africa Hydroponics Industry Revenue Share (%), by Export Market Analysis (Value & Volume) 2024 & 2032
                                                              56. Figure 56: Middle East & Africa Hydroponics Industry Revenue (Million), by Price Trend Analysis 2024 & 2032
                                                              57. Figure 57: Middle East & Africa Hydroponics Industry Revenue Share (%), by Price Trend Analysis 2024 & 2032
                                                              58. Figure 58: Middle East & Africa Hydroponics Industry Revenue (Million), by Country 2024 & 2032
                                                              59. Figure 59: Middle East & Africa Hydroponics Industry Revenue Share (%), by Country 2024 & 2032
                                                              60. Figure 60: Asia Pacific Hydroponics Industry Revenue (Million), by Production Analysis 2024 & 2032
                                                              61. Figure 61: Asia Pacific Hydroponics Industry Revenue Share (%), by Production Analysis 2024 & 2032
                                                              62. Figure 62: Asia Pacific Hydroponics Industry Revenue (Million), by Consumption Analysis 2024 & 2032
                                                              63. Figure 63: Asia Pacific Hydroponics Industry Revenue Share (%), by Consumption Analysis 2024 & 2032
                                                              64. Figure 64: Asia Pacific Hydroponics Industry Revenue (Million), by Import Market Analysis (Value & Volume) 2024 & 2032
                                                              65. Figure 65: Asia Pacific Hydroponics Industry Revenue Share (%), by Import Market Analysis (Value & Volume) 2024 & 2032
                                                              66. Figure 66: Asia Pacific Hydroponics Industry Revenue (Million), by Export Market Analysis (Value & Volume) 2024 & 2032
                                                              67. Figure 67: Asia Pacific Hydroponics Industry Revenue Share (%), by Export Market Analysis (Value & Volume) 2024 & 2032
                                                              68. Figure 68: Asia Pacific Hydroponics Industry Revenue (Million), by Price Trend Analysis 2024 & 2032
                                                              69. Figure 69: Asia Pacific Hydroponics Industry Revenue Share (%), by Price Trend Analysis 2024 & 2032
                                                              70. Figure 70: Asia Pacific Hydroponics Industry Revenue (Million), by Country 2024 & 2032
                                                              71. Figure 71: Asia Pacific Hydroponics Industry Revenue Share (%), by Country 2024 & 2032

                                                              List of Tables

                                                              1. Table 1: Global Hydroponics Industry Revenue Million Forecast, by Region 2019 & 2032
                                                              2. Table 2: Global Hydroponics Industry Revenue Million Forecast, by Production Analysis 2019 & 2032
                                                              3. Table 3: Global Hydroponics Industry Revenue Million Forecast, by Consumption Analysis 2019 & 2032
                                                              4. Table 4: Global Hydroponics Industry Revenue Million Forecast, by Import Market Analysis (Value & Volume) 2019 & 2032
                                                              5. Table 5: Global Hydroponics Industry Revenue Million Forecast, by Export Market Analysis (Value & Volume) 2019 & 2032
                                                              6. Table 6: Global Hydroponics Industry Revenue Million Forecast, by Price Trend Analysis 2019 & 2032
                                                              7. Table 7: Global Hydroponics Industry Revenue Million Forecast, by Region 2019 & 2032
                                                              8. Table 8: Global Hydroponics Industry Revenue Million Forecast, by Country 2019 & 2032
                                                              9. Table 9: United States Hydroponics Industry Revenue (Million) Forecast, by Application 2019 & 2032
                                                              10. Table 10: Canada Hydroponics Industry Revenue (Million) Forecast, by Application 2019 & 2032
                                                              11. Table 11: Mexico Hydroponics Industry Revenue (Million) Forecast, by Application 2019 & 2032
                                                              12. Table 12: Rest of North America Hydroponics Industry Revenue (Million) Forecast, by Application 2019 & 2032
                                                              13. Table 13: Global Hydroponics Industry Revenue Million Forecast, by Country 2019 & 2032
                                                              14. Table 14: Germany Hydroponics Industry Revenue (Million) Forecast, by Application 2019 & 2032
                                                              15. Table 15: United Kingdom Hydroponics Industry Revenue (Million) Forecast, by Application 2019 & 2032
                                                              16. Table 16: France Hydroponics Industry Revenue (Million) Forecast, by Application 2019 & 2032
                                                              17. Table 17: Spain Hydroponics Industry Revenue (Million) Forecast, by Application 2019 & 2032
                                                              18. Table 18: Italy Hydroponics Industry Revenue (Million) Forecast, by Application 2019 & 2032
                                                              19. Table 19: Netherlands Hydroponics Industry Revenue (Million) Forecast, by Application 2019 & 2032
                                                              20. Table 20: Rest of Europe Hydroponics Industry Revenue (Million) Forecast, by Application 2019 & 2032
                                                              21. Table 21: Global Hydroponics Industry Revenue Million Forecast, by Country 2019 & 2032
                                                              22. Table 22: China Hydroponics Industry Revenue (Million) Forecast, by Application 2019 & 2032
                                                              23. Table 23: Japan Hydroponics Industry Revenue (Million) Forecast, by Application 2019 & 2032
                                                              24. Table 24: India Hydroponics Industry Revenue (Million) Forecast, by Application 2019 & 2032
                                                              25. Table 25: Australia Hydroponics Industry Revenue (Million) Forecast, by Application 2019 & 2032
                                                              26. Table 26: Rest of Asia Pacific Hydroponics Industry Revenue (Million) Forecast, by Application 2019 & 2032
                                                              27. Table 27: Global Hydroponics Industry Revenue Million Forecast, by Country 2019 & 2032
                                                              28. Table 28: Brazil Hydroponics Industry Revenue (Million) Forecast, by Application 2019 & 2032
                                                              29. Table 29: Argentina Hydroponics Industry Revenue (Million) Forecast, by Application 2019 & 2032
                                                              30. Table 30: Rest of South America Hydroponics Industry Revenue (Million) Forecast, by Application 2019 & 2032
                                                              31. Table 31: Global Hydroponics Industry Revenue Million Forecast, by Country 2019 & 2032
                                                              32. Table 32: Saudi Arabia Hydroponics Industry Revenue (Million) Forecast, by Application 2019 & 2032
                                                              33. Table 33: United Arab Emirates Hydroponics Industry Revenue (Million) Forecast, by Application 2019 & 2032
                                                              34. Table 34: South Africa Hydroponics Industry Revenue (Million) Forecast, by Application 2019 & 2032
                                                              35. Table 35: Rest of Middle East and Africa Hydroponics Industry Revenue (Million) Forecast, by Application 2019 & 2032
                                                              36. Table 36: Global Hydroponics Industry Revenue Million Forecast, by Production Analysis 2019 & 2032
                                                              37. Table 37: Global Hydroponics Industry Revenue Million Forecast, by Consumption Analysis 2019 & 2032
                                                              38. Table 38: Global Hydroponics Industry Revenue Million Forecast, by Import Market Analysis (Value & Volume) 2019 & 2032
                                                              39. Table 39: Global Hydroponics Industry Revenue Million Forecast, by Export Market Analysis (Value & Volume) 2019 & 2032
                                                              40. Table 40: Global Hydroponics Industry Revenue Million Forecast, by Price Trend Analysis 2019 & 2032
                                                              41. Table 41: Global Hydroponics Industry Revenue Million Forecast, by Country 2019 & 2032
                                                              42. Table 42: United States Hydroponics Industry Revenue (Million) Forecast, by Application 2019 & 2032
                                                              43. Table 43: Canada Hydroponics Industry Revenue (Million) Forecast, by Application 2019 & 2032
                                                              44. Table 44: Mexico Hydroponics Industry Revenue (Million) Forecast, by Application 2019 & 2032
                                                              45. Table 45: Global Hydroponics Industry Revenue Million Forecast, by Production Analysis 2019 & 2032
                                                              46. Table 46: Global Hydroponics Industry Revenue Million Forecast, by Consumption Analysis 2019 & 2032
                                                              47. Table 47: Global Hydroponics Industry Revenue Million Forecast, by Import Market Analysis (Value & Volume) 2019 & 2032
                                                              48. Table 48: Global Hydroponics Industry Revenue Million Forecast, by Export Market Analysis (Value & Volume) 2019 & 2032
                                                              49. Table 49: Global Hydroponics Industry Revenue Million Forecast, by Price Trend Analysis 2019 & 2032
                                                              50. Table 50: Global Hydroponics Industry Revenue Million Forecast, by Country 2019 & 2032
                                                              51. Table 51: Brazil Hydroponics Industry Revenue (Million) Forecast, by Application 2019 & 2032
                                                              52. Table 52: Argentina Hydroponics Industry Revenue (Million) Forecast, by Application 2019 & 2032
                                                              53. Table 53: Rest of South America Hydroponics Industry Revenue (Million) Forecast, by Application 2019 & 2032
                                                              54. Table 54: Global Hydroponics Industry Revenue Million Forecast, by Production Analysis 2019 & 2032
                                                              55. Table 55: Global Hydroponics Industry Revenue Million Forecast, by Consumption Analysis 2019 & 2032
                                                              56. Table 56: Global Hydroponics Industry Revenue Million Forecast, by Import Market Analysis (Value & Volume) 2019 & 2032
                                                              57. Table 57: Global Hydroponics Industry Revenue Million Forecast, by Export Market Analysis (Value & Volume) 2019 & 2032
                                                              58. Table 58: Global Hydroponics Industry Revenue Million Forecast, by Price Trend Analysis 2019 & 2032
                                                              59. Table 59: Global Hydroponics Industry Revenue Million Forecast, by Country 2019 & 2032
                                                              60. Table 60: United Kingdom Hydroponics Industry Revenue (Million) Forecast, by Application 2019 & 2032
                                                              61. Table 61: Germany Hydroponics Industry Revenue (Million) Forecast, by Application 2019 & 2032
                                                              62. Table 62: France Hydroponics Industry Revenue (Million) Forecast, by Application 2019 & 2032
                                                              63. Table 63: Italy Hydroponics Industry Revenue (Million) Forecast, by Application 2019 & 2032
                                                              64. Table 64: Spain Hydroponics Industry Revenue (Million) Forecast, by Application 2019 & 2032
                                                              65. Table 65: Russia Hydroponics Industry Revenue (Million) Forecast, by Application 2019 & 2032
                                                              66. Table 66: Benelux Hydroponics Industry Revenue (Million) Forecast, by Application 2019 & 2032
                                                              67. Table 67: Nordics Hydroponics Industry Revenue (Million) Forecast, by Application 2019 & 2032
                                                              68. Table 68: Rest of Europe Hydroponics Industry Revenue (Million) Forecast, by Application 2019 & 2032
                                                              69. Table 69: Global Hydroponics Industry Revenue Million Forecast, by Production Analysis 2019 & 2032
                                                              70. Table 70: Global Hydroponics Industry Revenue Million Forecast, by Consumption Analysis 2019 & 2032
                                                              71. Table 71: Global Hydroponics Industry Revenue Million Forecast, by Import Market Analysis (Value & Volume) 2019 & 2032
                                                              72. Table 72: Global Hydroponics Industry Revenue Million Forecast, by Export Market Analysis (Value & Volume) 2019 & 2032
                                                              73. Table 73: Global Hydroponics Industry Revenue Million Forecast, by Price Trend Analysis 2019 & 2032
                                                              74. Table 74: Global Hydroponics Industry Revenue Million Forecast, by Country 2019 & 2032
                                                              75. Table 75: Turkey Hydroponics Industry Revenue (Million) Forecast, by Application 2019 & 2032
                                                              76. Table 76: Israel Hydroponics Industry Revenue (Million) Forecast, by Application 2019 & 2032
                                                              77. Table 77: GCC Hydroponics Industry Revenue (Million) Forecast, by Application 2019 & 2032
                                                              78. Table 78: North Africa Hydroponics Industry Revenue (Million) Forecast, by Application 2019 & 2032
                                                              79. Table 79: South Africa Hydroponics Industry Revenue (Million) Forecast, by Application 2019 & 2032
                                                              80. Table 80: Rest of Middle East & Africa Hydroponics Industry Revenue (Million) Forecast, by Application 2019 & 2032
                                                              81. Table 81: Global Hydroponics Industry Revenue Million Forecast, by Production Analysis 2019 & 2032
                                                              82. Table 82: Global Hydroponics Industry Revenue Million Forecast, by Consumption Analysis 2019 & 2032
                                                              83. Table 83: Global Hydroponics Industry Revenue Million Forecast, by Import Market Analysis (Value & Volume) 2019 & 2032
                                                              84. Table 84: Global Hydroponics Industry Revenue Million Forecast, by Export Market Analysis (Value & Volume) 2019 & 2032
                                                              85. Table 85: Global Hydroponics Industry Revenue Million Forecast, by Price Trend Analysis 2019 & 2032
                                                              86. Table 86: Global Hydroponics Industry Revenue Million Forecast, by Country 2019 & 2032
                                                              87. Table 87: China Hydroponics Industry Revenue (Million) Forecast, by Application 2019 & 2032
                                                              88. Table 88: India Hydroponics Industry Revenue (Million) Forecast, by Application 2019 & 2032
                                                              89. Table 89: Japan Hydroponics Industry Revenue (Million) Forecast, by Application 2019 & 2032
                                                              90. Table 90: South Korea Hydroponics Industry Revenue (Million) Forecast, by Application 2019 & 2032
                                                              91. Table 91: ASEAN Hydroponics Industry Revenue (Million) Forecast, by Application 2019 & 2032
                                                              92. Table 92: Oceania Hydroponics Industry Revenue (Million) Forecast, by Application 2019 & 2032
                                                              93. Table 93: Rest of Asia Pacific Hydroponics Industry Revenue (Million) Forecast, by Application 2019 & 2032


                                                              Frequently Asked Questions

                                                              1. What is the projected Compound Annual Growth Rate (CAGR) of the Hydroponics Industry?

                                                              The projected CAGR is approximately 7.80%.

                                                              2. Which companies are prominent players in the Hydroponics Industry?

                                                              Key companies in the market include 4 FreshBox Farms, 1 Bright Farms, 3 Pegasus Agritech, Hydroponic Crop Producers, 5 Thanet Eart, 2 Village Farms International Inc.

                                                              3. What are the main segments of the Hydroponics Industry?

                                                              The market segments include Production Analysis, Consumption Analysis, Import Market Analysis (Value & Volume), Export Market Analysis (Value & Volume), Price Trend Analysis.

                                                              4. Can you provide details about the market size?

                                                              The market size is estimated to be USD 5.06 Million as of 2022.

                                                              5. What are some drivers contributing to market growth?

                                                              Need for Custom Product Development; Use of CROs for Regulatory Services.

                                                              6. What are the notable trends driving market growth?

                                                              Higher Consumption of Salads and Exotic Vegetables.

                                                              7. Are there any restraints impacting market growth?

                                                              Data and Cyber Security Concerns; Lack of Experts and Professionals in this Industry.

                                                              8. Can you provide examples of recent developments in the market?

                                                              March 2024: INSONGREEN announced a significant expansion of its hydroponic and vertical greenhouse production in the Middle East and Africa. This initiative aims to tackle regional water scarcity and food security challenges by utilizing advanced agricultural technologies for sustainable development.

                                                              9. What pricing options are available for accessing the report?

                                                              Pricing options include single-user, multi-user, and enterprise licenses priced at USD 4750, USD 5250, and USD 8750 respectively.

                                                              10. Is the market size provided in terms of value or volume?

                                                              The market size is provided in terms of value, measured in Million.

                                                              11. Are there any specific market keywords associated with the report?

                                                              Yes, the market keyword associated with the report is "Hydroponics Industry," which aids in identifying and referencing the specific market segment covered.

                                                              12. How do I determine which pricing option suits my needs best?

                                                              The pricing options vary based on user requirements and access needs. Individual users may opt for single-user licenses, while businesses requiring broader access may choose multi-user or enterprise licenses for cost-effective access to the report.

                                                              13. Are there any additional resources or data provided in the Hydroponics Industry report?

                                                              While the report offers comprehensive insights, it's advisable to review the specific contents or supplementary materials provided to ascertain if additional resources or data are available.

                                                              14. How can I stay updated on further developments or reports in the Hydroponics Industry?

                                                              To stay informed about further developments, trends, and reports in the Hydroponics Industry, consider subscribing to industry newsletters, following relevant companies and organizations, or regularly checking reputable industry news sources and publications.


                                                              Methodology

                                                              Step 1 - Identification of Relevant Samples Size from Population Database

                                                              Step Chart
                                                              Bar Chart
                                                              Method Chart

                                                              Step 2 - Approaches for Defining Global Market Size (Value, Volume* & Price*)

                                                              Approach Chart
                                                              Top-down and bottom-up approaches are used to validate the global market size and estimate the market size for manufactures, regional segments, product, and application.

                                                              Note*: In applicable scenarios

                                                              Step 3 - Data Sources

                                                              Primary Research

                                                              • Web Analytics
                                                              • Survey Reports
                                                              • Research Institute
                                                              • Latest Research Reports
                                                              • Opinion Leaders

                                                              Secondary Research

                                                              • Annual Reports
                                                              • White Paper
                                                              • Latest Press Release
                                                              • Industry Association
                                                              • Paid Database
                                                              • Investor Presentations
                                                              Analyst Chart

                                                              Step 4 - Data Triangulation

                                                              Involves using different sources of information in order to increase the validity of a study

                                                              These sources are likely to be stakeholders in a program - participants, other researchers, program staff, other community members, and so on.

                                                              Then we put all data in single framework & apply various statistical tools to find out the dynamic on the market.

                                                              During the analysis stage, feedback from the stakeholder groups would be compared to determine areas of agreement as well as areas of divergence

                                                              Additionally, after gathering mixed and scattered data from a wide range of sources, data is triangulated and correlated to come up with estimated figures which are further validated through primary mediums or industry experts, opinion leaders.

                                                              About Visionary Data Reports

                                                              Visionary Data Reports provides future-focused market research, advanced analytics, and strategic insights for technology, healthcare, green energy, and finance. Our reports help you anticipate trends, innovate, and lead in your industry. Our expert team combines primary research, data science, and industry knowledge to deliver actionable intelligence. We offer syndicated reports, custom analytics, and consulting services tailored to your business needs. At Visionary Data Reports, we are committed to quality, transparency, and client satisfaction. Every report is rigorously validated to ensure accuracy and relevance. Our global perspective and forward-thinking approach help you understand both current and emerging market dynamics.

                                                              Stay ahead with Visionary Data Reports. Subscribe to our newsletter for the latest insights and research highlights, and follow us on social media for real-time updates. Visionary Data Reports – Your Guide to Tomorrow’s Opportunities.

                                                              artwork spiralartwork spiralRelated Reports
                                                              artwork underline

                                                              Tomato Seed Market 2025-2033 Overview: Trends, Competitor Dynamics, and Opportunities

                                                              Discover the booming global tomato seed market! This comprehensive analysis reveals key trends, growth drivers (hybrid seeds, protected cultivation), restraints, and regional insights (Asia-Pacific leading) for the period 2019-2033, featuring top players like Sakata Seeds and Syngenta. Projected CAGR of 4.70% showcases significant investment opportunities.

                                                              July 2025
                                                              Base Year: 2024
                                                              No Of Pages: 180
                                                              Price: $3800

                                                              Emerging Trends in Brazil Maize Market: A Technology Perspective 2025-2033

                                                              Discover the dynamic Brazil maize market forecast (2025-2033)! This in-depth analysis reveals key growth drivers, including animal feed, biofuel, and human consumption, alongside major players like Syngenta and Corteva. Explore market size, CAGR, and regional insights to understand this lucrative opportunity.

                                                              July 2025
                                                              Base Year: 2024
                                                              No Of Pages: 180
                                                              Price: $3800

                                                              Future Forecasts for North America Seed Treatment Market Industry Growth

                                                              Discover the booming North American seed treatment market! This in-depth analysis reveals a CAGR of 4.20% (2025-2033), driven by precision farming, pest control needs, and government support. Explore key players, market segments (fungicides, insecticides, crops), and regional trends in the US, Canada, and Mexico. Get the data-driven insights you need to succeed.

                                                              July 2025
                                                              Base Year: 2024
                                                              No Of Pages: 150
                                                              Price: $3800

                                                              Africa Chia Seeds Industry Market’s Drivers and Challenges: Strategic Overview 2025-2033

                                                              Discover the booming African chia seed market! Our analysis reveals a $13.87M market in 2025, projected to grow at a 2.10% CAGR through 2033. Explore key trends, segments (organic, hybrid, processed, omega-3 rich), applications (food & beverage, supplements, personal care), and leading companies. Get insights for investment and market entry.

                                                              July 2025
                                                              Base Year: 2024
                                                              No Of Pages: 180
                                                              Price: $4750

                                                              Strategic Trends in Asia-Pacific Seed Coating Materials Market Market 2025-2033

                                                              The Asia-Pacific seed coating materials market is booming, with an 8% CAGR. Discover key trends, leading companies (BASF, Bayer), and segment analysis (polymers, colorants) driving growth in this $XX million market. Explore the forecast to 2033.

                                                              July 2025
                                                              Base Year: 2024
                                                              No Of Pages: 150
                                                              Price: $3800

                                                              Comprehensive Review of UK Fruits and Vegetables Market Growth Potential

                                                              Discover the booming UK fruits and vegetables market! This in-depth analysis reveals a £31.58 billion market with a 2.97% CAGR (2025-2033), driven by health trends and major players like Tesco and Sainsbury's. Explore regional data, consumption patterns, and future growth potential.

                                                              July 2025
                                                              Base Year: 2024
                                                              No Of Pages: 180
                                                              Price: $3800

                                                              Malaysia Agrochemical Market Market’s Drivers and Challenges: Strategic Overview 2025-2033

                                                              Discover the booming Malaysian agrochemical market! This comprehensive analysis reveals a RM 679.59 million market in 2025, projected to grow at a 4.56% CAGR until 2033. Explore key drivers, trends, restraints, and leading companies shaping this dynamic sector. Learn about fertilizers, pesticides, and other agrochemical segments.

                                                              July 2025
                                                              Base Year: 2024
                                                              No Of Pages: 150
                                                              Price: $3800

                                                              Drivers of Change in Agricultural Surfactant Market Market 2025-2033

                                                              The global agricultural surfactant market is booming, projected to reach $3.56 billion by 2033 with a 6.70% CAGR. Driven by precision agriculture and sustainable farming, this market analysis explores key segments (anionic, nonionic, bio-based), top players (BASF, Clariant), and regional growth trends. Discover the future of agricultural surfactants.

                                                              July 2025
                                                              Base Year: 2024
                                                              No Of Pages: 234
                                                              Price: $4750

                                                              Cameroon Grains Industry Industry Analysis and Consumer Behavior

                                                              Discover the booming Cameroon grains industry! Explore market size, growth trends (4.80% CAGR), key players (Sodecoton, CDC, etc.), and challenges impacting cereals, pulses, and oilseeds in Cameroon from 2019-2033. Invest wisely in this promising African market.

                                                              July 2025
                                                              Base Year: 2024
                                                              No Of Pages: 180
                                                              Price: $3800

                                                              Analyzing Consumer Behavior in Agriculture Market in Tanzania Market

                                                              Discover the booming Tanzanian agriculture market! Projected to reach $17.44 billion in 2025, with a 5.63% CAGR, this report analyzes market size, key players (Syngenta, Rijk Zwaan), growth drivers, and future trends in Tanzania's agricultural sector. Explore market segments, including food crops and investment opportunities.

                                                              July 2025
                                                              Base Year: 2024
                                                              No Of Pages: 150
                                                              Price: $3800

                                                              Analyzing Consumer Behavior in Artificial Intelligence in Agriculture Industry Market

                                                              Discover the booming AI in Agriculture market! This comprehensive analysis reveals a 4.20% CAGR, key drivers, trends, restraints, and regional insights from 2019-2033. Learn about leading companies and applications like precision farming, drone analytics, and weather tracking. Explore market size projections and future growth potential.

                                                              July 2025
                                                              Base Year: 2024
                                                              No Of Pages: 150
                                                              Price: $4750

                                                              Exploring Forestry Machinery Market’s Market Size Dynamics 2025-2033

                                                              The global forestry machinery market is booming, projected to reach $15 billion by 2033, driven by rising timber demand and technological advancements. Explore market trends, key players (Deere, Komatsu, etc.), and regional growth in our comprehensive analysis.

                                                              July 2025
                                                              Base Year: 2024
                                                              No Of Pages: 150
                                                              Price: $4750

                                                              Nutrition Canary Seed Market Competitive Strategies: Trends and Forecasts 2025-2033

                                                              Discover the booming nutrition canary seed market! Explore key trends, growth drivers, and regional market share projections for 2025-2033. Learn about leading companies and the increasing demand driven by health-conscious consumers and the birdseed industry.

                                                              July 2025
                                                              Base Year: 2024
                                                              No Of Pages: 234
                                                              Price: $4750

                                                              Consumer Behavior and Cashews Market in South America Trends

                                                              Discover the booming South American cashew market! This comprehensive analysis reveals a $582.24 million market in 2025, projected to grow at a 5.20% CAGR through 2033. Explore key trends, drivers, and leading companies shaping this lucrative industry.

                                                              July 2025
                                                              Base Year: 2024
                                                              No Of Pages: 180
                                                              Price: $3800

                                                              Strategic Growth Drivers for Rye Industry Market

                                                              Discover the latest market analysis of the global rye industry, projecting a steady CAGR of 2.20% to 2033. Explore key drivers, restraints, and regional trends impacting the growth of rye in food, feed, and beverage applications. Learn about leading companies and future market opportunities.

                                                              July 2025
                                                              Base Year: 2024
                                                              No Of Pages: 234
                                                              Price: $4750

                                                              Comprehensive Overview of Water Soluble Fertilizer Industry Trends: 2025-2033

                                                              Discover the booming water-soluble fertilizer market! Explore its $XX million valuation in 2025, projected 3.80% CAGR growth to 2033, key drivers, trends, and regional insights. Learn about top players and lucrative segments like fertigation and horticultural crops.

                                                              July 2025
                                                              Base Year: 2024
                                                              No Of Pages: 150
                                                              Price: $3800

                                                              Asia-Pacific Agricultural Tractors Market Market Expansion: Growth Outlook 2025-2033

                                                              Discover the booming Asia-Pacific Agricultural Tractors market! Our analysis reveals a $15 billion USD market in 2025, projected to grow at a 6% CAGR through 2033. Explore market size, growth trends, and regional breakdowns for India, China, and other key countries. Learn how technological advancements and government initiatives are shaping the future of farming.

                                                              July 2025
                                                              Base Year: 2024
                                                              No Of Pages: 197
                                                              Price: $3800

                                                              Asia-Pacific Agricultural Enzymes Market Market’s Consumer Preferences: Trends and Analysis 2025-2033

                                                              The Asia-Pacific agricultural enzymes market is booming, projected to reach $XX million by 2025, with a CAGR of 10.30%. This report analyzes market drivers, trends, restraints, and key players like Novozymes and BASF, covering segments like carbohydrases and applications in crop protection. Discover regional insights and forecast data for 2025-2033.

                                                              July 2025
                                                              Base Year: 2024
                                                              No Of Pages: 197
                                                              Price: $3800

                                                              Strategic Vision for USA Agricultural Irrigation Machinery Market Industry Trends

                                                              Discover the booming US agricultural irrigation machinery market! This in-depth analysis reveals projected growth to $3.8B by 2033, driven by water scarcity, precision agriculture, and smart irrigation technology. Explore key players, regional trends, and market segmentation in drip, sprinkler, and pivot irrigation.

                                                              July 2025
                                                              Base Year: 2024
                                                              No Of Pages: 150
                                                              Price: $3800

                                                              Electric Lawn Mowers Market Insightful Market Analysis: Trends and Opportunities 2025-2033

                                                              Discover the booming electric lawn mower market! This comprehensive analysis reveals a CAGR of 6.50%, driven by eco-consciousness and technological advancements. Explore market size, key players (Toro, Husqvarna, etc.), regional trends, and future projections (2025-2033) for residential, professional, and golf course applications.

                                                              July 2025
                                                              Base Year: 2024
                                                              No Of Pages: 150
                                                              Price: $4750

                                                              Business Address

                                                              Head Office

                                                              Office no. A 5010, fifth floor, Solitaire Business Hub, Near Phoenix mall, Pune, Maharashtra 411014

                                                              Contact Information

                                                              Craig Francis

                                                              Business Development Head

                                                              +17162654855

                                                              [email protected]

                                                              Connect With Us

                                                              Secure Payment Partners

                                                              payment image
                                                              RetailLogisticsPackagingAutomotiveHealthcareAgricultureEnergy & PowerFood & BeverageAerospace & DefenseChemicals & MaterialsHospitality and TourismAnimal Nutrition & WellnessConsumer Goods and ServicesReal Estate and ConstructionHome and Property ImprovementTechnology, Media and TelecomManufacturing Products and ServicesFinancial Services and Investment Intelligence

                                                              © 2025 All rights reserved


                                                              Privacy Policy
                                                              Terms and Conditions
                                                              FAQ
                                                              • Home
                                                              • About Us
                                                              • Industries
                                                                • Aerospace & Defense
                                                                • Agriculture
                                                                • Animal Nutrition & Wellness
                                                                • Automotive
                                                                • Chemicals & Materials
                                                                • Consumer Goods and Services
                                                                • Energy & Power
                                                                • Financial Services and Investment Intelligence
                                                                • Food & Beverage
                                                                • Home and Property Improvement
                                                                • Hospitality and Tourism
                                                                • Logistics
                                                                • Manufacturing Products and Services
                                                                • Packaging
                                                                • Professional and Commercial Services
                                                                • Real Estate and Construction
                                                                • Retail
                                                                • Technology, Media and Telecom
                                                                • Healthcare
                                                              • Services
                                                              • Contact
                                                              Main Logo
                                                              • Home
                                                              • About Us
                                                              • Industries
                                                                • Aerospace & Defense
                                                                • Agriculture
                                                                • Animal Nutrition & Wellness
                                                                • Automotive
                                                                • Chemicals & Materials
                                                                • Consumer Goods and Services
                                                                • Energy & Power
                                                                • Financial Services and Investment Intelligence
                                                                • Food & Beverage
                                                                • Home and Property Improvement
                                                                • Hospitality and Tourism
                                                                • Logistics
                                                                • Manufacturing Products and Services
                                                                • Packaging
                                                                • Professional and Commercial Services
                                                                • Real Estate and Construction
                                                                • Retail
                                                                • Technology, Media and Telecom
                                                                • Healthcare
                                                              • Services
                                                              • Contact
                                                              +17162654855
                                                              [email protected]

                                                              +17162654855

                                                              [email protected]