

Key Insights
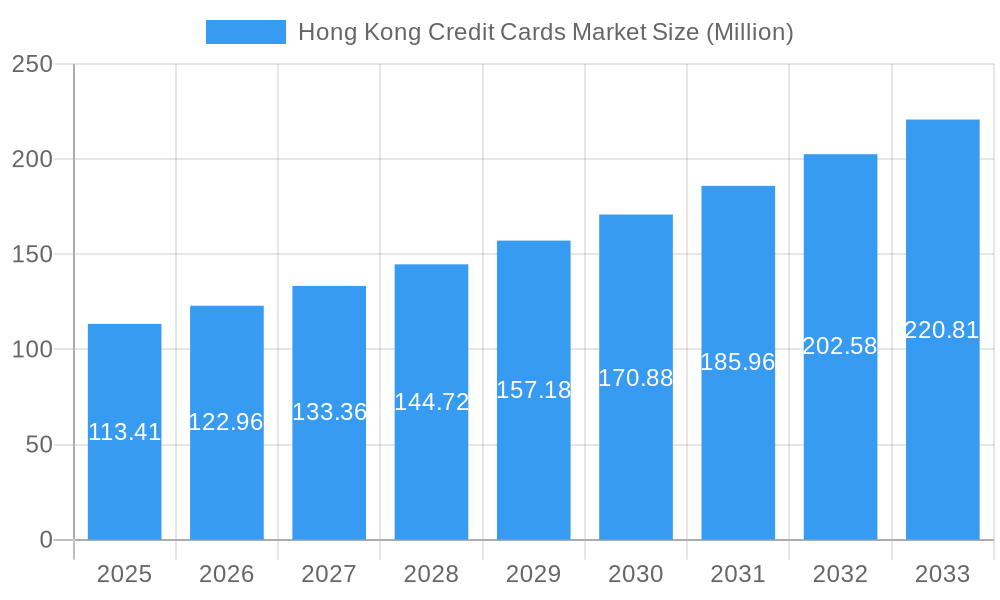
The Hong Kong credit card market, valued at $113.41 million in 2025, is projected to experience robust growth, exhibiting a Compound Annual Growth Rate (CAGR) of 8.68% from 2025 to 2033. This expansion is fueled by several key factors. Increasing disposable incomes among Hong Kong residents, coupled with a growing preference for cashless transactions and the rising popularity of e-commerce, are significant drivers. Furthermore, the continuous innovation in credit card offerings, including rewards programs, travel benefits, and digital-first features, is attracting a wider consumer base. The market’s competitive landscape is dominated by major players such as HSBC, Bank of China, Standard Chartered Bank, and Citibank, among others, each vying for market share through aggressive marketing and product differentiation. However, regulatory changes and potential economic fluctuations represent potential restraints to the market's growth trajectory.
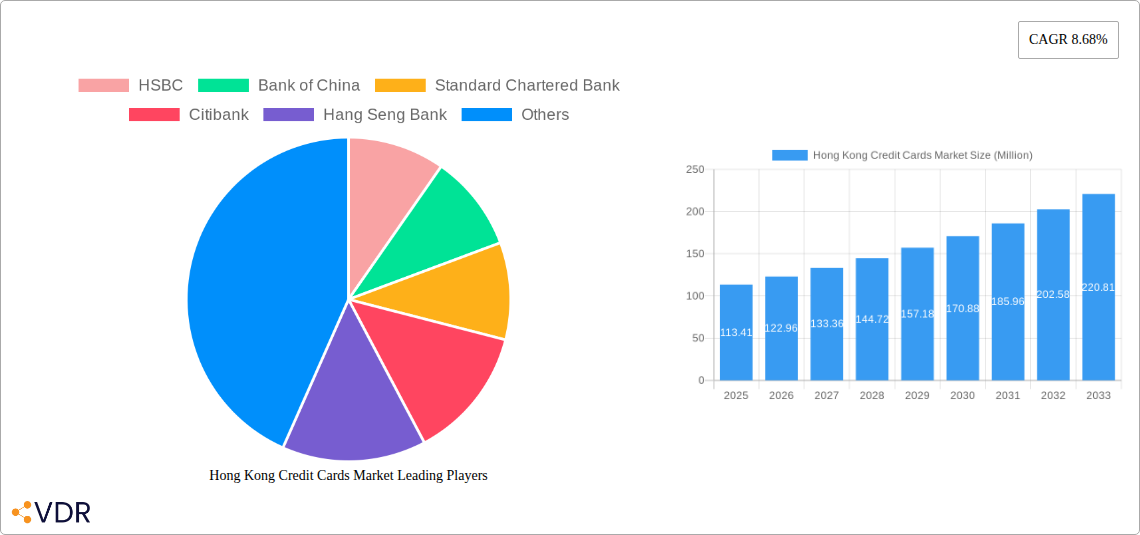
Hong Kong Credit Cards Market Market Size (In Million)
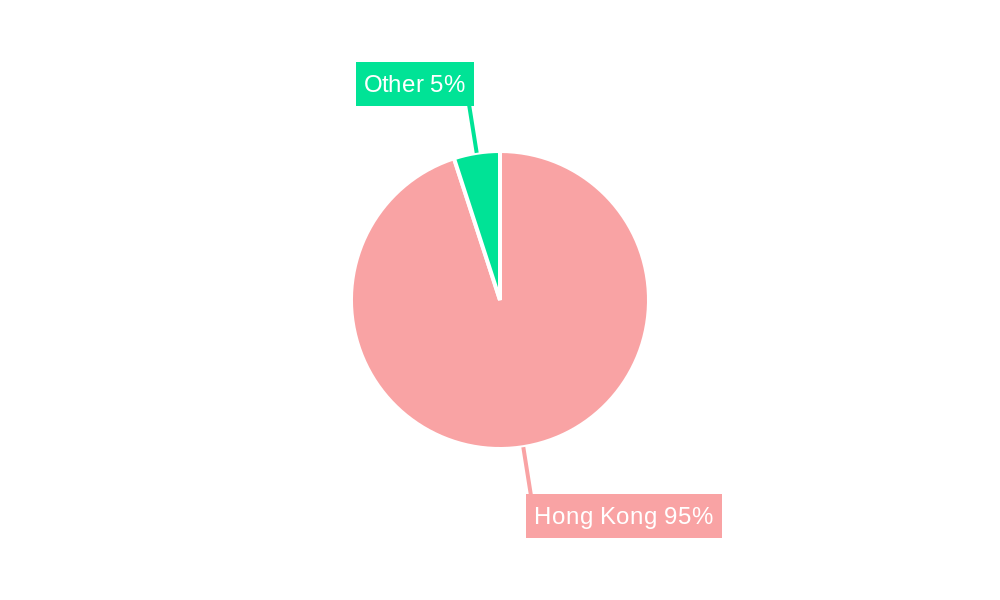
The forecast period (2025-2033) anticipates a steady increase in market size, driven by the aforementioned factors. While specific regional data is unavailable, it's reasonable to assume that the market is primarily concentrated within Hong Kong, with potentially minor contributions from neighboring regions. Given the strong economic ties between Hong Kong and mainland China, cross-border transactions and the increasing number of mainland Chinese tourists could significantly impact the market's future growth. The continued adoption of mobile payment technologies and the expansion of fintech services will also play a vital role in shaping the landscape of the Hong Kong credit card market over the next decade. The competitive intensity will likely remain high, prompting innovation and strategic partnerships among industry players.
Hong Kong Credit Cards Market Company Market Share
Hong Kong Credit Cards Market: A Comprehensive Market Report (2019-2033)
This in-depth report provides a comprehensive analysis of the Hong Kong credit cards market, encompassing market dynamics, growth trends, key players, and future outlook. The study period covers 2019-2033, with 2025 serving as the base and estimated year. The report utilizes data from the historical period (2019-2024) to forecast market trends from 2025-2033, providing valuable insights for industry professionals, investors, and strategic decision-makers. The market is segmented into various categories (details within the report) and analyzed across multiple parent markets including personal finance and business finance. The total market size is estimated at xx Million units in 2025.
Hong Kong Credit Cards Market Dynamics & Structure
The Hong Kong credit cards market exhibits a moderately concentrated structure, dominated by major players such as HSBC, Bank of China, Standard Chartered Bank, Citibank, and Hang Seng Bank. These institutions hold a significant market share, estimated at approximately 70% collectively in 2025. However, smaller players like DBS Bank, American Express, Fubon Bank, Aeon Credit Card Services, and Chong Hing Bank Limited also contribute, creating a competitive landscape.
- Market Concentration: High, with top 5 players controlling 70% of market share (2025 est.).
- Technological Innovation: Driven by digitalization, mobile payment integration, and enhanced security features. Barriers include legacy systems and data privacy concerns.
- Regulatory Framework: Stringent regulations by the Hong Kong Monetary Authority (HKMA) influence credit card issuance and lending practices.
- Competitive Substitutes: Mobile payment platforms like Alipay and WeChat Pay pose significant competition.
- End-User Demographics: Primarily driven by the affluent and middle-class population segments, with increasing adoption among younger generations.
- M&A Trends: Moderate M&A activity, driven by strategic expansion and diversification amongst existing players. Approximately xx M&A deals were recorded between 2019 and 2024.
Hong Kong Credit Cards Market Growth Trends & Insights
The Hong Kong credit card market experienced steady growth during the historical period (2019-2024), primarily fueled by increasing consumer spending, rising disposable incomes, and the growing adoption of e-commerce. The market size grew from xx Million units in 2019 to xx Million units in 2024, representing a CAGR of xx%. This positive trend is projected to continue into the forecast period (2025-2033), with a forecasted CAGR of xx%, driven by continued economic growth, increasing financial inclusion, and the evolving preferences of consumers towards digital payment solutions. Technological disruptions, particularly the adoption of contactless payments and mobile wallets, are further accelerating market expansion and impacting consumer behavior. Market penetration is estimated at xx% in 2025, projected to reach xx% by 2033.
Dominant Regions, Countries, or Segments in Hong Kong Credit Cards Market
Hong Kong Island and Kowloon are the most dominant regions within the Hong Kong Credit Card Market, with higher concentrations of affluent consumers and business activities driving higher card usage and spending.
- Key Drivers: High population density, robust economic activity, and established financial infrastructure.
- Dominance Factors: Higher disposable incomes, greater access to financial services, and a strong preference for credit card usage. Market share for Hong Kong Island and Kowloon is estimated at xx% in 2025.
- Growth Potential: Continued economic growth in these regions fuels optimistic growth projections. The New Territories also shows significant growth potential driven by population growth and infrastructural developments.
Hong Kong Credit Cards Market Product Landscape
The Hong Kong credit card market showcases a wide range of products tailored to diverse consumer segments. Credit cards offer various features including rewards programs (cashback, points, miles), travel insurance, purchase protection, and contactless payment capabilities. Competition is fierce, with key players constantly introducing innovative features to enhance customer loyalty and attract new users. Recent innovations include integration with mobile wallets and the introduction of sustainability-focused cards, responding to growing environmental awareness.
Key Drivers, Barriers & Challenges in Hong Kong Credit Cards Market
Key Drivers:
- Rising disposable incomes and consumer spending.
- Expanding e-commerce and digital payment adoption.
- Government initiatives promoting financial inclusion.
Challenges and Restraints:
- Intense competition amongst established players.
- Increasing prevalence of mobile payment alternatives (e.g., Alipay, WeChat Pay).
- Stringent regulatory compliance requirements.
- The impact of economic downturns on consumer spending.
Emerging Opportunities in Hong Kong Credit Cards Market
- Growth in the demand for customized credit card solutions catering to specific needs and lifestyles.
- Expansion into underserved market segments such as young adults and the elderly.
- Development of innovative financial technology applications integrated with credit card offerings (e.g., budgeting tools, personalized financial advice).
Growth Accelerators in the Hong Kong Credit Cards Market Industry
Strategic partnerships between banks and fintech companies drive innovation and market expansion. Technological advancements such as improved fraud detection systems and AI-powered risk assessment enhance security and efficiency. Continued economic growth and increasing financial literacy among consumers are also key drivers of long-term market expansion.
Key Players Shaping the Hong Kong Credit Cards Market Market
- HSBC
- Bank of China
- Standard Chartered Bank
- Citibank
- Hang Seng Bank
- DBS Bank
- American Express
- Fubon Bank
- Aeon Credit Card Services
- Chong Hing Bank Limited
Notable Milestones in Hong Kong Credit Cards Market Sector
- April 2023: Hang Seng Bank launched a green receivables financing solution for Leo Paper Group, supported by the Hong Kong Export Credit Insurance Corporation, promoting supply chain sustainability. This signifies a shift towards environmentally conscious financial products.
- April 2023: Hang Seng Bank and Chubb established a 15-year distribution agreement, providing Hang Seng customers with comprehensive insurance solutions. This strategic partnership expands product offerings and enhances customer value.
In-Depth Hong Kong Credit Cards Market Market Outlook
The Hong Kong credit cards market is poised for sustained growth in the coming years, driven by ongoing digitalization, expanding financial inclusion, and the increasing adoption of innovative financial products. Strategic partnerships, technological advancements, and favorable economic conditions will further accelerate market expansion. The market presents significant opportunities for both established players and emerging fintech companies, highlighting its dynamic and competitive nature.
Hong Kong Credit Cards Market Segmentation
-
1. Card Type
- 1.1. General Purpose Credit Cards
- 1.2. Specialty & Other Credit Cards
-
2. Application
- 2.1. Food & Groceries
- 2.2. Health & Pharmacy
- 2.3. Restaurants & Bars
- 2.4. Consumer Electronics
- 2.5. Media & Entertainment
- 2.6. Travel & Tourism
- 2.7. Other Applications
-
3. Provider
- 3.1. Visa
- 3.2. MasterCard
- 3.3. Other Providers
Hong Kong Credit Cards Market Segmentation By Geography
-
1. North America
- 1.1. United States
- 1.2. Canada
- 1.3. Mexico
-
2. South America
- 2.1. Brazil
- 2.2. Argentina
- 2.3. Rest of South America
-
3. Europe
- 3.1. United Kingdom
- 3.2. Germany
- 3.3. France
- 3.4. Italy
- 3.5. Spain
- 3.6. Russia
- 3.7. Benelux
- 3.8. Nordics
- 3.9. Rest of Europe
-
4. Middle East & Africa
- 4.1. Turkey
- 4.2. Israel
- 4.3. GCC
- 4.4. North Africa
- 4.5. South Africa
- 4.6. Rest of Middle East & Africa
-
5. Asia Pacific
- 5.1. China
- 5.2. India
- 5.3. Japan
- 5.4. South Korea
- 5.5. ASEAN
- 5.6. Oceania
- 5.7. Rest of Asia Pacific
Hong Kong Credit Cards Market Regional Market Share
Geographic Coverage of Hong Kong Credit Cards Market
Hong Kong Credit Cards Market REPORT HIGHLIGHTS
| Aspects | Details |
|---|---|
| Study Period | 2020-2034 |
| Base Year | 2025 |
| Estimated Year | 2026 |
| Forecast Period | 2026-2034 |
| Historical Period | 2020-2025 |
| Growth Rate | CAGR of 8.68% from 2020-2034 |
| Segmentation |
|
Table of Contents
- 1. Introduction
- 1.1. Research Scope
- 1.2. Market Segmentation
- 1.3. Research Objective
- 1.4. Definitions and Assumptions
- 2. Executive Summary
- 2.1. Market Snapshot
- 3. Market Dynamics
- 3.1. Market Drivers
- 3.2. Market Restrains
- 3.3. Market Trends
- 3.4. Market Opportunities
- 4. Market Factor Analysis
- 4.1. Porters Five Forces
- 4.1.1. Bargaining Power of Suppliers
- 4.1.2. Bargaining Power of Buyers
- 4.1.3. Threat of New Entrants
- 4.1.4. Threat of Substitutes
- 4.1.5. Competitive Rivalry
- 4.2. PESTEL analysis
- 4.3. BCG Analysis
- 4.3.1. Stars (High Growth, High Market Share)
- 4.3.2. Cash Cows (Low Growth, High Market Share)
- 4.3.3. Question Mark (High Growth, Low Market Share)
- 4.3.4. Dogs (Low Growth, Low Market Share)
- 4.4. Ansoff Matrix Analysis
- 4.5. Supply Chain Analysis
- 4.6. Regulatory Landscape
- 4.7. Current Market Potential and Opportunity Assessment (TAM–SAM–SOM Framework)
- 4.8. VDR Analyst Note
- 4.1. Porters Five Forces
- 5. Market Analysis, Insights and Forecast 2021-2033
- 5.1. Market Analysis, Insights and Forecast - by Card Type
- 5.1.1. General Purpose Credit Cards
- 5.1.2. Specialty & Other Credit Cards
- 5.2. Market Analysis, Insights and Forecast - by Application
- 5.2.1. Food & Groceries
- 5.2.2. Health & Pharmacy
- 5.2.3. Restaurants & Bars
- 5.2.4. Consumer Electronics
- 5.2.5. Media & Entertainment
- 5.2.6. Travel & Tourism
- 5.2.7. Other Applications
- 5.3. Market Analysis, Insights and Forecast - by Provider
- 5.3.1. Visa
- 5.3.2. MasterCard
- 5.3.3. Other Providers
- 5.4. Market Analysis, Insights and Forecast - by Region
- 5.4.1. North America
- 5.4.2. South America
- 5.4.3. Europe
- 5.4.4. Middle East & Africa
- 5.4.5. Asia Pacific
- 5.1. Market Analysis, Insights and Forecast - by Card Type
- 6. Global Hong Kong Credit Cards Market Analysis, Insights and Forecast, 2021-2033
- 6.1. Market Analysis, Insights and Forecast - by Card Type
- 6.1.1. General Purpose Credit Cards
- 6.1.2. Specialty & Other Credit Cards
- 6.2. Market Analysis, Insights and Forecast - by Application
- 6.2.1. Food & Groceries
- 6.2.2. Health & Pharmacy
- 6.2.3. Restaurants & Bars
- 6.2.4. Consumer Electronics
- 6.2.5. Media & Entertainment
- 6.2.6. Travel & Tourism
- 6.2.7. Other Applications
- 6.3. Market Analysis, Insights and Forecast - by Provider
- 6.3.1. Visa
- 6.3.2. MasterCard
- 6.3.3. Other Providers
- 6.1. Market Analysis, Insights and Forecast - by Card Type
- 7. North America Hong Kong Credit Cards Market Analysis, Insights and Forecast, 2021-2033
- 7.1. Market Analysis, Insights and Forecast - by Card Type
- 7.1.1. General Purpose Credit Cards
- 7.1.2. Specialty & Other Credit Cards
- 7.2. Market Analysis, Insights and Forecast - by Application
- 7.2.1. Food & Groceries
- 7.2.2. Health & Pharmacy
- 7.2.3. Restaurants & Bars
- 7.2.4. Consumer Electronics
- 7.2.5. Media & Entertainment
- 7.2.6. Travel & Tourism
- 7.2.7. Other Applications
- 7.3. Market Analysis, Insights and Forecast - by Provider
- 7.3.1. Visa
- 7.3.2. MasterCard
- 7.3.3. Other Providers
- 7.1. Market Analysis, Insights and Forecast - by Card Type
- 8. South America Hong Kong Credit Cards Market Analysis, Insights and Forecast, 2021-2033
- 8.1. Market Analysis, Insights and Forecast - by Card Type
- 8.1.1. General Purpose Credit Cards
- 8.1.2. Specialty & Other Credit Cards
- 8.2. Market Analysis, Insights and Forecast - by Application
- 8.2.1. Food & Groceries
- 8.2.2. Health & Pharmacy
- 8.2.3. Restaurants & Bars
- 8.2.4. Consumer Electronics
- 8.2.5. Media & Entertainment
- 8.2.6. Travel & Tourism
- 8.2.7. Other Applications
- 8.3. Market Analysis, Insights and Forecast - by Provider
- 8.3.1. Visa
- 8.3.2. MasterCard
- 8.3.3. Other Providers
- 8.1. Market Analysis, Insights and Forecast - by Card Type
- 9. Europe Hong Kong Credit Cards Market Analysis, Insights and Forecast, 2021-2033
- 9.1. Market Analysis, Insights and Forecast - by Card Type
- 9.1.1. General Purpose Credit Cards
- 9.1.2. Specialty & Other Credit Cards
- 9.2. Market Analysis, Insights and Forecast - by Application
- 9.2.1. Food & Groceries
- 9.2.2. Health & Pharmacy
- 9.2.3. Restaurants & Bars
- 9.2.4. Consumer Electronics
- 9.2.5. Media & Entertainment
- 9.2.6. Travel & Tourism
- 9.2.7. Other Applications
- 9.3. Market Analysis, Insights and Forecast - by Provider
- 9.3.1. Visa
- 9.3.2. MasterCard
- 9.3.3. Other Providers
- 9.1. Market Analysis, Insights and Forecast - by Card Type
- 10. Middle East & Africa Hong Kong Credit Cards Market Analysis, Insights and Forecast, 2021-2033
- 10.1. Market Analysis, Insights and Forecast - by Card Type
- 10.1.1. General Purpose Credit Cards
- 10.1.2. Specialty & Other Credit Cards
- 10.2. Market Analysis, Insights and Forecast - by Application
- 10.2.1. Food & Groceries
- 10.2.2. Health & Pharmacy
- 10.2.3. Restaurants & Bars
- 10.2.4. Consumer Electronics
- 10.2.5. Media & Entertainment
- 10.2.6. Travel & Tourism
- 10.2.7. Other Applications
- 10.3. Market Analysis, Insights and Forecast - by Provider
- 10.3.1. Visa
- 10.3.2. MasterCard
- 10.3.3. Other Providers
- 10.1. Market Analysis, Insights and Forecast - by Card Type
- 11. Asia Pacific Hong Kong Credit Cards Market Analysis, Insights and Forecast, 2021-2033
- 11.1. Market Analysis, Insights and Forecast - by Card Type
- 11.1.1. General Purpose Credit Cards
- 11.1.2. Specialty & Other Credit Cards
- 11.2. Market Analysis, Insights and Forecast - by Application
- 11.2.1. Food & Groceries
- 11.2.2. Health & Pharmacy
- 11.2.3. Restaurants & Bars
- 11.2.4. Consumer Electronics
- 11.2.5. Media & Entertainment
- 11.2.6. Travel & Tourism
- 11.2.7. Other Applications
- 11.3. Market Analysis, Insights and Forecast - by Provider
- 11.3.1. Visa
- 11.3.2. MasterCard
- 11.3.3. Other Providers
- 11.1. Market Analysis, Insights and Forecast - by Card Type
- 12. Competitive Analysis
- 12.1. Company Profiles
- 12.1.1 HSBC
- 12.1.1.1. Company Overview
- 12.1.1.2. Products
- 12.1.1.3. Company Financials
- 12.1.1.4. SWOT Analysis
- 12.1.2 Bank of China
- 12.1.2.1. Company Overview
- 12.1.2.2. Products
- 12.1.2.3. Company Financials
- 12.1.2.4. SWOT Analysis
- 12.1.3 Standard Chartered Bank
- 12.1.3.1. Company Overview
- 12.1.3.2. Products
- 12.1.3.3. Company Financials
- 12.1.3.4. SWOT Analysis
- 12.1.4 Citibank
- 12.1.4.1. Company Overview
- 12.1.4.2. Products
- 12.1.4.3. Company Financials
- 12.1.4.4. SWOT Analysis
- 12.1.5 Hang Seng Bank
- 12.1.5.1. Company Overview
- 12.1.5.2. Products
- 12.1.5.3. Company Financials
- 12.1.5.4. SWOT Analysis
- 12.1.6 DBS Bank
- 12.1.6.1. Company Overview
- 12.1.6.2. Products
- 12.1.6.3. Company Financials
- 12.1.6.4. SWOT Analysis
- 12.1.7 American Express
- 12.1.7.1. Company Overview
- 12.1.7.2. Products
- 12.1.7.3. Company Financials
- 12.1.7.4. SWOT Analysis
- 12.1.8 Fubon Bank
- 12.1.8.1. Company Overview
- 12.1.8.2. Products
- 12.1.8.3. Company Financials
- 12.1.8.4. SWOT Analysis
- 12.1.9 Aeon Credit Card Services
- 12.1.9.1. Company Overview
- 12.1.9.2. Products
- 12.1.9.3. Company Financials
- 12.1.9.4. SWOT Analysis
- 12.1.10 Chong Hing Bank Limited**List Not Exhaustive
- 12.1.10.1. Company Overview
- 12.1.10.2. Products
- 12.1.10.3. Company Financials
- 12.1.10.4. SWOT Analysis
- 12.1.1 HSBC
- 12.2. Market Entropy
- 12.2.1 Company's Key Areas Served
- 12.2.2 Recent Developments
- 12.3. Company Market Share Analysis 2025
- 12.3.1 Top 5 Companies Market Share Analysis
- 12.3.2 Top 3 Companies Market Share Analysis
- 12.4. List of Potential Customers
- 13. Research Methodology
List of Figures
- Figure 1: Global Hong Kong Credit Cards Market Revenue Breakdown (Million, %) by Region 2025 & 2033
- Figure 2: Global Hong Kong Credit Cards Market Volume Breakdown (Billion, %) by Region 2025 & 2033
- Figure 3: North America Hong Kong Credit Cards Market Revenue (Million), by Card Type 2025 & 2033
- Figure 4: North America Hong Kong Credit Cards Market Volume (Billion), by Card Type 2025 & 2033
- Figure 5: North America Hong Kong Credit Cards Market Revenue Share (%), by Card Type 2025 & 2033
- Figure 6: North America Hong Kong Credit Cards Market Volume Share (%), by Card Type 2025 & 2033
- Figure 7: North America Hong Kong Credit Cards Market Revenue (Million), by Application 2025 & 2033
- Figure 8: North America Hong Kong Credit Cards Market Volume (Billion), by Application 2025 & 2033
- Figure 9: North America Hong Kong Credit Cards Market Revenue Share (%), by Application 2025 & 2033
- Figure 10: North America Hong Kong Credit Cards Market Volume Share (%), by Application 2025 & 2033
- Figure 11: North America Hong Kong Credit Cards Market Revenue (Million), by Provider 2025 & 2033
- Figure 12: North America Hong Kong Credit Cards Market Volume (Billion), by Provider 2025 & 2033
- Figure 13: North America Hong Kong Credit Cards Market Revenue Share (%), by Provider 2025 & 2033
- Figure 14: North America Hong Kong Credit Cards Market Volume Share (%), by Provider 2025 & 2033
- Figure 15: North America Hong Kong Credit Cards Market Revenue (Million), by Country 2025 & 2033
- Figure 16: North America Hong Kong Credit Cards Market Volume (Billion), by Country 2025 & 2033
- Figure 17: North America Hong Kong Credit Cards Market Revenue Share (%), by Country 2025 & 2033
- Figure 18: North America Hong Kong Credit Cards Market Volume Share (%), by Country 2025 & 2033
- Figure 19: South America Hong Kong Credit Cards Market Revenue (Million), by Card Type 2025 & 2033
- Figure 20: South America Hong Kong Credit Cards Market Volume (Billion), by Card Type 2025 & 2033
- Figure 21: South America Hong Kong Credit Cards Market Revenue Share (%), by Card Type 2025 & 2033
- Figure 22: South America Hong Kong Credit Cards Market Volume Share (%), by Card Type 2025 & 2033
- Figure 23: South America Hong Kong Credit Cards Market Revenue (Million), by Application 2025 & 2033
- Figure 24: South America Hong Kong Credit Cards Market Volume (Billion), by Application 2025 & 2033
- Figure 25: South America Hong Kong Credit Cards Market Revenue Share (%), by Application 2025 & 2033
- Figure 26: South America Hong Kong Credit Cards Market Volume Share (%), by Application 2025 & 2033
- Figure 27: South America Hong Kong Credit Cards Market Revenue (Million), by Provider 2025 & 2033
- Figure 28: South America Hong Kong Credit Cards Market Volume (Billion), by Provider 2025 & 2033
- Figure 29: South America Hong Kong Credit Cards Market Revenue Share (%), by Provider 2025 & 2033
- Figure 30: South America Hong Kong Credit Cards Market Volume Share (%), by Provider 2025 & 2033
- Figure 31: South America Hong Kong Credit Cards Market Revenue (Million), by Country 2025 & 2033
- Figure 32: South America Hong Kong Credit Cards Market Volume (Billion), by Country 2025 & 2033
- Figure 33: South America Hong Kong Credit Cards Market Revenue Share (%), by Country 2025 & 2033
- Figure 34: South America Hong Kong Credit Cards Market Volume Share (%), by Country 2025 & 2033
- Figure 35: Europe Hong Kong Credit Cards Market Revenue (Million), by Card Type 2025 & 2033
- Figure 36: Europe Hong Kong Credit Cards Market Volume (Billion), by Card Type 2025 & 2033
- Figure 37: Europe Hong Kong Credit Cards Market Revenue Share (%), by Card Type 2025 & 2033
- Figure 38: Europe Hong Kong Credit Cards Market Volume Share (%), by Card Type 2025 & 2033
- Figure 39: Europe Hong Kong Credit Cards Market Revenue (Million), by Application 2025 & 2033
- Figure 40: Europe Hong Kong Credit Cards Market Volume (Billion), by Application 2025 & 2033
- Figure 41: Europe Hong Kong Credit Cards Market Revenue Share (%), by Application 2025 & 2033
- Figure 42: Europe Hong Kong Credit Cards Market Volume Share (%), by Application 2025 & 2033
- Figure 43: Europe Hong Kong Credit Cards Market Revenue (Million), by Provider 2025 & 2033
- Figure 44: Europe Hong Kong Credit Cards Market Volume (Billion), by Provider 2025 & 2033
- Figure 45: Europe Hong Kong Credit Cards Market Revenue Share (%), by Provider 2025 & 2033
- Figure 46: Europe Hong Kong Credit Cards Market Volume Share (%), by Provider 2025 & 2033
- Figure 47: Europe Hong Kong Credit Cards Market Revenue (Million), by Country 2025 & 2033
- Figure 48: Europe Hong Kong Credit Cards Market Volume (Billion), by Country 2025 & 2033
- Figure 49: Europe Hong Kong Credit Cards Market Revenue Share (%), by Country 2025 & 2033
- Figure 50: Europe Hong Kong Credit Cards Market Volume Share (%), by Country 2025 & 2033
- Figure 51: Middle East & Africa Hong Kong Credit Cards Market Revenue (Million), by Card Type 2025 & 2033
- Figure 52: Middle East & Africa Hong Kong Credit Cards Market Volume (Billion), by Card Type 2025 & 2033
- Figure 53: Middle East & Africa Hong Kong Credit Cards Market Revenue Share (%), by Card Type 2025 & 2033
- Figure 54: Middle East & Africa Hong Kong Credit Cards Market Volume Share (%), by Card Type 2025 & 2033
- Figure 55: Middle East & Africa Hong Kong Credit Cards Market Revenue (Million), by Application 2025 & 2033
- Figure 56: Middle East & Africa Hong Kong Credit Cards Market Volume (Billion), by Application 2025 & 2033
- Figure 57: Middle East & Africa Hong Kong Credit Cards Market Revenue Share (%), by Application 2025 & 2033
- Figure 58: Middle East & Africa Hong Kong Credit Cards Market Volume Share (%), by Application 2025 & 2033
- Figure 59: Middle East & Africa Hong Kong Credit Cards Market Revenue (Million), by Provider 2025 & 2033
- Figure 60: Middle East & Africa Hong Kong Credit Cards Market Volume (Billion), by Provider 2025 & 2033
- Figure 61: Middle East & Africa Hong Kong Credit Cards Market Revenue Share (%), by Provider 2025 & 2033
- Figure 62: Middle East & Africa Hong Kong Credit Cards Market Volume Share (%), by Provider 2025 & 2033
- Figure 63: Middle East & Africa Hong Kong Credit Cards Market Revenue (Million), by Country 2025 & 2033
- Figure 64: Middle East & Africa Hong Kong Credit Cards Market Volume (Billion), by Country 2025 & 2033
- Figure 65: Middle East & Africa Hong Kong Credit Cards Market Revenue Share (%), by Country 2025 & 2033
- Figure 66: Middle East & Africa Hong Kong Credit Cards Market Volume Share (%), by Country 2025 & 2033
- Figure 67: Asia Pacific Hong Kong Credit Cards Market Revenue (Million), by Card Type 2025 & 2033
- Figure 68: Asia Pacific Hong Kong Credit Cards Market Volume (Billion), by Card Type 2025 & 2033
- Figure 69: Asia Pacific Hong Kong Credit Cards Market Revenue Share (%), by Card Type 2025 & 2033
- Figure 70: Asia Pacific Hong Kong Credit Cards Market Volume Share (%), by Card Type 2025 & 2033
- Figure 71: Asia Pacific Hong Kong Credit Cards Market Revenue (Million), by Application 2025 & 2033
- Figure 72: Asia Pacific Hong Kong Credit Cards Market Volume (Billion), by Application 2025 & 2033
- Figure 73: Asia Pacific Hong Kong Credit Cards Market Revenue Share (%), by Application 2025 & 2033
- Figure 74: Asia Pacific Hong Kong Credit Cards Market Volume Share (%), by Application 2025 & 2033
- Figure 75: Asia Pacific Hong Kong Credit Cards Market Revenue (Million), by Provider 2025 & 2033
- Figure 76: Asia Pacific Hong Kong Credit Cards Market Volume (Billion), by Provider 2025 & 2033
- Figure 77: Asia Pacific Hong Kong Credit Cards Market Revenue Share (%), by Provider 2025 & 2033
- Figure 78: Asia Pacific Hong Kong Credit Cards Market Volume Share (%), by Provider 2025 & 2033
- Figure 79: Asia Pacific Hong Kong Credit Cards Market Revenue (Million), by Country 2025 & 2033
- Figure 80: Asia Pacific Hong Kong Credit Cards Market Volume (Billion), by Country 2025 & 2033
- Figure 81: Asia Pacific Hong Kong Credit Cards Market Revenue Share (%), by Country 2025 & 2033
- Figure 82: Asia Pacific Hong Kong Credit Cards Market Volume Share (%), by Country 2025 & 2033
List of Tables
- Table 1: Global Hong Kong Credit Cards Market Revenue Million Forecast, by Card Type 2020 & 2033
- Table 2: Global Hong Kong Credit Cards Market Volume Billion Forecast, by Card Type 2020 & 2033
- Table 3: Global Hong Kong Credit Cards Market Revenue Million Forecast, by Application 2020 & 2033
- Table 4: Global Hong Kong Credit Cards Market Volume Billion Forecast, by Application 2020 & 2033
- Table 5: Global Hong Kong Credit Cards Market Revenue Million Forecast, by Provider 2020 & 2033
- Table 6: Global Hong Kong Credit Cards Market Volume Billion Forecast, by Provider 2020 & 2033
- Table 7: Global Hong Kong Credit Cards Market Revenue Million Forecast, by Region 2020 & 2033
- Table 8: Global Hong Kong Credit Cards Market Volume Billion Forecast, by Region 2020 & 2033
- Table 9: Global Hong Kong Credit Cards Market Revenue Million Forecast, by Card Type 2020 & 2033
- Table 10: Global Hong Kong Credit Cards Market Volume Billion Forecast, by Card Type 2020 & 2033
- Table 11: Global Hong Kong Credit Cards Market Revenue Million Forecast, by Application 2020 & 2033
- Table 12: Global Hong Kong Credit Cards Market Volume Billion Forecast, by Application 2020 & 2033
- Table 13: Global Hong Kong Credit Cards Market Revenue Million Forecast, by Provider 2020 & 2033
- Table 14: Global Hong Kong Credit Cards Market Volume Billion Forecast, by Provider 2020 & 2033
- Table 15: Global Hong Kong Credit Cards Market Revenue Million Forecast, by Country 2020 & 2033
- Table 16: Global Hong Kong Credit Cards Market Volume Billion Forecast, by Country 2020 & 2033
- Table 17: United States Hong Kong Credit Cards Market Revenue (Million) Forecast, by Application 2020 & 2033
- Table 18: United States Hong Kong Credit Cards Market Volume (Billion) Forecast, by Application 2020 & 2033
- Table 19: Canada Hong Kong Credit Cards Market Revenue (Million) Forecast, by Application 2020 & 2033
- Table 20: Canada Hong Kong Credit Cards Market Volume (Billion) Forecast, by Application 2020 & 2033
- Table 21: Mexico Hong Kong Credit Cards Market Revenue (Million) Forecast, by Application 2020 & 2033
- Table 22: Mexico Hong Kong Credit Cards Market Volume (Billion) Forecast, by Application 2020 & 2033
- Table 23: Global Hong Kong Credit Cards Market Revenue Million Forecast, by Card Type 2020 & 2033
- Table 24: Global Hong Kong Credit Cards Market Volume Billion Forecast, by Card Type 2020 & 2033
- Table 25: Global Hong Kong Credit Cards Market Revenue Million Forecast, by Application 2020 & 2033
- Table 26: Global Hong Kong Credit Cards Market Volume Billion Forecast, by Application 2020 & 2033
- Table 27: Global Hong Kong Credit Cards Market Revenue Million Forecast, by Provider 2020 & 2033
- Table 28: Global Hong Kong Credit Cards Market Volume Billion Forecast, by Provider 2020 & 2033
- Table 29: Global Hong Kong Credit Cards Market Revenue Million Forecast, by Country 2020 & 2033
- Table 30: Global Hong Kong Credit Cards Market Volume Billion Forecast, by Country 2020 & 2033
- Table 31: Brazil Hong Kong Credit Cards Market Revenue (Million) Forecast, by Application 2020 & 2033
- Table 32: Brazil Hong Kong Credit Cards Market Volume (Billion) Forecast, by Application 2020 & 2033
- Table 33: Argentina Hong Kong Credit Cards Market Revenue (Million) Forecast, by Application 2020 & 2033
- Table 34: Argentina Hong Kong Credit Cards Market Volume (Billion) Forecast, by Application 2020 & 2033
- Table 35: Rest of South America Hong Kong Credit Cards Market Revenue (Million) Forecast, by Application 2020 & 2033
- Table 36: Rest of South America Hong Kong Credit Cards Market Volume (Billion) Forecast, by Application 2020 & 2033
- Table 37: Global Hong Kong Credit Cards Market Revenue Million Forecast, by Card Type 2020 & 2033
- Table 38: Global Hong Kong Credit Cards Market Volume Billion Forecast, by Card Type 2020 & 2033
- Table 39: Global Hong Kong Credit Cards Market Revenue Million Forecast, by Application 2020 & 2033
- Table 40: Global Hong Kong Credit Cards Market Volume Billion Forecast, by Application 2020 & 2033
- Table 41: Global Hong Kong Credit Cards Market Revenue Million Forecast, by Provider 2020 & 2033
- Table 42: Global Hong Kong Credit Cards Market Volume Billion Forecast, by Provider 2020 & 2033
- Table 43: Global Hong Kong Credit Cards Market Revenue Million Forecast, by Country 2020 & 2033
- Table 44: Global Hong Kong Credit Cards Market Volume Billion Forecast, by Country 2020 & 2033
- Table 45: United Kingdom Hong Kong Credit Cards Market Revenue (Million) Forecast, by Application 2020 & 2033
- Table 46: United Kingdom Hong Kong Credit Cards Market Volume (Billion) Forecast, by Application 2020 & 2033
- Table 47: Germany Hong Kong Credit Cards Market Revenue (Million) Forecast, by Application 2020 & 2033
- Table 48: Germany Hong Kong Credit Cards Market Volume (Billion) Forecast, by Application 2020 & 2033
- Table 49: France Hong Kong Credit Cards Market Revenue (Million) Forecast, by Application 2020 & 2033
- Table 50: France Hong Kong Credit Cards Market Volume (Billion) Forecast, by Application 2020 & 2033
- Table 51: Italy Hong Kong Credit Cards Market Revenue (Million) Forecast, by Application 2020 & 2033
- Table 52: Italy Hong Kong Credit Cards Market Volume (Billion) Forecast, by Application 2020 & 2033
- Table 53: Spain Hong Kong Credit Cards Market Revenue (Million) Forecast, by Application 2020 & 2033
- Table 54: Spain Hong Kong Credit Cards Market Volume (Billion) Forecast, by Application 2020 & 2033
- Table 55: Russia Hong Kong Credit Cards Market Revenue (Million) Forecast, by Application 2020 & 2033
- Table 56: Russia Hong Kong Credit Cards Market Volume (Billion) Forecast, by Application 2020 & 2033
- Table 57: Benelux Hong Kong Credit Cards Market Revenue (Million) Forecast, by Application 2020 & 2033
- Table 58: Benelux Hong Kong Credit Cards Market Volume (Billion) Forecast, by Application 2020 & 2033
- Table 59: Nordics Hong Kong Credit Cards Market Revenue (Million) Forecast, by Application 2020 & 2033
- Table 60: Nordics Hong Kong Credit Cards Market Volume (Billion) Forecast, by Application 2020 & 2033
- Table 61: Rest of Europe Hong Kong Credit Cards Market Revenue (Million) Forecast, by Application 2020 & 2033
- Table 62: Rest of Europe Hong Kong Credit Cards Market Volume (Billion) Forecast, by Application 2020 & 2033
- Table 63: Global Hong Kong Credit Cards Market Revenue Million Forecast, by Card Type 2020 & 2033
- Table 64: Global Hong Kong Credit Cards Market Volume Billion Forecast, by Card Type 2020 & 2033
- Table 65: Global Hong Kong Credit Cards Market Revenue Million Forecast, by Application 2020 & 2033
- Table 66: Global Hong Kong Credit Cards Market Volume Billion Forecast, by Application 2020 & 2033
- Table 67: Global Hong Kong Credit Cards Market Revenue Million Forecast, by Provider 2020 & 2033
- Table 68: Global Hong Kong Credit Cards Market Volume Billion Forecast, by Provider 2020 & 2033
- Table 69: Global Hong Kong Credit Cards Market Revenue Million Forecast, by Country 2020 & 2033
- Table 70: Global Hong Kong Credit Cards Market Volume Billion Forecast, by Country 2020 & 2033
- Table 71: Turkey Hong Kong Credit Cards Market Revenue (Million) Forecast, by Application 2020 & 2033
- Table 72: Turkey Hong Kong Credit Cards Market Volume (Billion) Forecast, by Application 2020 & 2033
- Table 73: Israel Hong Kong Credit Cards Market Revenue (Million) Forecast, by Application 2020 & 2033
- Table 74: Israel Hong Kong Credit Cards Market Volume (Billion) Forecast, by Application 2020 & 2033
- Table 75: GCC Hong Kong Credit Cards Market Revenue (Million) Forecast, by Application 2020 & 2033
- Table 76: GCC Hong Kong Credit Cards Market Volume (Billion) Forecast, by Application 2020 & 2033
- Table 77: North Africa Hong Kong Credit Cards Market Revenue (Million) Forecast, by Application 2020 & 2033
- Table 78: North Africa Hong Kong Credit Cards Market Volume (Billion) Forecast, by Application 2020 & 2033
- Table 79: South Africa Hong Kong Credit Cards Market Revenue (Million) Forecast, by Application 2020 & 2033
- Table 80: South Africa Hong Kong Credit Cards Market Volume (Billion) Forecast, by Application 2020 & 2033
- Table 81: Rest of Middle East & Africa Hong Kong Credit Cards Market Revenue (Million) Forecast, by Application 2020 & 2033
- Table 82: Rest of Middle East & Africa Hong Kong Credit Cards Market Volume (Billion) Forecast, by Application 2020 & 2033
- Table 83: Global Hong Kong Credit Cards Market Revenue Million Forecast, by Card Type 2020 & 2033
- Table 84: Global Hong Kong Credit Cards Market Volume Billion Forecast, by Card Type 2020 & 2033
- Table 85: Global Hong Kong Credit Cards Market Revenue Million Forecast, by Application 2020 & 2033
- Table 86: Global Hong Kong Credit Cards Market Volume Billion Forecast, by Application 2020 & 2033
- Table 87: Global Hong Kong Credit Cards Market Revenue Million Forecast, by Provider 2020 & 2033
- Table 88: Global Hong Kong Credit Cards Market Volume Billion Forecast, by Provider 2020 & 2033
- Table 89: Global Hong Kong Credit Cards Market Revenue Million Forecast, by Country 2020 & 2033
- Table 90: Global Hong Kong Credit Cards Market Volume Billion Forecast, by Country 2020 & 2033
- Table 91: China Hong Kong Credit Cards Market Revenue (Million) Forecast, by Application 2020 & 2033
- Table 92: China Hong Kong Credit Cards Market Volume (Billion) Forecast, by Application 2020 & 2033
- Table 93: India Hong Kong Credit Cards Market Revenue (Million) Forecast, by Application 2020 & 2033
- Table 94: India Hong Kong Credit Cards Market Volume (Billion) Forecast, by Application 2020 & 2033
- Table 95: Japan Hong Kong Credit Cards Market Revenue (Million) Forecast, by Application 2020 & 2033
- Table 96: Japan Hong Kong Credit Cards Market Volume (Billion) Forecast, by Application 2020 & 2033
- Table 97: South Korea Hong Kong Credit Cards Market Revenue (Million) Forecast, by Application 2020 & 2033
- Table 98: South Korea Hong Kong Credit Cards Market Volume (Billion) Forecast, by Application 2020 & 2033
- Table 99: ASEAN Hong Kong Credit Cards Market Revenue (Million) Forecast, by Application 2020 & 2033
- Table 100: ASEAN Hong Kong Credit Cards Market Volume (Billion) Forecast, by Application 2020 & 2033
- Table 101: Oceania Hong Kong Credit Cards Market Revenue (Million) Forecast, by Application 2020 & 2033
- Table 102: Oceania Hong Kong Credit Cards Market Volume (Billion) Forecast, by Application 2020 & 2033
- Table 103: Rest of Asia Pacific Hong Kong Credit Cards Market Revenue (Million) Forecast, by Application 2020 & 2033
- Table 104: Rest of Asia Pacific Hong Kong Credit Cards Market Volume (Billion) Forecast, by Application 2020 & 2033
Frequently Asked Questions
1. What is the projected Compound Annual Growth Rate (CAGR) of the Hong Kong Credit Cards Market?
The projected CAGR is approximately 8.68%.
2. Which companies are prominent players in the Hong Kong Credit Cards Market?
Key companies in the market include HSBC, Bank of China, Standard Chartered Bank, Citibank, Hang Seng Bank, DBS Bank, American Express, Fubon Bank, Aeon Credit Card Services, Chong Hing Bank Limited**List Not Exhaustive.
3. What are the main segments of the Hong Kong Credit Cards Market?
The market segments include Card Type, Application, Provider.
4. Can you provide details about the market size?
The market size is estimated to be USD 113.41 Million as of 2022.
5. What are some drivers contributing to market growth?
Usage of Credit Card Give the Bonus and Reward Points.
6. What are the notable trends driving market growth?
Increasing Number of Credit Card Transaction in Hong Kong.
7. Are there any restraints impacting market growth?
Usage of Credit Card Give the Bonus and Reward Points.
8. Can you provide examples of recent developments in the market?
April 2023: Hang Seng Bank delivered an innovative green receivables financing solution for its long-term customer, Leo Paper Group, with export credit insurance provided by Hong Kong Export Credit Insurance Corporation that supports greater supply chain sustainability.
9. What pricing options are available for accessing the report?
Pricing options include single-user, multi-user, and enterprise licenses priced at USD 3800, USD 4500, and USD 5800 respectively.
10. Is the market size provided in terms of value or volume?
The market size is provided in terms of value, measured in Million and volume, measured in Billion.
11. Are there any specific market keywords associated with the report?
Yes, the market keyword associated with the report is "Hong Kong Credit Cards Market," which aids in identifying and referencing the specific market segment covered.
12. How do I determine which pricing option suits my needs best?
The pricing options vary based on user requirements and access needs. Individual users may opt for single-user licenses, while businesses requiring broader access may choose multi-user or enterprise licenses for cost-effective access to the report.
13. Are there any additional resources or data provided in the Hong Kong Credit Cards Market report?
While the report offers comprehensive insights, it's advisable to review the specific contents or supplementary materials provided to ascertain if additional resources or data are available.
14. How can I stay updated on further developments or reports in the Hong Kong Credit Cards Market?
To stay informed about further developments, trends, and reports in the Hong Kong Credit Cards Market, consider subscribing to industry newsletters, following relevant companies and organizations, or regularly checking reputable industry news sources and publications.
Methodology
Step 1 - Identification of Relevant Samples Size from Population Database


Step 2 - Approaches for Defining Global Market Size (Value, Volume* & Price*)

Note*: In applicable scenarios
Step 3 - Data Sources
Primary Research
- Web Analytics
- Survey Reports
- Research Institute
- Latest Research Reports
- Opinion Leaders
Secondary Research
- Annual Reports
- White Paper
- Latest Press Release
- Industry Association
- Paid Database
- Investor Presentations

Step 4 - Data Triangulation
Involves using different sources of information in order to increase the validity of a study
These sources are likely to be stakeholders in a program - participants, other researchers, program staff, other community members, and so on.
Then we put all data in single framework & apply various statistical tools to find out the dynamic on the market.
During the analysis stage, feedback from the stakeholder groups would be compared to determine areas of agreement as well as areas of divergence