

Key Insights
The Middle East & Africa (MEA) Buy Now, Pay Later (BNPL) market is poised for substantial expansion, propelled by increasing smartphone adoption, burgeoning e-commerce, and a young, digitally connected demographic seeking flexible payment solutions. The MEA BNPL market was valued at 44858.18 million in the base year 2025 and is projected to grow at a Compound Annual Growth Rate (CAGR) of 20.7%. This upward trajectory is driven by the proliferation of online shopping, a growing middle class with enhanced purchasing power, and the less developed traditional credit infrastructure in many regional economies. Furthermore, financial inclusion efforts are broadening access to BNPL services. Leading providers such as Payflex, Tamara, Spotii, and Tabby are actively innovating and forming strategic alliances to capture market share.
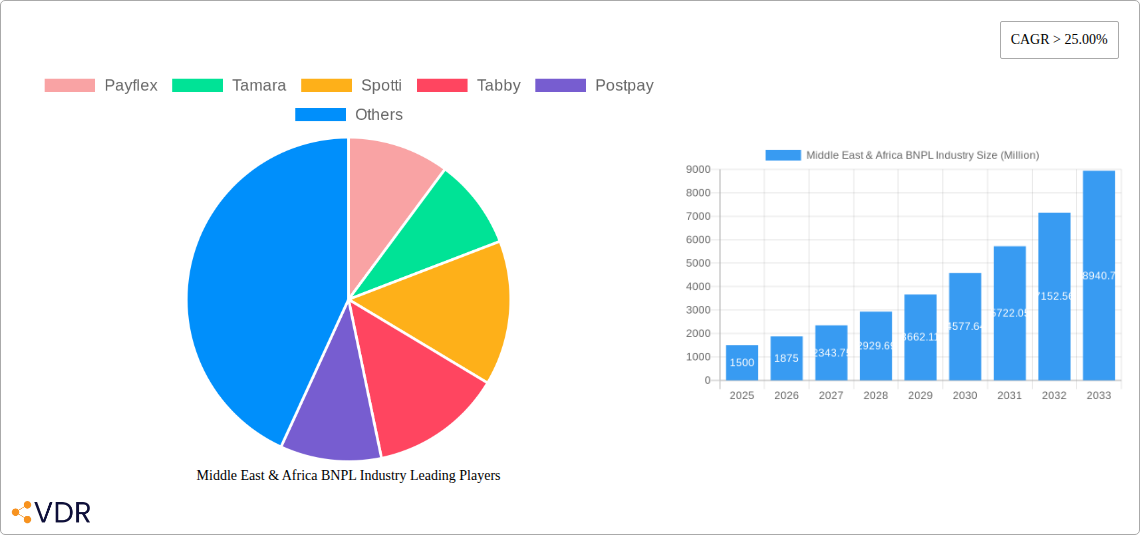
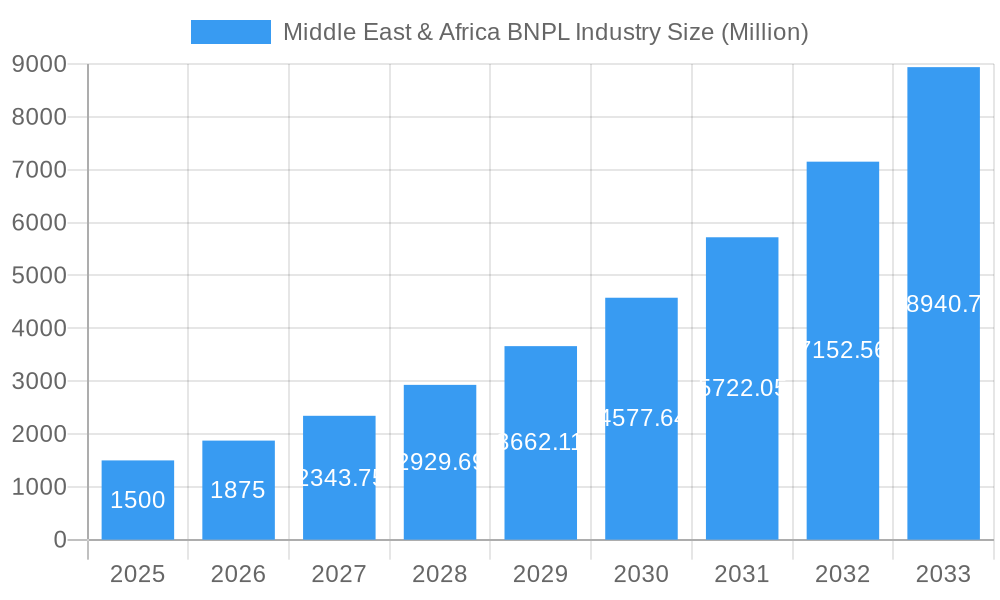
Middle East & Africa BNPL Industry Market Size (In Billion)
Continued market growth is anticipated as digital payment adoption rises across retail, travel, and healthcare sectors, with e-commerce platform expansion serving as a primary driver. Intensifying competition is expected to foster product innovation and superior customer experiences. The market may also experience consolidation. Mitigating risks through responsible lending and consumer education will be crucial for the sustainable long-term success of the MEA BNPL industry.
Middle East & Africa BNPL Industry Company Market Share
Middle East & Africa BNPL Industry: Market Report 2019-2033
This comprehensive report provides an in-depth analysis of the burgeoning Buy Now, Pay Later (BNPL) industry in the Middle East and Africa, offering invaluable insights for investors, industry professionals, and strategists. Covering the period 2019-2033, with a focus on 2025, this report unveils the market dynamics, growth trends, key players, and future opportunities shaping this rapidly evolving landscape. The report segments the market by country, region, and product offering, providing granular analysis to inform strategic decision-making. The total market value is projected to reach xx Million by 2033.
Middle East & Africa BNPL Industry Market Dynamics & Structure
This section analyzes the competitive landscape, technological advancements, regulatory environment, and market trends within the Middle East and Africa BNPL industry. The market is characterized by a relatively high degree of fragmentation, with numerous players vying for market share. However, consolidation is expected as larger players acquire smaller firms. Technological innovation, particularly in areas such as AI-powered risk assessment and seamless integration with e-commerce platforms, is a key driver of growth. Regulatory frameworks vary across different countries, creating both opportunities and challenges. The increasing adoption of smartphones and internet penetration fuels BNPL's expansion across the region.
- Market Concentration: Moderately fragmented, with a trend towards consolidation. The top 5 players hold approximately xx% of the market share (2025 estimate).
- Technological Innovation: AI-powered risk assessment, improved fraud detection, and seamless integration with online retailers are driving factors.
- Regulatory Framework: Varies significantly across countries, posing both challenges and opportunities for expansion.
- Competitive Substitutes: Traditional credit cards and personal loans remain key competitors.
- End-User Demographics: Primarily young, tech-savvy consumers with a preference for digital financial services.
- M&A Trends: A notable increase in merger and acquisition activity is anticipated over the forecast period, with an estimated xx deals completed in 2024.
Middle East & Africa BNPL Industry Growth Trends & Insights
The Middle East and Africa BNPL market is experiencing exponential growth, driven by increasing smartphone penetration, rising e-commerce adoption, and a young, digitally native population. The market size has grown from xx Million in 2019 to an estimated xx Million in 2025, exhibiting a Compound Annual Growth Rate (CAGR) of xx% during the historical period (2019-2024). This strong growth trajectory is projected to continue, with the market expected to reach xx Million by 2033, fueled by factors such as increasing financial inclusion and the expansion of e-commerce into underserved areas. Consumer behavior is shifting towards cashless transactions, further contributing to the BNPL market's expansion. Technological disruptions, such as the introduction of embedded finance solutions and open banking, are also creating new avenues for growth. Market penetration is projected to reach xx% by 2033.
Dominant Regions, Countries, or Segments in Middle East & Africa BNPL Industry
The UAE, Kenya, and Nigeria are currently leading the Middle East and Africa BNPL market, driven by robust e-commerce growth and favorable regulatory environments. The UAE benefits from a mature fintech ecosystem and high consumer spending. Kenya's thriving mobile money ecosystem provides a strong foundation for BNPL adoption. Nigeria's large and young population presents immense potential for growth. Within the segments, the focus is on e-commerce and retail, with opportunities emerging in travel, entertainment and healthcare.
- Key Drivers:
- UAE: Mature fintech ecosystem, high consumer spending, and supportive regulations.
- Kenya: High mobile penetration and a strong mobile money infrastructure (M-Pesa).
- Nigeria: Large and young population, significant growth in e-commerce.
- Dominance Factors: Strong e-commerce infrastructure, high smartphone penetration, and favorable government policies. Market share data for 2025 (estimated): UAE – xx%, Kenya – xx%, Nigeria – xx%.
Middle East & Africa BNPL Industry Product Landscape
The BNPL product landscape is characterized by a diverse range of offerings, including installment plans, point-of-sale financing, and embedded finance solutions. Key features include flexible repayment options, user-friendly mobile apps, and robust fraud prevention mechanisms. Competition is fierce, with providers differentiating themselves through unique value propositions such as loyalty programs, personalized offers, and integrations with popular e-commerce platforms. The industry is witnessing rapid innovation with the introduction of AI-powered credit scoring and personalized repayment plans.
Key Drivers, Barriers & Challenges in Middle East & Africa BNPL Industry
Key Drivers:
- Rising Smartphone and internet penetration: facilitating wider access to digital financial services.
- Growth of E-commerce: providing a platform for BNPL integration.
- Increasing Financial Inclusion: extending credit access to underserved populations.
- Government initiatives: promoting digital finance and fintech innovation.
Key Challenges and Restraints:
- Regulatory uncertainty: varying regulations across different countries.
- Risk of defaults and fraud: impacting profitability and lender confidence.
- Competition from traditional financial institutions: offering similar products.
- Data privacy and security concerns: requiring robust security measures. Estimated loss from fraud in 2024: xx Million.
Emerging Opportunities in Middle East & Africa BNPL Industry
- Expansion into underserved markets: reaching rural areas and low-income populations.
- Development of innovative product offerings: catering to specific consumer segments (e.g., micro-loans).
- Strategic partnerships: collaborations with telecom operators and retailers to expand reach.
- Leveraging data analytics: for personalized offers and improved risk management.
Growth Accelerators in the Middle East & Africa BNPL Industry
Technological advancements, strategic partnerships, and market expansion into underserved areas will be key drivers of long-term growth. The adoption of AI and machine learning for improved risk assessment and fraud detection will be crucial. Partnerships with established financial institutions can enhance trust and access to capital. Expanding into new markets and introducing tailored products will also fuel growth.
Key Players Shaping the Middle East & Africa BNPL Industry Market
- Payflex
- Tamara
- Spotti
- Tabby
- Postpay
- Shahry
- Lipa Later
- Sympl
- Chari
- ThankUCash
- List Not Exhaustive
Notable Milestones in Middle East & Africa BNPL Industry Sector
- January 2022: Lipa Later secures USD 12 million in pre-series A funding to expand across Africa.
- February 2022: Postpay secures debt financing from Commercial Bank of Dubai to expand its product portfolio.
In-Depth Middle East & Africa BNPL Industry Market Outlook
The Middle East and Africa BNPL market holds immense potential for continued growth, driven by technological innovation, expanding e-commerce adoption, and increasing financial inclusion. Strategic partnerships, targeted marketing campaigns, and a focus on regulatory compliance will be crucial for players seeking to capitalize on this opportunity. The long-term outlook remains positive, with significant growth expected over the next decade.
Middle East & Africa BNPL Industry Segmentation
-
1. Channel
- 1.1. Online
- 1.2. POS
-
2. Enterprises Size
- 2.1. Large Enterprises
- 2.2. Small & Medium Enterprises
-
3. End User
- 3.1. Consumer Electronics
- 3.2. Fashion & Garments
- 3.3. Healthcare
- 3.4. Leisure & Entertainment
- 3.5. Retail
- 3.6. Others
Middle East & Africa BNPL Industry Segmentation By Geography
-
1. Middle East
- 1.1. Saudi Arabia
- 1.2. United Arab Emirates
- 1.3. Israel
- 1.4. Qatar
- 1.5. Kuwait
- 1.6. Oman
- 1.7. Bahrain
- 1.8. Jordan
- 1.9. Lebanon
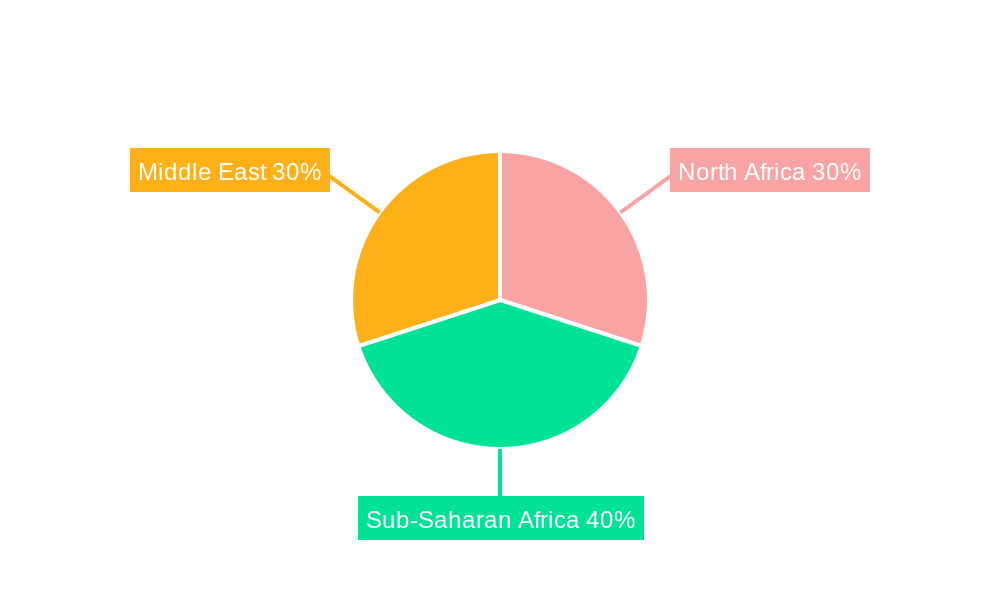
Middle East & Africa BNPL Industry Regional Market Share
Geographic Coverage of Middle East & Africa BNPL Industry
Middle East & Africa BNPL Industry REPORT HIGHLIGHTS
| Aspects | Details |
|---|---|
| Study Period | 2020-2034 |
| Base Year | 2025 |
| Estimated Year | 2026 |
| Forecast Period | 2026-2034 |
| Historical Period | 2020-2025 |
| Growth Rate | CAGR of 20.7% from 2020-2034 |
| Segmentation |
|
Table of Contents
- 1. Introduction
- 1.1. Research Scope
- 1.2. Market Segmentation
- 1.3. Research Objective
- 1.4. Definitions and Assumptions
- 2. Executive Summary
- 2.1. Market Snapshot
- 3. Market Dynamics
- 3.1. Market Drivers
- 3.2. Market Restrains
- 3.3. Market Trends
- 3.4. Market Opportunities
- 4. Market Factor Analysis
- 4.1. Porters Five Forces
- 4.1.1. Bargaining Power of Suppliers
- 4.1.2. Bargaining Power of Buyers
- 4.1.3. Threat of New Entrants
- 4.1.4. Threat of Substitutes
- 4.1.5. Competitive Rivalry
- 4.2. PESTEL analysis
- 4.3. BCG Analysis
- 4.3.1. Stars (High Growth, High Market Share)
- 4.3.2. Cash Cows (Low Growth, High Market Share)
- 4.3.3. Question Mark (High Growth, Low Market Share)
- 4.3.4. Dogs (Low Growth, Low Market Share)
- 4.4. Ansoff Matrix Analysis
- 4.5. Supply Chain Analysis
- 4.6. Regulatory Landscape
- 4.7. Current Market Potential and Opportunity Assessment (TAM–SAM–SOM Framework)
- 4.8. VDR Analyst Note
- 4.1. Porters Five Forces
- 5. Market Analysis, Insights and Forecast 2021-2033
- 5.1. Market Analysis, Insights and Forecast - by Channel
- 5.1.1. Online
- 5.1.2. POS
- 5.2. Market Analysis, Insights and Forecast - by Enterprises Size
- 5.2.1. Large Enterprises
- 5.2.2. Small & Medium Enterprises
- 5.3. Market Analysis, Insights and Forecast - by End User
- 5.3.1. Consumer Electronics
- 5.3.2. Fashion & Garments
- 5.3.3. Healthcare
- 5.3.4. Leisure & Entertainment
- 5.3.5. Retail
- 5.3.6. Others
- 5.4. Market Analysis, Insights and Forecast - by Region
- 5.4.1. Middle East
- 5.1. Market Analysis, Insights and Forecast - by Channel
- 6. Middle East & Africa BNPL Industry Analysis, Insights and Forecast, 2021-2033
- 6.1. Market Analysis, Insights and Forecast - by Channel
- 6.1.1. Online
- 6.1.2. POS
- 6.2. Market Analysis, Insights and Forecast - by Enterprises Size
- 6.2.1. Large Enterprises
- 6.2.2. Small & Medium Enterprises
- 6.3. Market Analysis, Insights and Forecast - by End User
- 6.3.1. Consumer Electronics
- 6.3.2. Fashion & Garments
- 6.3.3. Healthcare
- 6.3.4. Leisure & Entertainment
- 6.3.5. Retail
- 6.3.6. Others
- 6.1. Market Analysis, Insights and Forecast - by Channel
- 7. Competitive Analysis
- 7.1. Company Profiles
- 7.1.1 Payflex
- 7.1.1.1. Company Overview
- 7.1.1.2. Products
- 7.1.1.3. Company Financials
- 7.1.1.4. SWOT Analysis
- 7.1.2 Tamara
- 7.1.2.1. Company Overview
- 7.1.2.2. Products
- 7.1.2.3. Company Financials
- 7.1.2.4. SWOT Analysis
- 7.1.3 Spotti
- 7.1.3.1. Company Overview
- 7.1.3.2. Products
- 7.1.3.3. Company Financials
- 7.1.3.4. SWOT Analysis
- 7.1.4 Tabby
- 7.1.4.1. Company Overview
- 7.1.4.2. Products
- 7.1.4.3. Company Financials
- 7.1.4.4. SWOT Analysis
- 7.1.5 Postpay
- 7.1.5.1. Company Overview
- 7.1.5.2. Products
- 7.1.5.3. Company Financials
- 7.1.5.4. SWOT Analysis
- 7.1.6 Shahry
- 7.1.6.1. Company Overview
- 7.1.6.2. Products
- 7.1.6.3. Company Financials
- 7.1.6.4. SWOT Analysis
- 7.1.7 Lipa Later
- 7.1.7.1. Company Overview
- 7.1.7.2. Products
- 7.1.7.3. Company Financials
- 7.1.7.4. SWOT Analysis
- 7.1.8 Sympl
- 7.1.8.1. Company Overview
- 7.1.8.2. Products
- 7.1.8.3. Company Financials
- 7.1.8.4. SWOT Analysis
- 7.1.9 Chari
- 7.1.9.1. Company Overview
- 7.1.9.2. Products
- 7.1.9.3. Company Financials
- 7.1.9.4. SWOT Analysis
- 7.1.10 ThankUCash*List Not Exhaustive
- 7.1.10.1. Company Overview
- 7.1.10.2. Products
- 7.1.10.3. Company Financials
- 7.1.10.4. SWOT Analysis
- 7.1.1 Payflex
- 7.2. Market Entropy
- 7.2.1 Company's Key Areas Served
- 7.2.2 Recent Developments
- 7.3. Company Market Share Analysis 2025
- 7.3.1 Top 5 Companies Market Share Analysis
- 7.3.2 Top 3 Companies Market Share Analysis
- 7.4. List of Potential Customers
- 8. Research Methodology
List of Figures
- Figure 1: Middle East & Africa BNPL Industry Revenue Breakdown (million, %) by Product 2025 & 2033
- Figure 2: Middle East & Africa BNPL Industry Share (%) by Company 2025
List of Tables
- Table 1: Middle East & Africa BNPL Industry Revenue million Forecast, by Channel 2020 & 2033
- Table 2: Middle East & Africa BNPL Industry Revenue million Forecast, by Enterprises Size 2020 & 2033
- Table 3: Middle East & Africa BNPL Industry Revenue million Forecast, by End User 2020 & 2033
- Table 4: Middle East & Africa BNPL Industry Revenue million Forecast, by Region 2020 & 2033
- Table 5: Middle East & Africa BNPL Industry Revenue million Forecast, by Channel 2020 & 2033
- Table 6: Middle East & Africa BNPL Industry Revenue million Forecast, by Enterprises Size 2020 & 2033
- Table 7: Middle East & Africa BNPL Industry Revenue million Forecast, by End User 2020 & 2033
- Table 8: Middle East & Africa BNPL Industry Revenue million Forecast, by Country 2020 & 2033
- Table 9: Saudi Arabia Middle East & Africa BNPL Industry Revenue (million) Forecast, by Application 2020 & 2033
- Table 10: United Arab Emirates Middle East & Africa BNPL Industry Revenue (million) Forecast, by Application 2020 & 2033
- Table 11: Israel Middle East & Africa BNPL Industry Revenue (million) Forecast, by Application 2020 & 2033
- Table 12: Qatar Middle East & Africa BNPL Industry Revenue (million) Forecast, by Application 2020 & 2033
- Table 13: Kuwait Middle East & Africa BNPL Industry Revenue (million) Forecast, by Application 2020 & 2033
- Table 14: Oman Middle East & Africa BNPL Industry Revenue (million) Forecast, by Application 2020 & 2033
- Table 15: Bahrain Middle East & Africa BNPL Industry Revenue (million) Forecast, by Application 2020 & 2033
- Table 16: Jordan Middle East & Africa BNPL Industry Revenue (million) Forecast, by Application 2020 & 2033
- Table 17: Lebanon Middle East & Africa BNPL Industry Revenue (million) Forecast, by Application 2020 & 2033
Frequently Asked Questions
1. What is the projected Compound Annual Growth Rate (CAGR) of the Middle East & Africa BNPL Industry?
The projected CAGR is approximately 20.7%.
2. Which companies are prominent players in the Middle East & Africa BNPL Industry?
Key companies in the market include Payflex, Tamara, Spotti, Tabby, Postpay, Shahry, Lipa Later, Sympl, Chari, ThankUCash*List Not Exhaustive.
3. What are the main segments of the Middle East & Africa BNPL Industry?
The market segments include Channel, Enterprises Size, End User.
4. Can you provide details about the market size?
The market size is estimated to be USD 44858.18 million as of 2022.
5. What are some drivers contributing to market growth?
N/A
6. What are the notable trends driving market growth?
Growth in E-commerce in Middle East and Africa is increasing.
7. Are there any restraints impacting market growth?
N/A
8. Can you provide examples of recent developments in the market?
January 2022 - Lipa Later, a Kenyan BNPL startup, has secured USD 12 million in pre-series A funding to grow across Africa. This new capital, according to the firm, would allow them to supply their buy-now-pay-later services to their current pipeline of users, strengthen their presence in current markets (Kenya, Uganda, and Rwanda), and expand into new markets such as Nigeria, South Africa, Ghana, and Tanzania.
9. What pricing options are available for accessing the report?
Pricing options include single-user, multi-user, and enterprise licenses priced at USD 3800, USD 4500, and USD 5800 respectively.
10. Is the market size provided in terms of value or volume?
The market size is provided in terms of value, measured in million.
11. Are there any specific market keywords associated with the report?
Yes, the market keyword associated with the report is "Middle East & Africa BNPL Industry," which aids in identifying and referencing the specific market segment covered.
12. How do I determine which pricing option suits my needs best?
The pricing options vary based on user requirements and access needs. Individual users may opt for single-user licenses, while businesses requiring broader access may choose multi-user or enterprise licenses for cost-effective access to the report.
13. Are there any additional resources or data provided in the Middle East & Africa BNPL Industry report?
While the report offers comprehensive insights, it's advisable to review the specific contents or supplementary materials provided to ascertain if additional resources or data are available.
14. How can I stay updated on further developments or reports in the Middle East & Africa BNPL Industry?
To stay informed about further developments, trends, and reports in the Middle East & Africa BNPL Industry, consider subscribing to industry newsletters, following relevant companies and organizations, or regularly checking reputable industry news sources and publications.
Methodology
Step 1 - Identification of Relevant Samples Size from Population Database


Step 2 - Approaches for Defining Global Market Size (Value, Volume* & Price*)

Note*: In applicable scenarios
Step 3 - Data Sources
Primary Research
- Web Analytics
- Survey Reports
- Research Institute
- Latest Research Reports
- Opinion Leaders
Secondary Research
- Annual Reports
- White Paper
- Latest Press Release
- Industry Association
- Paid Database
- Investor Presentations

Step 4 - Data Triangulation
Involves using different sources of information in order to increase the validity of a study
These sources are likely to be stakeholders in a program - participants, other researchers, program staff, other community members, and so on.
Then we put all data in single framework & apply various statistical tools to find out the dynamic on the market.
During the analysis stage, feedback from the stakeholder groups would be compared to determine areas of agreement as well as areas of divergence