

Key Insights
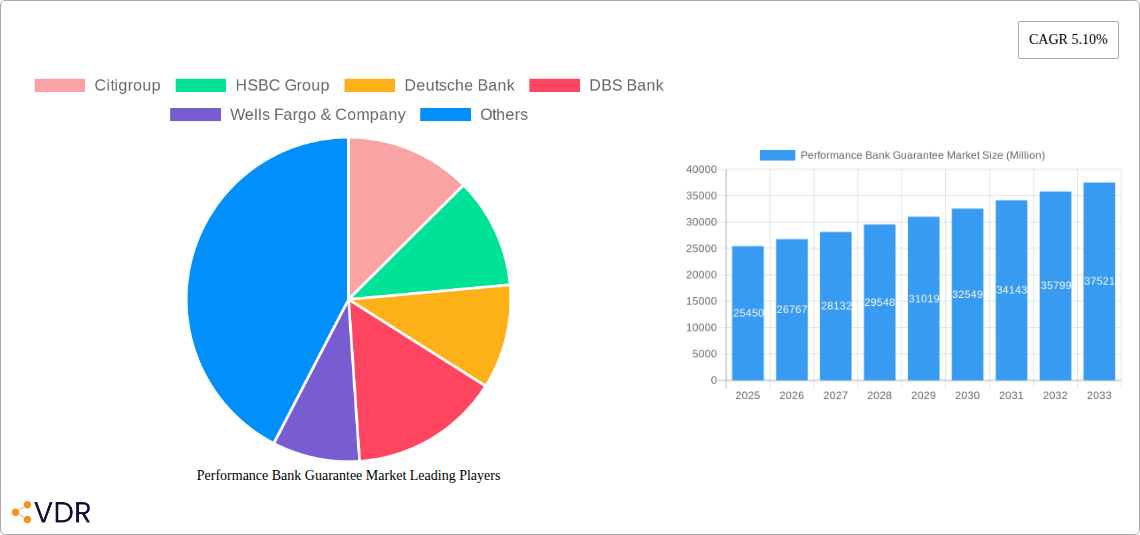
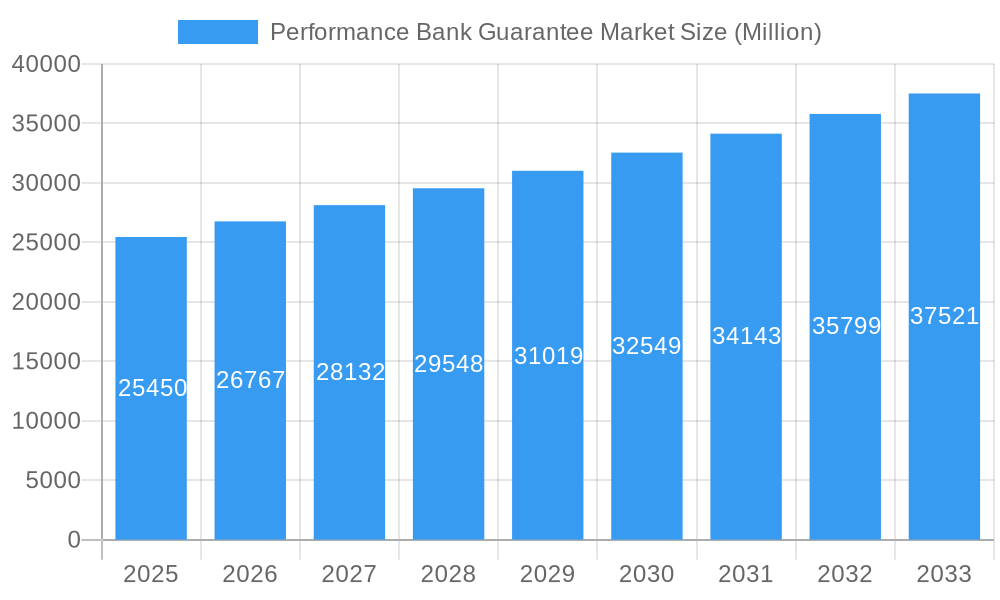
The Performance Bank Guarantee market, valued at $25.45 billion in 2025, is projected to experience robust growth, exhibiting a Compound Annual Growth Rate (CAGR) of 5.10% from 2025 to 2033. This expansion is driven by several key factors. Increased infrastructure projects globally necessitate reliable financial instruments like performance bank guarantees, ensuring project completion and mitigating risk for both contractors and clients. Furthermore, the growing complexity of international trade and the rise of stringent regulatory frameworks are bolstering demand for these guarantees, providing assurance to stakeholders. The trend towards outsourcing and the increasing adoption of project finance models are also contributing to market growth. However, economic downturns and fluctuating interest rates pose challenges, potentially impacting the willingness of banks to issue guarantees. Competition among major players like Citigroup, HSBC, Deutsche Bank, and others is intense, driving innovation and pricing strategies. The market is segmented by guarantee type (e.g., bid bonds, performance bonds, advance payment bonds), industry (construction, energy, etc.), and geography. The regional distribution is likely to be influenced by economic activity and infrastructure development in each region. North America and Europe are anticipated to hold significant market share, but emerging economies in Asia and the Middle East are expected to witness substantial growth driven by infrastructure investments.
Performance Bank Guarantee Market Market Size (In Billion)
The forecast period of 2025-2033 indicates sustained growth, with the market size expected to surpass $35 billion by 2033. This prediction is based on the continued expansion of global infrastructure development and the sustained demand for risk mitigation tools in various sectors. While economic uncertainty presents a potential headwind, the long-term outlook for the Performance Bank Guarantee market remains positive, fueled by ongoing globalization and the need for financial security in large-scale projects. The competitive landscape will continue to evolve, with established banks striving to maintain market leadership and new entrants exploring opportunities within this specialized financial segment. Effective risk management strategies and regulatory compliance will be critical for success in this dynamic market.
Performance Bank Guarantee Market Company Market Share
Performance Bank Guarantee Market: A Comprehensive Report (2019-2033)
This comprehensive report provides an in-depth analysis of the Performance Bank Guarantee market, encompassing market dynamics, growth trends, regional dominance, product landscape, key players, and future outlook. The report covers the period from 2019 to 2033, with 2025 as the base year and estimated year. The market is segmented by various factors, providing a granular view of this crucial financial instrument. The parent market is the broader Financial Guarantee Market, while the child market is specifically Performance Bank Guarantees. The projected market size in 2025 is estimated at xx Million.
Performance Bank Guarantee Market Dynamics & Structure
This section analyzes the competitive landscape, technological advancements, regulatory influences, and market trends within the Performance Bank Guarantee market. The market is moderately concentrated, with key players holding significant market share but also allowing for the participation of smaller regional players. Technological innovation, particularly in the realm of electronic bank guarantees (e-BG), is a primary driver of growth. Regulatory frameworks, varying across jurisdictions, influence adoption rates and transaction volumes. Substitutes, such as letters of credit, exist but often lack the same flexibility and cost-effectiveness of performance bank guarantees. The end-user demographics are diverse, encompassing businesses of all sizes across various sectors. M&A activity within the banking sector indirectly influences the Performance Bank Guarantee market, impacting market consolidation and competitive dynamics.
- Market Concentration: Moderately concentrated, with top 10 players holding approximately 60% market share in 2024.
- Technological Innovation: E-BG adoption is accelerating, driven by efficiency gains and reduced paperwork.
- Regulatory Frameworks: Varying regulations across regions impact market penetration and growth.
- Competitive Substitutes: Letters of credit are a primary substitute, but often less flexible.
- End-User Demographics: Diverse, spanning various industries and business sizes.
- M&A Trends: Consolidation in the banking sector influences market dynamics indirectly. xx M&A deals in the banking sector were recorded in 2024.
Performance Bank Guarantee Market Growth Trends & Insights
The Performance Bank Guarantee market has witnessed substantial growth over the historical period (2019-2024), driven by increasing infrastructure projects, global trade expansion, and the growing preference for secure payment mechanisms. The market size experienced a CAGR of xx% from 2019 to 2024, reaching xx Million in 2024. Technological disruptions, particularly the implementation of e-BG systems, have accelerated adoption rates. The shift towards digitalization within the financial sector continues to propel market growth. Changing consumer behavior, including a preference for streamlined and efficient transactions, further contributes to this expansion. The market is expected to maintain a healthy growth trajectory during the forecast period (2025-2033), with a projected CAGR of xx%. Market penetration is expected to reach xx% by 2033.
Dominant Regions, Countries, or Segments in Performance Bank Guarantee Market
North America currently dominates the Performance Bank Guarantee market, driven by robust infrastructure development and a well-established financial sector. However, Asia-Pacific is projected to experience significant growth due to rapid economic expansion and infrastructure investments across various countries such as India and China. Europe also holds a substantial market share. Key drivers for regional dominance include:
- North America: Strong financial infrastructure and robust regulatory environment.
- Asia-Pacific: Rapid economic growth, substantial infrastructure projects, and increasing adoption of e-BG systems.
- Europe: Stable economic conditions and a large base of businesses utilizing performance bank guarantees.
Country-Specific Analysis: The United States holds the largest market share in North America. India and China are leading the growth in Asia-Pacific. Germany and the UK are key markets in Europe.
Performance Bank Guarantee Market Product Landscape
The Performance Bank Guarantee market offers various products tailored to different needs and risk profiles. Innovations focus on digitalization, enhancing security, and streamlining processes. E-BGs, offering speed, efficiency, and transparency, are becoming increasingly popular. Performance metrics focus on transaction speed, cost-effectiveness, and security. Unique selling propositions emphasize risk mitigation and streamlined processes. Technological advancements involve blockchain integration for enhanced security and traceability.
Key Drivers, Barriers & Challenges in Performance Bank Guarantee Market
Key Drivers:
- Increased government spending on infrastructure projects.
- Rising global trade and cross-border transactions.
- Growing preference for secure payment methods.
- Technological advancements, such as e-BG systems.
Key Barriers & Challenges:
- Regulatory hurdles and complexities vary across regions.
- Potential for fraud and security breaches.
- High costs associated with issuing and managing bank guarantees, particularly for small businesses.
- Competition from alternative financing methods.
Emerging Opportunities in Performance Bank Guarantee Market
- Expanding into untapped markets in developing economies.
- Leveraging technological advancements, including AI and machine learning, to improve risk assessment and fraud detection.
- Developing tailored solutions for specific industries and sectors.
- Increased partnerships between banks and technology companies.
Growth Accelerators in the Performance Bank Guarantee Market Industry
Several factors will drive long-term market growth, including advancements in digital technologies that enhance efficiency and security. Strategic partnerships between financial institutions and technology providers will further accelerate market growth. Expanding into untapped markets and offering tailored solutions will also contribute to long-term expansion.
Key Players Shaping the Performance Bank Guarantee Market Market
Notable Milestones in Performance Bank Guarantee Market Sector
- January 2023: State Bank of India (SBI) launched the e-Bank Guarantee (e-BG) facility in association with National e-governance services ltd.
- February 2023: Public sector Indian Overseas Bank launched the e-BG scheme in association with National e-Governance Services Ltd. These initiatives significantly improved the efficiency and accessibility of bank guarantees in India.
In-Depth Performance Bank Guarantee Market Market Outlook
The future of the Performance Bank Guarantee market is promising, driven by ongoing digitalization, increasing demand for secure financial transactions, and expansion into new markets. Strategic partnerships and technological advancements will further propel market growth, creating opportunities for both established players and new entrants. The market is poised for significant expansion, with continued growth predicted throughout the forecast period.
Performance Bank Guarantee Market Segmentation
-
1. Type
- 1.1. Tender Guarantee
- 1.2. Financial guarantee
- 1.3. Advance payment guarantee
- 1.4. Foreign bank guarantee
- 1.5. Others
-
2. Application
- 2.1. Small and Medium Enterprise
- 2.2. Large Enterprise
- 2.3. Others
-
3. Bank
- 3.1. Government
- 3.2. Private Sector
-
4. Service Deployment
- 4.1. Online
- 4.2. Offline
Performance Bank Guarantee Market Segmentation By Geography
- 1. North America
- 2. Europe
- 3. Asia Pacific
- 4. Latin America
- 5. Middle East and Africa

Performance Bank Guarantee Market Regional Market Share
Geographic Coverage of Performance Bank Guarantee Market
Performance Bank Guarantee Market REPORT HIGHLIGHTS
| Aspects | Details |
|---|---|
| Study Period | 2020-2034 |
| Base Year | 2025 |
| Estimated Year | 2026 |
| Forecast Period | 2026-2034 |
| Historical Period | 2020-2025 |
| Growth Rate | CAGR of 5.10% from 2020-2034 |
| Segmentation |
|
Table of Contents
- 1. Introduction
- 1.1. Research Scope
- 1.2. Market Segmentation
- 1.3. Research Objective
- 1.4. Definitions and Assumptions
- 2. Executive Summary
- 2.1. Market Snapshot
- 3. Market Dynamics
- 3.1. Market Drivers
- 3.2. Market Restrains
- 3.3. Market Trends
- 3.4. Market Opportunities
- 4. Market Factor Analysis
- 4.1. Porters Five Forces
- 4.1.1. Bargaining Power of Suppliers
- 4.1.2. Bargaining Power of Buyers
- 4.1.3. Threat of New Entrants
- 4.1.4. Threat of Substitutes
- 4.1.5. Competitive Rivalry
- 4.2. PESTEL analysis
- 4.3. BCG Analysis
- 4.3.1. Stars (High Growth, High Market Share)
- 4.3.2. Cash Cows (Low Growth, High Market Share)
- 4.3.3. Question Mark (High Growth, Low Market Share)
- 4.3.4. Dogs (Low Growth, Low Market Share)
- 4.4. Ansoff Matrix Analysis
- 4.5. Supply Chain Analysis
- 4.6. Regulatory Landscape
- 4.7. Current Market Potential and Opportunity Assessment (TAM–SAM–SOM Framework)
- 4.8. VDR Analyst Note
- 4.1. Porters Five Forces
- 5. Market Analysis, Insights and Forecast 2021-2033
- 5.1. Market Analysis, Insights and Forecast - by Type
- 5.1.1. Tender Guarantee
- 5.1.2. Financial guarantee
- 5.1.3. Advance payment guarantee
- 5.1.4. Foreign bank guarantee
- 5.1.5. Others
- 5.2. Market Analysis, Insights and Forecast - by Application
- 5.2.1. Small and Medium Enterprise
- 5.2.2. Large Enterprise
- 5.2.3. Others
- 5.3. Market Analysis, Insights and Forecast - by Bank
- 5.3.1. Government
- 5.3.2. Private Sector
- 5.4. Market Analysis, Insights and Forecast - by Service Deployment
- 5.4.1. Online
- 5.4.2. Offline
- 5.5. Market Analysis, Insights and Forecast - by Region
- 5.5.1. North America
- 5.5.2. Europe
- 5.5.3. Asia Pacific
- 5.5.4. Latin America
- 5.5.5. Middle East and Africa
- 5.1. Market Analysis, Insights and Forecast - by Type
- 6. Global Performance Bank Guarantee Market Analysis, Insights and Forecast, 2021-2033
- 6.1. Market Analysis, Insights and Forecast - by Type
- 6.1.1. Tender Guarantee
- 6.1.2. Financial guarantee
- 6.1.3. Advance payment guarantee
- 6.1.4. Foreign bank guarantee
- 6.1.5. Others
- 6.2. Market Analysis, Insights and Forecast - by Application
- 6.2.1. Small and Medium Enterprise
- 6.2.2. Large Enterprise
- 6.2.3. Others
- 6.3. Market Analysis, Insights and Forecast - by Bank
- 6.3.1. Government
- 6.3.2. Private Sector
- 6.4. Market Analysis, Insights and Forecast - by Service Deployment
- 6.4.1. Online
- 6.4.2. Offline
- 6.1. Market Analysis, Insights and Forecast - by Type
- 7. North America Performance Bank Guarantee Market Analysis, Insights and Forecast, 2021-2033
- 7.1. Market Analysis, Insights and Forecast - by Type
- 7.1.1. Tender Guarantee
- 7.1.2. Financial guarantee
- 7.1.3. Advance payment guarantee
- 7.1.4. Foreign bank guarantee
- 7.1.5. Others
- 7.2. Market Analysis, Insights and Forecast - by Application
- 7.2.1. Small and Medium Enterprise
- 7.2.2. Large Enterprise
- 7.2.3. Others
- 7.3. Market Analysis, Insights and Forecast - by Bank
- 7.3.1. Government
- 7.3.2. Private Sector
- 7.4. Market Analysis, Insights and Forecast - by Service Deployment
- 7.4.1. Online
- 7.4.2. Offline
- 7.1. Market Analysis, Insights and Forecast - by Type
- 8. Europe Performance Bank Guarantee Market Analysis, Insights and Forecast, 2021-2033
- 8.1. Market Analysis, Insights and Forecast - by Type
- 8.1.1. Tender Guarantee
- 8.1.2. Financial guarantee
- 8.1.3. Advance payment guarantee
- 8.1.4. Foreign bank guarantee
- 8.1.5. Others
- 8.2. Market Analysis, Insights and Forecast - by Application
- 8.2.1. Small and Medium Enterprise
- 8.2.2. Large Enterprise
- 8.2.3. Others
- 8.3. Market Analysis, Insights and Forecast - by Bank
- 8.3.1. Government
- 8.3.2. Private Sector
- 8.4. Market Analysis, Insights and Forecast - by Service Deployment
- 8.4.1. Online
- 8.4.2. Offline
- 8.1. Market Analysis, Insights and Forecast - by Type
- 9. Asia Pacific Performance Bank Guarantee Market Analysis, Insights and Forecast, 2021-2033
- 9.1. Market Analysis, Insights and Forecast - by Type
- 9.1.1. Tender Guarantee
- 9.1.2. Financial guarantee
- 9.1.3. Advance payment guarantee
- 9.1.4. Foreign bank guarantee
- 9.1.5. Others
- 9.2. Market Analysis, Insights and Forecast - by Application
- 9.2.1. Small and Medium Enterprise
- 9.2.2. Large Enterprise
- 9.2.3. Others
- 9.3. Market Analysis, Insights and Forecast - by Bank
- 9.3.1. Government
- 9.3.2. Private Sector
- 9.4. Market Analysis, Insights and Forecast - by Service Deployment
- 9.4.1. Online
- 9.4.2. Offline
- 9.1. Market Analysis, Insights and Forecast - by Type
- 10. Latin America Performance Bank Guarantee Market Analysis, Insights and Forecast, 2021-2033
- 10.1. Market Analysis, Insights and Forecast - by Type
- 10.1.1. Tender Guarantee
- 10.1.2. Financial guarantee
- 10.1.3. Advance payment guarantee
- 10.1.4. Foreign bank guarantee
- 10.1.5. Others
- 10.2. Market Analysis, Insights and Forecast - by Application
- 10.2.1. Small and Medium Enterprise
- 10.2.2. Large Enterprise
- 10.2.3. Others
- 10.3. Market Analysis, Insights and Forecast - by Bank
- 10.3.1. Government
- 10.3.2. Private Sector
- 10.4. Market Analysis, Insights and Forecast - by Service Deployment
- 10.4.1. Online
- 10.4.2. Offline
- 10.1. Market Analysis, Insights and Forecast - by Type
- 11. Middle East and Africa Performance Bank Guarantee Market Analysis, Insights and Forecast, 2021-2033
- 11.1. Market Analysis, Insights and Forecast - by Type
- 11.1.1. Tender Guarantee
- 11.1.2. Financial guarantee
- 11.1.3. Advance payment guarantee
- 11.1.4. Foreign bank guarantee
- 11.1.5. Others
- 11.2. Market Analysis, Insights and Forecast - by Application
- 11.2.1. Small and Medium Enterprise
- 11.2.2. Large Enterprise
- 11.2.3. Others
- 11.3. Market Analysis, Insights and Forecast - by Bank
- 11.3.1. Government
- 11.3.2. Private Sector
- 11.4. Market Analysis, Insights and Forecast - by Service Deployment
- 11.4.1. Online
- 11.4.2. Offline
- 11.1. Market Analysis, Insights and Forecast - by Type
- 12. Competitive Analysis
- 12.1. Company Profiles
- 12.1.1 Citigroup
- 12.1.1.1. Company Overview
- 12.1.1.2. Products
- 12.1.1.3. Company Financials
- 12.1.1.4. SWOT Analysis
- 12.1.2 HSBC Group
- 12.1.2.1. Company Overview
- 12.1.2.2. Products
- 12.1.2.3. Company Financials
- 12.1.2.4. SWOT Analysis
- 12.1.3 Deutsche Bank
- 12.1.3.1. Company Overview
- 12.1.3.2. Products
- 12.1.3.3. Company Financials
- 12.1.3.4. SWOT Analysis
- 12.1.4 DBS Bank
- 12.1.4.1. Company Overview
- 12.1.4.2. Products
- 12.1.4.3. Company Financials
- 12.1.4.4. SWOT Analysis
- 12.1.5 Wells Fargo & Company
- 12.1.5.1. Company Overview
- 12.1.5.2. Products
- 12.1.5.3. Company Financials
- 12.1.5.4. SWOT Analysis
- 12.1.6 Soleil Chartered Bank
- 12.1.6.1. Company Overview
- 12.1.6.2. Products
- 12.1.6.3. Company Financials
- 12.1.6.4. SWOT Analysis
- 12.1.7 ICICI Bank Limited
- 12.1.7.1. Company Overview
- 12.1.7.2. Products
- 12.1.7.3. Company Financials
- 12.1.7.4. SWOT Analysis
- 12.1.8 JPMorgan Chase & Co
- 12.1.8.1. Company Overview
- 12.1.8.2. Products
- 12.1.8.3. Company Financials
- 12.1.8.4. SWOT Analysis
- 12.1.9 United Overseas Bank Limited
- 12.1.9.1. Company Overview
- 12.1.9.2. Products
- 12.1.9.3. Company Financials
- 12.1.9.4. SWOT Analysis
- 12.1.10 HDFC Bank Ltd**List Not Exhaustive
- 12.1.10.1. Company Overview
- 12.1.10.2. Products
- 12.1.10.3. Company Financials
- 12.1.10.4. SWOT Analysis
- 12.1.1 Citigroup
- 12.2. Market Entropy
- 12.2.1 Company's Key Areas Served
- 12.2.2 Recent Developments
- 12.3. Company Market Share Analysis 2025
- 12.3.1 Top 5 Companies Market Share Analysis
- 12.3.2 Top 3 Companies Market Share Analysis
- 12.4. List of Potential Customers
- 13. Research Methodology
List of Figures
- Figure 1: Global Performance Bank Guarantee Market Revenue Breakdown (Million, %) by Region 2025 & 2033
- Figure 2: Global Performance Bank Guarantee Market Volume Breakdown (Billion, %) by Region 2025 & 2033
- Figure 3: North America Performance Bank Guarantee Market Revenue (Million), by Type 2025 & 2033
- Figure 4: North America Performance Bank Guarantee Market Volume (Billion), by Type 2025 & 2033
- Figure 5: North America Performance Bank Guarantee Market Revenue Share (%), by Type 2025 & 2033
- Figure 6: North America Performance Bank Guarantee Market Volume Share (%), by Type 2025 & 2033
- Figure 7: North America Performance Bank Guarantee Market Revenue (Million), by Application 2025 & 2033
- Figure 8: North America Performance Bank Guarantee Market Volume (Billion), by Application 2025 & 2033
- Figure 9: North America Performance Bank Guarantee Market Revenue Share (%), by Application 2025 & 2033
- Figure 10: North America Performance Bank Guarantee Market Volume Share (%), by Application 2025 & 2033
- Figure 11: North America Performance Bank Guarantee Market Revenue (Million), by Bank 2025 & 2033
- Figure 12: North America Performance Bank Guarantee Market Volume (Billion), by Bank 2025 & 2033
- Figure 13: North America Performance Bank Guarantee Market Revenue Share (%), by Bank 2025 & 2033
- Figure 14: North America Performance Bank Guarantee Market Volume Share (%), by Bank 2025 & 2033
- Figure 15: North America Performance Bank Guarantee Market Revenue (Million), by Service Deployment 2025 & 2033
- Figure 16: North America Performance Bank Guarantee Market Volume (Billion), by Service Deployment 2025 & 2033
- Figure 17: North America Performance Bank Guarantee Market Revenue Share (%), by Service Deployment 2025 & 2033
- Figure 18: North America Performance Bank Guarantee Market Volume Share (%), by Service Deployment 2025 & 2033
- Figure 19: North America Performance Bank Guarantee Market Revenue (Million), by Country 2025 & 2033
- Figure 20: North America Performance Bank Guarantee Market Volume (Billion), by Country 2025 & 2033
- Figure 21: North America Performance Bank Guarantee Market Revenue Share (%), by Country 2025 & 2033
- Figure 22: North America Performance Bank Guarantee Market Volume Share (%), by Country 2025 & 2033
- Figure 23: Europe Performance Bank Guarantee Market Revenue (Million), by Type 2025 & 2033
- Figure 24: Europe Performance Bank Guarantee Market Volume (Billion), by Type 2025 & 2033
- Figure 25: Europe Performance Bank Guarantee Market Revenue Share (%), by Type 2025 & 2033
- Figure 26: Europe Performance Bank Guarantee Market Volume Share (%), by Type 2025 & 2033
- Figure 27: Europe Performance Bank Guarantee Market Revenue (Million), by Application 2025 & 2033
- Figure 28: Europe Performance Bank Guarantee Market Volume (Billion), by Application 2025 & 2033
- Figure 29: Europe Performance Bank Guarantee Market Revenue Share (%), by Application 2025 & 2033
- Figure 30: Europe Performance Bank Guarantee Market Volume Share (%), by Application 2025 & 2033
- Figure 31: Europe Performance Bank Guarantee Market Revenue (Million), by Bank 2025 & 2033
- Figure 32: Europe Performance Bank Guarantee Market Volume (Billion), by Bank 2025 & 2033
- Figure 33: Europe Performance Bank Guarantee Market Revenue Share (%), by Bank 2025 & 2033
- Figure 34: Europe Performance Bank Guarantee Market Volume Share (%), by Bank 2025 & 2033
- Figure 35: Europe Performance Bank Guarantee Market Revenue (Million), by Service Deployment 2025 & 2033
- Figure 36: Europe Performance Bank Guarantee Market Volume (Billion), by Service Deployment 2025 & 2033
- Figure 37: Europe Performance Bank Guarantee Market Revenue Share (%), by Service Deployment 2025 & 2033
- Figure 38: Europe Performance Bank Guarantee Market Volume Share (%), by Service Deployment 2025 & 2033
- Figure 39: Europe Performance Bank Guarantee Market Revenue (Million), by Country 2025 & 2033
- Figure 40: Europe Performance Bank Guarantee Market Volume (Billion), by Country 2025 & 2033
- Figure 41: Europe Performance Bank Guarantee Market Revenue Share (%), by Country 2025 & 2033
- Figure 42: Europe Performance Bank Guarantee Market Volume Share (%), by Country 2025 & 2033
- Figure 43: Asia Pacific Performance Bank Guarantee Market Revenue (Million), by Type 2025 & 2033
- Figure 44: Asia Pacific Performance Bank Guarantee Market Volume (Billion), by Type 2025 & 2033
- Figure 45: Asia Pacific Performance Bank Guarantee Market Revenue Share (%), by Type 2025 & 2033
- Figure 46: Asia Pacific Performance Bank Guarantee Market Volume Share (%), by Type 2025 & 2033
- Figure 47: Asia Pacific Performance Bank Guarantee Market Revenue (Million), by Application 2025 & 2033
- Figure 48: Asia Pacific Performance Bank Guarantee Market Volume (Billion), by Application 2025 & 2033
- Figure 49: Asia Pacific Performance Bank Guarantee Market Revenue Share (%), by Application 2025 & 2033
- Figure 50: Asia Pacific Performance Bank Guarantee Market Volume Share (%), by Application 2025 & 2033
- Figure 51: Asia Pacific Performance Bank Guarantee Market Revenue (Million), by Bank 2025 & 2033
- Figure 52: Asia Pacific Performance Bank Guarantee Market Volume (Billion), by Bank 2025 & 2033
- Figure 53: Asia Pacific Performance Bank Guarantee Market Revenue Share (%), by Bank 2025 & 2033
- Figure 54: Asia Pacific Performance Bank Guarantee Market Volume Share (%), by Bank 2025 & 2033
- Figure 55: Asia Pacific Performance Bank Guarantee Market Revenue (Million), by Service Deployment 2025 & 2033
- Figure 56: Asia Pacific Performance Bank Guarantee Market Volume (Billion), by Service Deployment 2025 & 2033
- Figure 57: Asia Pacific Performance Bank Guarantee Market Revenue Share (%), by Service Deployment 2025 & 2033
- Figure 58: Asia Pacific Performance Bank Guarantee Market Volume Share (%), by Service Deployment 2025 & 2033
- Figure 59: Asia Pacific Performance Bank Guarantee Market Revenue (Million), by Country 2025 & 2033
- Figure 60: Asia Pacific Performance Bank Guarantee Market Volume (Billion), by Country 2025 & 2033
- Figure 61: Asia Pacific Performance Bank Guarantee Market Revenue Share (%), by Country 2025 & 2033
- Figure 62: Asia Pacific Performance Bank Guarantee Market Volume Share (%), by Country 2025 & 2033
- Figure 63: Latin America Performance Bank Guarantee Market Revenue (Million), by Type 2025 & 2033
- Figure 64: Latin America Performance Bank Guarantee Market Volume (Billion), by Type 2025 & 2033
- Figure 65: Latin America Performance Bank Guarantee Market Revenue Share (%), by Type 2025 & 2033
- Figure 66: Latin America Performance Bank Guarantee Market Volume Share (%), by Type 2025 & 2033
- Figure 67: Latin America Performance Bank Guarantee Market Revenue (Million), by Application 2025 & 2033
- Figure 68: Latin America Performance Bank Guarantee Market Volume (Billion), by Application 2025 & 2033
- Figure 69: Latin America Performance Bank Guarantee Market Revenue Share (%), by Application 2025 & 2033
- Figure 70: Latin America Performance Bank Guarantee Market Volume Share (%), by Application 2025 & 2033
- Figure 71: Latin America Performance Bank Guarantee Market Revenue (Million), by Bank 2025 & 2033
- Figure 72: Latin America Performance Bank Guarantee Market Volume (Billion), by Bank 2025 & 2033
- Figure 73: Latin America Performance Bank Guarantee Market Revenue Share (%), by Bank 2025 & 2033
- Figure 74: Latin America Performance Bank Guarantee Market Volume Share (%), by Bank 2025 & 2033
- Figure 75: Latin America Performance Bank Guarantee Market Revenue (Million), by Service Deployment 2025 & 2033
- Figure 76: Latin America Performance Bank Guarantee Market Volume (Billion), by Service Deployment 2025 & 2033
- Figure 77: Latin America Performance Bank Guarantee Market Revenue Share (%), by Service Deployment 2025 & 2033
- Figure 78: Latin America Performance Bank Guarantee Market Volume Share (%), by Service Deployment 2025 & 2033
- Figure 79: Latin America Performance Bank Guarantee Market Revenue (Million), by Country 2025 & 2033
- Figure 80: Latin America Performance Bank Guarantee Market Volume (Billion), by Country 2025 & 2033
- Figure 81: Latin America Performance Bank Guarantee Market Revenue Share (%), by Country 2025 & 2033
- Figure 82: Latin America Performance Bank Guarantee Market Volume Share (%), by Country 2025 & 2033
- Figure 83: Middle East and Africa Performance Bank Guarantee Market Revenue (Million), by Type 2025 & 2033
- Figure 84: Middle East and Africa Performance Bank Guarantee Market Volume (Billion), by Type 2025 & 2033
- Figure 85: Middle East and Africa Performance Bank Guarantee Market Revenue Share (%), by Type 2025 & 2033
- Figure 86: Middle East and Africa Performance Bank Guarantee Market Volume Share (%), by Type 2025 & 2033
- Figure 87: Middle East and Africa Performance Bank Guarantee Market Revenue (Million), by Application 2025 & 2033
- Figure 88: Middle East and Africa Performance Bank Guarantee Market Volume (Billion), by Application 2025 & 2033
- Figure 89: Middle East and Africa Performance Bank Guarantee Market Revenue Share (%), by Application 2025 & 2033
- Figure 90: Middle East and Africa Performance Bank Guarantee Market Volume Share (%), by Application 2025 & 2033
- Figure 91: Middle East and Africa Performance Bank Guarantee Market Revenue (Million), by Bank 2025 & 2033
- Figure 92: Middle East and Africa Performance Bank Guarantee Market Volume (Billion), by Bank 2025 & 2033
- Figure 93: Middle East and Africa Performance Bank Guarantee Market Revenue Share (%), by Bank 2025 & 2033
- Figure 94: Middle East and Africa Performance Bank Guarantee Market Volume Share (%), by Bank 2025 & 2033
- Figure 95: Middle East and Africa Performance Bank Guarantee Market Revenue (Million), by Service Deployment 2025 & 2033
- Figure 96: Middle East and Africa Performance Bank Guarantee Market Volume (Billion), by Service Deployment 2025 & 2033
- Figure 97: Middle East and Africa Performance Bank Guarantee Market Revenue Share (%), by Service Deployment 2025 & 2033
- Figure 98: Middle East and Africa Performance Bank Guarantee Market Volume Share (%), by Service Deployment 2025 & 2033
- Figure 99: Middle East and Africa Performance Bank Guarantee Market Revenue (Million), by Country 2025 & 2033
- Figure 100: Middle East and Africa Performance Bank Guarantee Market Volume (Billion), by Country 2025 & 2033
- Figure 101: Middle East and Africa Performance Bank Guarantee Market Revenue Share (%), by Country 2025 & 2033
- Figure 102: Middle East and Africa Performance Bank Guarantee Market Volume Share (%), by Country 2025 & 2033
List of Tables
- Table 1: Global Performance Bank Guarantee Market Revenue Million Forecast, by Type 2020 & 2033
- Table 2: Global Performance Bank Guarantee Market Volume Billion Forecast, by Type 2020 & 2033
- Table 3: Global Performance Bank Guarantee Market Revenue Million Forecast, by Application 2020 & 2033
- Table 4: Global Performance Bank Guarantee Market Volume Billion Forecast, by Application 2020 & 2033
- Table 5: Global Performance Bank Guarantee Market Revenue Million Forecast, by Bank 2020 & 2033
- Table 6: Global Performance Bank Guarantee Market Volume Billion Forecast, by Bank 2020 & 2033
- Table 7: Global Performance Bank Guarantee Market Revenue Million Forecast, by Service Deployment 2020 & 2033
- Table 8: Global Performance Bank Guarantee Market Volume Billion Forecast, by Service Deployment 2020 & 2033
- Table 9: Global Performance Bank Guarantee Market Revenue Million Forecast, by Region 2020 & 2033
- Table 10: Global Performance Bank Guarantee Market Volume Billion Forecast, by Region 2020 & 2033
- Table 11: Global Performance Bank Guarantee Market Revenue Million Forecast, by Type 2020 & 2033
- Table 12: Global Performance Bank Guarantee Market Volume Billion Forecast, by Type 2020 & 2033
- Table 13: Global Performance Bank Guarantee Market Revenue Million Forecast, by Application 2020 & 2033
- Table 14: Global Performance Bank Guarantee Market Volume Billion Forecast, by Application 2020 & 2033
- Table 15: Global Performance Bank Guarantee Market Revenue Million Forecast, by Bank 2020 & 2033
- Table 16: Global Performance Bank Guarantee Market Volume Billion Forecast, by Bank 2020 & 2033
- Table 17: Global Performance Bank Guarantee Market Revenue Million Forecast, by Service Deployment 2020 & 2033
- Table 18: Global Performance Bank Guarantee Market Volume Billion Forecast, by Service Deployment 2020 & 2033
- Table 19: Global Performance Bank Guarantee Market Revenue Million Forecast, by Country 2020 & 2033
- Table 20: Global Performance Bank Guarantee Market Volume Billion Forecast, by Country 2020 & 2033
- Table 21: Global Performance Bank Guarantee Market Revenue Million Forecast, by Type 2020 & 2033
- Table 22: Global Performance Bank Guarantee Market Volume Billion Forecast, by Type 2020 & 2033
- Table 23: Global Performance Bank Guarantee Market Revenue Million Forecast, by Application 2020 & 2033
- Table 24: Global Performance Bank Guarantee Market Volume Billion Forecast, by Application 2020 & 2033
- Table 25: Global Performance Bank Guarantee Market Revenue Million Forecast, by Bank 2020 & 2033
- Table 26: Global Performance Bank Guarantee Market Volume Billion Forecast, by Bank 2020 & 2033
- Table 27: Global Performance Bank Guarantee Market Revenue Million Forecast, by Service Deployment 2020 & 2033
- Table 28: Global Performance Bank Guarantee Market Volume Billion Forecast, by Service Deployment 2020 & 2033
- Table 29: Global Performance Bank Guarantee Market Revenue Million Forecast, by Country 2020 & 2033
- Table 30: Global Performance Bank Guarantee Market Volume Billion Forecast, by Country 2020 & 2033
- Table 31: Global Performance Bank Guarantee Market Revenue Million Forecast, by Type 2020 & 2033
- Table 32: Global Performance Bank Guarantee Market Volume Billion Forecast, by Type 2020 & 2033
- Table 33: Global Performance Bank Guarantee Market Revenue Million Forecast, by Application 2020 & 2033
- Table 34: Global Performance Bank Guarantee Market Volume Billion Forecast, by Application 2020 & 2033
- Table 35: Global Performance Bank Guarantee Market Revenue Million Forecast, by Bank 2020 & 2033
- Table 36: Global Performance Bank Guarantee Market Volume Billion Forecast, by Bank 2020 & 2033
- Table 37: Global Performance Bank Guarantee Market Revenue Million Forecast, by Service Deployment 2020 & 2033
- Table 38: Global Performance Bank Guarantee Market Volume Billion Forecast, by Service Deployment 2020 & 2033
- Table 39: Global Performance Bank Guarantee Market Revenue Million Forecast, by Country 2020 & 2033
- Table 40: Global Performance Bank Guarantee Market Volume Billion Forecast, by Country 2020 & 2033
- Table 41: Global Performance Bank Guarantee Market Revenue Million Forecast, by Type 2020 & 2033
- Table 42: Global Performance Bank Guarantee Market Volume Billion Forecast, by Type 2020 & 2033
- Table 43: Global Performance Bank Guarantee Market Revenue Million Forecast, by Application 2020 & 2033
- Table 44: Global Performance Bank Guarantee Market Volume Billion Forecast, by Application 2020 & 2033
- Table 45: Global Performance Bank Guarantee Market Revenue Million Forecast, by Bank 2020 & 2033
- Table 46: Global Performance Bank Guarantee Market Volume Billion Forecast, by Bank 2020 & 2033
- Table 47: Global Performance Bank Guarantee Market Revenue Million Forecast, by Service Deployment 2020 & 2033
- Table 48: Global Performance Bank Guarantee Market Volume Billion Forecast, by Service Deployment 2020 & 2033
- Table 49: Global Performance Bank Guarantee Market Revenue Million Forecast, by Country 2020 & 2033
- Table 50: Global Performance Bank Guarantee Market Volume Billion Forecast, by Country 2020 & 2033
- Table 51: Global Performance Bank Guarantee Market Revenue Million Forecast, by Type 2020 & 2033
- Table 52: Global Performance Bank Guarantee Market Volume Billion Forecast, by Type 2020 & 2033
- Table 53: Global Performance Bank Guarantee Market Revenue Million Forecast, by Application 2020 & 2033
- Table 54: Global Performance Bank Guarantee Market Volume Billion Forecast, by Application 2020 & 2033
- Table 55: Global Performance Bank Guarantee Market Revenue Million Forecast, by Bank 2020 & 2033
- Table 56: Global Performance Bank Guarantee Market Volume Billion Forecast, by Bank 2020 & 2033
- Table 57: Global Performance Bank Guarantee Market Revenue Million Forecast, by Service Deployment 2020 & 2033
- Table 58: Global Performance Bank Guarantee Market Volume Billion Forecast, by Service Deployment 2020 & 2033
- Table 59: Global Performance Bank Guarantee Market Revenue Million Forecast, by Country 2020 & 2033
- Table 60: Global Performance Bank Guarantee Market Volume Billion Forecast, by Country 2020 & 2033
Frequently Asked Questions
1. What is the projected Compound Annual Growth Rate (CAGR) of the Performance Bank Guarantee Market?
The projected CAGR is approximately 5.10%.
2. Which companies are prominent players in the Performance Bank Guarantee Market?
Key companies in the market include Citigroup, HSBC Group, Deutsche Bank, DBS Bank, Wells Fargo & Company, Soleil Chartered Bank, ICICI Bank Limited, JPMorgan Chase & Co, United Overseas Bank Limited, HDFC Bank Ltd**List Not Exhaustive.
3. What are the main segments of the Performance Bank Guarantee Market?
The market segments include Type, Application, Bank, Service Deployment.
4. Can you provide details about the market size?
The market size is estimated to be USD 25.45 Million as of 2022.
5. What are some drivers contributing to market growth?
Growing Demand for Work and Financial Securities among the Business; Increasing Need to Safeguards the Companies From Financial Losses Due To Quality Issues.
6. What are the notable trends driving market growth?
Online Performance Bank Guarantees (PBGs) Witnessing Robust Growth Amidst Digitization of Financial Services and Trade Facilitation.
7. Are there any restraints impacting market growth?
Growing Demand for Work and Financial Securities among the Business; Increasing Need to Safeguards the Companies From Financial Losses Due To Quality Issues.
8. Can you provide examples of recent developments in the market?
Feb 2023: Public sector Indian Overseas Bank has launched the facility of issuance of e-BG (Electronic Bank Guarantee) scheme in association with the National e-Governance Services Ltd.
9. What pricing options are available for accessing the report?
Pricing options include single-user, multi-user, and enterprise licenses priced at USD 4750, USD 5250, and USD 8750 respectively.
10. Is the market size provided in terms of value or volume?
The market size is provided in terms of value, measured in Million and volume, measured in Billion.
11. Are there any specific market keywords associated with the report?
Yes, the market keyword associated with the report is "Performance Bank Guarantee Market," which aids in identifying and referencing the specific market segment covered.
12. How do I determine which pricing option suits my needs best?
The pricing options vary based on user requirements and access needs. Individual users may opt for single-user licenses, while businesses requiring broader access may choose multi-user or enterprise licenses for cost-effective access to the report.
13. Are there any additional resources or data provided in the Performance Bank Guarantee Market report?
While the report offers comprehensive insights, it's advisable to review the specific contents or supplementary materials provided to ascertain if additional resources or data are available.
14. How can I stay updated on further developments or reports in the Performance Bank Guarantee Market?
To stay informed about further developments, trends, and reports in the Performance Bank Guarantee Market, consider subscribing to industry newsletters, following relevant companies and organizations, or regularly checking reputable industry news sources and publications.
Methodology
Step 1 - Identification of Relevant Samples Size from Population Database


Step 2 - Approaches for Defining Global Market Size (Value, Volume* & Price*)

Note*: In applicable scenarios
Step 3 - Data Sources
Primary Research
- Web Analytics
- Survey Reports
- Research Institute
- Latest Research Reports
- Opinion Leaders
Secondary Research
- Annual Reports
- White Paper
- Latest Press Release
- Industry Association
- Paid Database
- Investor Presentations

Step 4 - Data Triangulation
Involves using different sources of information in order to increase the validity of a study
These sources are likely to be stakeholders in a program - participants, other researchers, program staff, other community members, and so on.
Then we put all data in single framework & apply various statistical tools to find out the dynamic on the market.
During the analysis stage, feedback from the stakeholder groups would be compared to determine areas of agreement as well as areas of divergence