

Key Insights
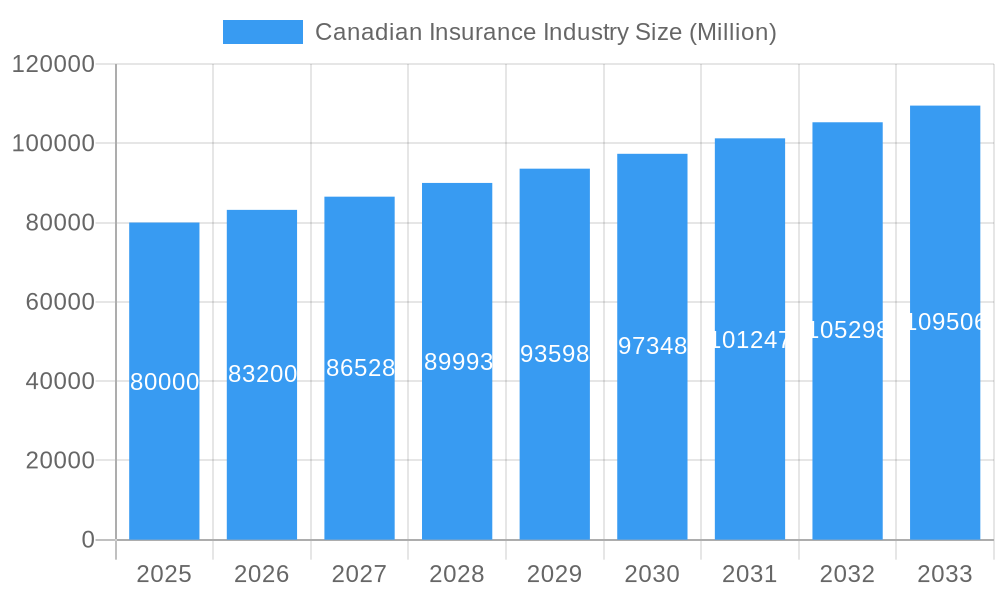
The Canadian insurance industry, valued at approximately $80 billion CAD in 2025, is experiencing robust growth, projected to maintain a Compound Annual Growth Rate (CAGR) exceeding 4% through 2033. This expansion is driven by several key factors. Firstly, Canada's aging population necessitates increased demand for health and long-term care insurance products. Secondly, growing awareness of financial protection needs, coupled with rising disposable incomes, fuels demand for various insurance lines, including auto, home, and life insurance. Technological advancements, such as AI-powered risk assessment and digital distribution channels, are further streamlining operations and improving customer experience, contributing to market growth. However, regulatory changes and increasing competition among established players like Intact Group, Aviva Group, and Desjardins Group, alongside newer entrants, present ongoing challenges. The industry also faces pressure to adapt to evolving customer expectations and manage claims efficiently in an increasingly interconnected digital world.
Canadian Insurance Industry Market Size (In Billion)
The industry segmentation is diverse, encompassing personal lines (auto, home, and health), commercial lines (business interruption, liability, and property), and life and health insurance. Regional variations exist, with larger urban centers generally exhibiting higher insurance penetration rates. While precise regional data is unavailable, it's reasonable to assume that Ontario and Quebec, being the most populous provinces, represent significant portions of the market. The forecast period (2025-2033) anticipates sustained growth, primarily driven by the factors mentioned above, while keeping in mind potential economic fluctuations and shifts in consumer behavior. Companies will need to innovate and adapt to maintain market share in this dynamic and competitive landscape.
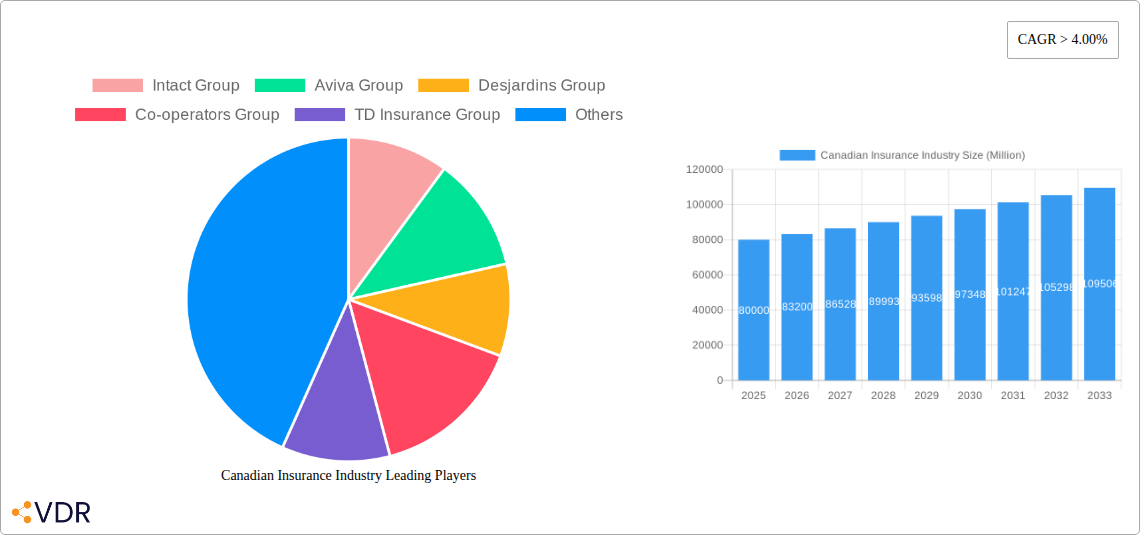
Canadian Insurance Industry Company Market Share
Canadian Insurance Industry Market Report: 2019-2033
This comprehensive report provides a detailed analysis of the Canadian insurance industry, covering market dynamics, growth trends, key players, and future outlook. With a focus on the period 2019-2033 (Base Year: 2025, Forecast Period: 2025-2033), this report is essential for industry professionals, investors, and anyone seeking a deep understanding of this dynamic sector. The report leverages extensive data analysis to provide actionable insights into the parent market (Canadian Insurance) and child markets (Property & Casualty, Life & Health, etc.), offering granular projections and identifying high-growth segments.
Canadian Insurance Industry Market Dynamics & Structure
This section analyzes the Canadian insurance market's concentration, technological advancements, regulatory environment, competitive landscape, and M&A activity. The Canadian insurance market is characterized by a blend of large multinational players and domestic insurers, resulting in a moderately consolidated market structure.
- Market Concentration: The top 5 insurers (Intact, Aviva, Desjardins, Co-operators, TD Insurance) control approximately XX% of the market share in 2024, indicating moderate consolidation.
- Technological Innovation: Insurtech is driving innovation, particularly in areas like AI-powered risk assessment and digital distribution channels. However, legacy systems and data security concerns present barriers.
- Regulatory Framework: The Office of the Superintendent of Financial Institutions (OSFI) plays a significant role in regulating the industry, ensuring solvency and consumer protection.
- Competitive Product Substitutes: The increasing popularity of alternative risk management solutions (e.g., peer-to-peer insurance) presents a competitive challenge to traditional insurers.
- End-User Demographics: An aging population and rising urbanisation are key demographic drivers influencing insurance demand.
- M&A Trends: The Canadian insurance industry has seen notable M&A activity in recent years, particularly amongst smaller firms, indicating a shift toward consolidation. The volume of M&A deals reached xx million in 2024.
Canadian Insurance Industry Growth Trends & Insights
This section details the evolution of market size, adoption rates, technological disruptions, and consumer behavior shifts within the Canadian insurance sector from 2019 to 2033. The market is expected to exhibit steady growth, driven by factors such as increasing insurance penetration, rising disposable incomes, and the expanding use of digital insurance platforms. The total market size is estimated at xx million in 2025, exhibiting a CAGR of xx% from 2025 to 2033. This growth is further fueled by increased awareness of insurance products and services, especially among younger demographics, and the rising adoption of technology which has reduced the cost of delivering services. Technological disruptions, such as AI-powered chatbots for customer service and blockchain for secure claims processing, are transforming the industry, improving efficiency and customer experience.
Dominant Regions, Countries, or Segments in Canadian Insurance Industry
This section identifies leading regions and segments driving market expansion. Ontario and Quebec represent the largest markets due to higher population density and economic activity. Growth is particularly strong in the property & casualty segment driven by increasing urbanization and construction activity.
- Key Drivers: Robust economic growth in major provinces, favorable government policies, and investment in infrastructure projects are contributing to higher insurance premiums across the market.
- Dominance Factors: High population density, established financial sectors, and a strong regulatory framework in Ontario and Quebec contribute to their dominance. The P&C segment benefits from the growth in construction, the rise of cyber security risks, and greater adoption of commercial insurance.
Canadian Insurance Industry Product Landscape
The Canadian insurance market offers a diverse range of products, including auto, home, life, health, and commercial insurance. Recent innovations include customized insurance packages tailored to individual needs, usage-based insurance (UBI) models leveraging telematics, and the rise of parametric insurance for specific events. These products incorporate technological advancements such as AI-driven risk assessment and real-time claims processing, offering increased efficiency and improved customer experience.
Key Drivers, Barriers & Challenges in Canadian Insurance Industry
Key Drivers: Rising disposable incomes, increasing awareness of insurance products, government regulations promoting financial inclusion, and the growth of the digital insurance ecosystem are key growth accelerators. Technological advancements, such as AI and machine learning, are also improving efficiency and customer experience.
Key Barriers & Challenges: Intense competition from both established players and new Insurtechs, stringent regulatory compliance requirements, and the potential impact of climate change causing increased payouts for natural disasters represent significant challenges. Cybersecurity threats and data privacy concerns further add complexity to the operational environment. The cost of claims related to natural disasters is forecasted to increase by xx million over the forecast period.
Emerging Opportunities in Canadian Insurance Industry
Untapped market segments such as microinsurance for low-income populations, specialized insurance products for the gig economy, and the integration of Insurtech solutions present promising opportunities. Growing consumer demand for personalized insurance solutions, coupled with technological advancements in data analytics and AI, will fuel the expansion of tailored insurance offerings.
Growth Accelerators in the Canadian Insurance Industry
Technological breakthroughs, particularly in AI and blockchain, are streamlining operations, improving risk assessment, and enhancing customer experiences. Strategic partnerships between traditional insurers and Insurtech companies are fostering innovation and accelerating the digital transformation of the industry. Market expansion into underserved rural areas and the development of new insurance products targeting specific customer needs will also contribute to long-term growth.
Key Players Shaping the Canadian Insurance Industry Market
- Intact Group
- Aviva Group
- Desjardins Group
- Co-operators Group
- TD Insurance Group
- Wawanesa Mutual Insurance Company
- RSA Group
- Economical Group
- Travelers Group
- Northbridge Group
Notable Milestones in Canadian Insurance Industry Sector
- July 2021: Aon and Willis terminated their USD 30 billion merger agreement, impacting the global insurance brokerage landscape but having limited direct impact on the Canadian market.
- June 2021: Accelerant Holdings' acquisition of Omega General Insurance Company marked a significant entry into the Canadian market, potentially increasing competition and innovation.
In-Depth Canadian Insurance Industry Market Outlook
The Canadian insurance industry is poised for sustained growth driven by technological advancements, increasing insurance penetration, and evolving consumer preferences. Strategic partnerships, market expansion into underserved segments, and the development of innovative insurance products will shape the future of the industry. The market is expected to continue its growth trajectory, presenting significant opportunities for both established players and new entrants.
Canadian Insurance Industry Segmentation
-
1. Insurance Type
- 1.1. Property
- 1.2. Auto
- 1.3. Other Insurance Types
-
2. Distribution Channel
- 2.1. Direct
- 2.2. Agents
- 2.3. Banks
- 2.4. Other Distribution Channels
Canadian Insurance Industry Segmentation By Geography
-
1. North America
- 1.1. United States
- 1.2. Canada
- 1.3. Mexico
-
2. South America
- 2.1. Brazil
- 2.2. Argentina
- 2.3. Rest of South America
-
3. Europe
- 3.1. United Kingdom
- 3.2. Germany
- 3.3. France
- 3.4. Italy
- 3.5. Spain
- 3.6. Russia
- 3.7. Benelux
- 3.8. Nordics
- 3.9. Rest of Europe
-
4. Middle East & Africa
- 4.1. Turkey
- 4.2. Israel
- 4.3. GCC
- 4.4. North Africa
- 4.5. South Africa
- 4.6. Rest of Middle East & Africa
-
5. Asia Pacific
- 5.1. China
- 5.2. India
- 5.3. Japan
- 5.4. South Korea
- 5.5. ASEAN
- 5.6. Oceania
- 5.7. Rest of Asia Pacific
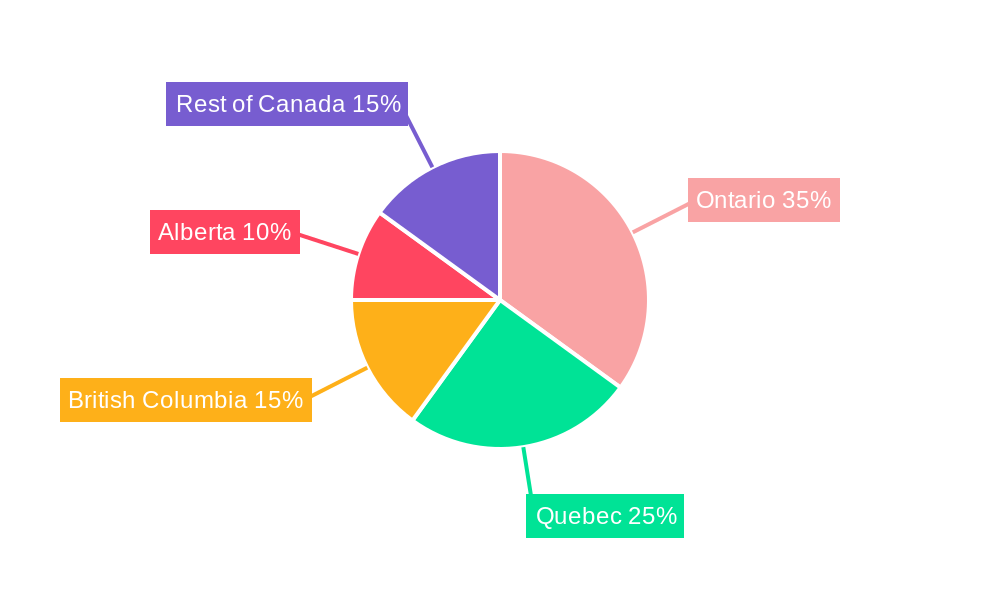
Canadian Insurance Industry Regional Market Share
Geographic Coverage of Canadian Insurance Industry
Canadian Insurance Industry REPORT HIGHLIGHTS
| Aspects | Details |
|---|---|
| Study Period | 2020-2034 |
| Base Year | 2025 |
| Estimated Year | 2026 |
| Forecast Period | 2026-2034 |
| Historical Period | 2020-2025 |
| Growth Rate | CAGR of 6.05% from 2020-2034 |
| Segmentation |
|
Table of Contents
- 1. Introduction
- 1.1. Research Scope
- 1.2. Market Segmentation
- 1.3. Research Objective
- 1.4. Definitions and Assumptions
- 2. Executive Summary
- 2.1. Market Snapshot
- 3. Market Dynamics
- 3.1. Market Drivers
- 3.2. Market Restrains
- 3.3. Market Trends
- 3.4. Market Opportunities
- 4. Market Factor Analysis
- 4.1. Porters Five Forces
- 4.1.1. Bargaining Power of Suppliers
- 4.1.2. Bargaining Power of Buyers
- 4.1.3. Threat of New Entrants
- 4.1.4. Threat of Substitutes
- 4.1.5. Competitive Rivalry
- 4.2. PESTEL analysis
- 4.3. BCG Analysis
- 4.3.1. Stars (High Growth, High Market Share)
- 4.3.2. Cash Cows (Low Growth, High Market Share)
- 4.3.3. Question Mark (High Growth, Low Market Share)
- 4.3.4. Dogs (Low Growth, Low Market Share)
- 4.4. Ansoff Matrix Analysis
- 4.5. Supply Chain Analysis
- 4.6. Regulatory Landscape
- 4.7. Current Market Potential and Opportunity Assessment (TAM–SAM–SOM Framework)
- 4.8. VDR Analyst Note
- 4.1. Porters Five Forces
- 5. Market Analysis, Insights and Forecast 2021-2033
- 5.1. Market Analysis, Insights and Forecast - by Insurance Type
- 5.1.1. Property
- 5.1.2. Auto
- 5.1.3. Other Insurance Types
- 5.2. Market Analysis, Insights and Forecast - by Distribution Channel
- 5.2.1. Direct
- 5.2.2. Agents
- 5.2.3. Banks
- 5.2.4. Other Distribution Channels
- 5.3. Market Analysis, Insights and Forecast - by Region
- 5.3.1. North America
- 5.3.2. South America
- 5.3.3. Europe
- 5.3.4. Middle East & Africa
- 5.3.5. Asia Pacific
- 5.1. Market Analysis, Insights and Forecast - by Insurance Type
- 6. Global Canadian Insurance Industry Analysis, Insights and Forecast, 2021-2033
- 6.1. Market Analysis, Insights and Forecast - by Insurance Type
- 6.1.1. Property
- 6.1.2. Auto
- 6.1.3. Other Insurance Types
- 6.2. Market Analysis, Insights and Forecast - by Distribution Channel
- 6.2.1. Direct
- 6.2.2. Agents
- 6.2.3. Banks
- 6.2.4. Other Distribution Channels
- 6.1. Market Analysis, Insights and Forecast - by Insurance Type
- 7. North America Canadian Insurance Industry Analysis, Insights and Forecast, 2021-2033
- 7.1. Market Analysis, Insights and Forecast - by Insurance Type
- 7.1.1. Property
- 7.1.2. Auto
- 7.1.3. Other Insurance Types
- 7.2. Market Analysis, Insights and Forecast - by Distribution Channel
- 7.2.1. Direct
- 7.2.2. Agents
- 7.2.3. Banks
- 7.2.4. Other Distribution Channels
- 7.1. Market Analysis, Insights and Forecast - by Insurance Type
- 8. South America Canadian Insurance Industry Analysis, Insights and Forecast, 2021-2033
- 8.1. Market Analysis, Insights and Forecast - by Insurance Type
- 8.1.1. Property
- 8.1.2. Auto
- 8.1.3. Other Insurance Types
- 8.2. Market Analysis, Insights and Forecast - by Distribution Channel
- 8.2.1. Direct
- 8.2.2. Agents
- 8.2.3. Banks
- 8.2.4. Other Distribution Channels
- 8.1. Market Analysis, Insights and Forecast - by Insurance Type
- 9. Europe Canadian Insurance Industry Analysis, Insights and Forecast, 2021-2033
- 9.1. Market Analysis, Insights and Forecast - by Insurance Type
- 9.1.1. Property
- 9.1.2. Auto
- 9.1.3. Other Insurance Types
- 9.2. Market Analysis, Insights and Forecast - by Distribution Channel
- 9.2.1. Direct
- 9.2.2. Agents
- 9.2.3. Banks
- 9.2.4. Other Distribution Channels
- 9.1. Market Analysis, Insights and Forecast - by Insurance Type
- 10. Middle East & Africa Canadian Insurance Industry Analysis, Insights and Forecast, 2021-2033
- 10.1. Market Analysis, Insights and Forecast - by Insurance Type
- 10.1.1. Property
- 10.1.2. Auto
- 10.1.3. Other Insurance Types
- 10.2. Market Analysis, Insights and Forecast - by Distribution Channel
- 10.2.1. Direct
- 10.2.2. Agents
- 10.2.3. Banks
- 10.2.4. Other Distribution Channels
- 10.1. Market Analysis, Insights and Forecast - by Insurance Type
- 11. Asia Pacific Canadian Insurance Industry Analysis, Insights and Forecast, 2021-2033
- 11.1. Market Analysis, Insights and Forecast - by Insurance Type
- 11.1.1. Property
- 11.1.2. Auto
- 11.1.3. Other Insurance Types
- 11.2. Market Analysis, Insights and Forecast - by Distribution Channel
- 11.2.1. Direct
- 11.2.2. Agents
- 11.2.3. Banks
- 11.2.4. Other Distribution Channels
- 11.1. Market Analysis, Insights and Forecast - by Insurance Type
- 12. Competitive Analysis
- 12.1. Company Profiles
- 12.1.1 Intact Group
- 12.1.1.1. Company Overview
- 12.1.1.2. Products
- 12.1.1.3. Company Financials
- 12.1.1.4. SWOT Analysis
- 12.1.2 Aviva Group
- 12.1.2.1. Company Overview
- 12.1.2.2. Products
- 12.1.2.3. Company Financials
- 12.1.2.4. SWOT Analysis
- 12.1.3 Desjardins Group
- 12.1.3.1. Company Overview
- 12.1.3.2. Products
- 12.1.3.3. Company Financials
- 12.1.3.4. SWOT Analysis
- 12.1.4 Co-operators Group
- 12.1.4.1. Company Overview
- 12.1.4.2. Products
- 12.1.4.3. Company Financials
- 12.1.4.4. SWOT Analysis
- 12.1.5 TD Insurance Group
- 12.1.5.1. Company Overview
- 12.1.5.2. Products
- 12.1.5.3. Company Financials
- 12.1.5.4. SWOT Analysis
- 12.1.6 Wawanesa Mutual Insurance Company
- 12.1.6.1. Company Overview
- 12.1.6.2. Products
- 12.1.6.3. Company Financials
- 12.1.6.4. SWOT Analysis
- 12.1.7 RSA Group
- 12.1.7.1. Company Overview
- 12.1.7.2. Products
- 12.1.7.3. Company Financials
- 12.1.7.4. SWOT Analysis
- 12.1.8 Economical Group
- 12.1.8.1. Company Overview
- 12.1.8.2. Products
- 12.1.8.3. Company Financials
- 12.1.8.4. SWOT Analysis
- 12.1.9 Travelers Group
- 12.1.9.1. Company Overview
- 12.1.9.2. Products
- 12.1.9.3. Company Financials
- 12.1.9.4. SWOT Analysis
- 12.1.10 Northbridge Group**List Not Exhaustive
- 12.1.10.1. Company Overview
- 12.1.10.2. Products
- 12.1.10.3. Company Financials
- 12.1.10.4. SWOT Analysis
- 12.1.1 Intact Group
- 12.2. Market Entropy
- 12.2.1 Company's Key Areas Served
- 12.2.2 Recent Developments
- 12.3. Company Market Share Analysis 2025
- 12.3.1 Top 5 Companies Market Share Analysis
- 12.3.2 Top 3 Companies Market Share Analysis
- 12.4. List of Potential Customers
- 13. Research Methodology
List of Figures
- Figure 1: Global Canadian Insurance Industry Revenue Breakdown (undefined, %) by Region 2025 & 2033
- Figure 2: North America Canadian Insurance Industry Revenue (undefined), by Insurance Type 2025 & 2033
- Figure 3: North America Canadian Insurance Industry Revenue Share (%), by Insurance Type 2025 & 2033
- Figure 4: North America Canadian Insurance Industry Revenue (undefined), by Distribution Channel 2025 & 2033
- Figure 5: North America Canadian Insurance Industry Revenue Share (%), by Distribution Channel 2025 & 2033
- Figure 6: North America Canadian Insurance Industry Revenue (undefined), by Country 2025 & 2033
- Figure 7: North America Canadian Insurance Industry Revenue Share (%), by Country 2025 & 2033
- Figure 8: South America Canadian Insurance Industry Revenue (undefined), by Insurance Type 2025 & 2033
- Figure 9: South America Canadian Insurance Industry Revenue Share (%), by Insurance Type 2025 & 2033
- Figure 10: South America Canadian Insurance Industry Revenue (undefined), by Distribution Channel 2025 & 2033
- Figure 11: South America Canadian Insurance Industry Revenue Share (%), by Distribution Channel 2025 & 2033
- Figure 12: South America Canadian Insurance Industry Revenue (undefined), by Country 2025 & 2033
- Figure 13: South America Canadian Insurance Industry Revenue Share (%), by Country 2025 & 2033
- Figure 14: Europe Canadian Insurance Industry Revenue (undefined), by Insurance Type 2025 & 2033
- Figure 15: Europe Canadian Insurance Industry Revenue Share (%), by Insurance Type 2025 & 2033
- Figure 16: Europe Canadian Insurance Industry Revenue (undefined), by Distribution Channel 2025 & 2033
- Figure 17: Europe Canadian Insurance Industry Revenue Share (%), by Distribution Channel 2025 & 2033
- Figure 18: Europe Canadian Insurance Industry Revenue (undefined), by Country 2025 & 2033
- Figure 19: Europe Canadian Insurance Industry Revenue Share (%), by Country 2025 & 2033
- Figure 20: Middle East & Africa Canadian Insurance Industry Revenue (undefined), by Insurance Type 2025 & 2033
- Figure 21: Middle East & Africa Canadian Insurance Industry Revenue Share (%), by Insurance Type 2025 & 2033
- Figure 22: Middle East & Africa Canadian Insurance Industry Revenue (undefined), by Distribution Channel 2025 & 2033
- Figure 23: Middle East & Africa Canadian Insurance Industry Revenue Share (%), by Distribution Channel 2025 & 2033
- Figure 24: Middle East & Africa Canadian Insurance Industry Revenue (undefined), by Country 2025 & 2033
- Figure 25: Middle East & Africa Canadian Insurance Industry Revenue Share (%), by Country 2025 & 2033
- Figure 26: Asia Pacific Canadian Insurance Industry Revenue (undefined), by Insurance Type 2025 & 2033
- Figure 27: Asia Pacific Canadian Insurance Industry Revenue Share (%), by Insurance Type 2025 & 2033
- Figure 28: Asia Pacific Canadian Insurance Industry Revenue (undefined), by Distribution Channel 2025 & 2033
- Figure 29: Asia Pacific Canadian Insurance Industry Revenue Share (%), by Distribution Channel 2025 & 2033
- Figure 30: Asia Pacific Canadian Insurance Industry Revenue (undefined), by Country 2025 & 2033
- Figure 31: Asia Pacific Canadian Insurance Industry Revenue Share (%), by Country 2025 & 2033
List of Tables
- Table 1: Global Canadian Insurance Industry Revenue undefined Forecast, by Insurance Type 2020 & 2033
- Table 2: Global Canadian Insurance Industry Revenue undefined Forecast, by Distribution Channel 2020 & 2033
- Table 3: Global Canadian Insurance Industry Revenue undefined Forecast, by Region 2020 & 2033
- Table 4: Global Canadian Insurance Industry Revenue undefined Forecast, by Insurance Type 2020 & 2033
- Table 5: Global Canadian Insurance Industry Revenue undefined Forecast, by Distribution Channel 2020 & 2033
- Table 6: Global Canadian Insurance Industry Revenue undefined Forecast, by Country 2020 & 2033
- Table 7: United States Canadian Insurance Industry Revenue (undefined) Forecast, by Application 2020 & 2033
- Table 8: Canada Canadian Insurance Industry Revenue (undefined) Forecast, by Application 2020 & 2033
- Table 9: Mexico Canadian Insurance Industry Revenue (undefined) Forecast, by Application 2020 & 2033
- Table 10: Global Canadian Insurance Industry Revenue undefined Forecast, by Insurance Type 2020 & 2033
- Table 11: Global Canadian Insurance Industry Revenue undefined Forecast, by Distribution Channel 2020 & 2033
- Table 12: Global Canadian Insurance Industry Revenue undefined Forecast, by Country 2020 & 2033
- Table 13: Brazil Canadian Insurance Industry Revenue (undefined) Forecast, by Application 2020 & 2033
- Table 14: Argentina Canadian Insurance Industry Revenue (undefined) Forecast, by Application 2020 & 2033
- Table 15: Rest of South America Canadian Insurance Industry Revenue (undefined) Forecast, by Application 2020 & 2033
- Table 16: Global Canadian Insurance Industry Revenue undefined Forecast, by Insurance Type 2020 & 2033
- Table 17: Global Canadian Insurance Industry Revenue undefined Forecast, by Distribution Channel 2020 & 2033
- Table 18: Global Canadian Insurance Industry Revenue undefined Forecast, by Country 2020 & 2033
- Table 19: United Kingdom Canadian Insurance Industry Revenue (undefined) Forecast, by Application 2020 & 2033
- Table 20: Germany Canadian Insurance Industry Revenue (undefined) Forecast, by Application 2020 & 2033
- Table 21: France Canadian Insurance Industry Revenue (undefined) Forecast, by Application 2020 & 2033
- Table 22: Italy Canadian Insurance Industry Revenue (undefined) Forecast, by Application 2020 & 2033
- Table 23: Spain Canadian Insurance Industry Revenue (undefined) Forecast, by Application 2020 & 2033
- Table 24: Russia Canadian Insurance Industry Revenue (undefined) Forecast, by Application 2020 & 2033
- Table 25: Benelux Canadian Insurance Industry Revenue (undefined) Forecast, by Application 2020 & 2033
- Table 26: Nordics Canadian Insurance Industry Revenue (undefined) Forecast, by Application 2020 & 2033
- Table 27: Rest of Europe Canadian Insurance Industry Revenue (undefined) Forecast, by Application 2020 & 2033
- Table 28: Global Canadian Insurance Industry Revenue undefined Forecast, by Insurance Type 2020 & 2033
- Table 29: Global Canadian Insurance Industry Revenue undefined Forecast, by Distribution Channel 2020 & 2033
- Table 30: Global Canadian Insurance Industry Revenue undefined Forecast, by Country 2020 & 2033
- Table 31: Turkey Canadian Insurance Industry Revenue (undefined) Forecast, by Application 2020 & 2033
- Table 32: Israel Canadian Insurance Industry Revenue (undefined) Forecast, by Application 2020 & 2033
- Table 33: GCC Canadian Insurance Industry Revenue (undefined) Forecast, by Application 2020 & 2033
- Table 34: North Africa Canadian Insurance Industry Revenue (undefined) Forecast, by Application 2020 & 2033
- Table 35: South Africa Canadian Insurance Industry Revenue (undefined) Forecast, by Application 2020 & 2033
- Table 36: Rest of Middle East & Africa Canadian Insurance Industry Revenue (undefined) Forecast, by Application 2020 & 2033
- Table 37: Global Canadian Insurance Industry Revenue undefined Forecast, by Insurance Type 2020 & 2033
- Table 38: Global Canadian Insurance Industry Revenue undefined Forecast, by Distribution Channel 2020 & 2033
- Table 39: Global Canadian Insurance Industry Revenue undefined Forecast, by Country 2020 & 2033
- Table 40: China Canadian Insurance Industry Revenue (undefined) Forecast, by Application 2020 & 2033
- Table 41: India Canadian Insurance Industry Revenue (undefined) Forecast, by Application 2020 & 2033
- Table 42: Japan Canadian Insurance Industry Revenue (undefined) Forecast, by Application 2020 & 2033
- Table 43: South Korea Canadian Insurance Industry Revenue (undefined) Forecast, by Application 2020 & 2033
- Table 44: ASEAN Canadian Insurance Industry Revenue (undefined) Forecast, by Application 2020 & 2033
- Table 45: Oceania Canadian Insurance Industry Revenue (undefined) Forecast, by Application 2020 & 2033
- Table 46: Rest of Asia Pacific Canadian Insurance Industry Revenue (undefined) Forecast, by Application 2020 & 2033
Frequently Asked Questions
1. What is the projected Compound Annual Growth Rate (CAGR) of the Canadian Insurance Industry?
The projected CAGR is approximately 6.05%.
2. Which companies are prominent players in the Canadian Insurance Industry?
Key companies in the market include Intact Group, Aviva Group, Desjardins Group, Co-operators Group, TD Insurance Group, Wawanesa Mutual Insurance Company, RSA Group, Economical Group, Travelers Group, Northbridge Group**List Not Exhaustive.
3. What are the main segments of the Canadian Insurance Industry?
The market segments include Insurance Type, Distribution Channel.
4. Can you provide details about the market size?
The market size is estimated to be USD XXX N/A as of 2022.
5. What are some drivers contributing to market growth?
N/A
6. What are the notable trends driving market growth?
Increase in Adoption of Artificial Intelligence in Property and Casualty Insurance.
7. Are there any restraints impacting market growth?
N/A
8. Can you provide examples of recent developments in the market?
July 2021: Aon and Willis, the world's second and third-biggest commercial property and casualty brokerage, terminated their USD 30 billion combination agreement. The proposed agreement was initially announced in March of 2020.
9. What pricing options are available for accessing the report?
Pricing options include single-user, multi-user, and enterprise licenses priced at USD 3800, USD 4500, and USD 5800 respectively.
10. Is the market size provided in terms of value or volume?
The market size is provided in terms of value, measured in N/A.
11. Are there any specific market keywords associated with the report?
Yes, the market keyword associated with the report is "Canadian Insurance Industry," which aids in identifying and referencing the specific market segment covered.
12. How do I determine which pricing option suits my needs best?
The pricing options vary based on user requirements and access needs. Individual users may opt for single-user licenses, while businesses requiring broader access may choose multi-user or enterprise licenses for cost-effective access to the report.
13. Are there any additional resources or data provided in the Canadian Insurance Industry report?
While the report offers comprehensive insights, it's advisable to review the specific contents or supplementary materials provided to ascertain if additional resources or data are available.
14. How can I stay updated on further developments or reports in the Canadian Insurance Industry?
To stay informed about further developments, trends, and reports in the Canadian Insurance Industry, consider subscribing to industry newsletters, following relevant companies and organizations, or regularly checking reputable industry news sources and publications.
Methodology
Step 1 - Identification of Relevant Samples Size from Population Database


Step 2 - Approaches for Defining Global Market Size (Value, Volume* & Price*)

Note*: In applicable scenarios
Step 3 - Data Sources
Primary Research
- Web Analytics
- Survey Reports
- Research Institute
- Latest Research Reports
- Opinion Leaders
Secondary Research
- Annual Reports
- White Paper
- Latest Press Release
- Industry Association
- Paid Database
- Investor Presentations

Step 4 - Data Triangulation
Involves using different sources of information in order to increase the validity of a study
These sources are likely to be stakeholders in a program - participants, other researchers, program staff, other community members, and so on.
Then we put all data in single framework & apply various statistical tools to find out the dynamic on the market.
During the analysis stage, feedback from the stakeholder groups would be compared to determine areas of agreement as well as areas of divergence