

Key Insights
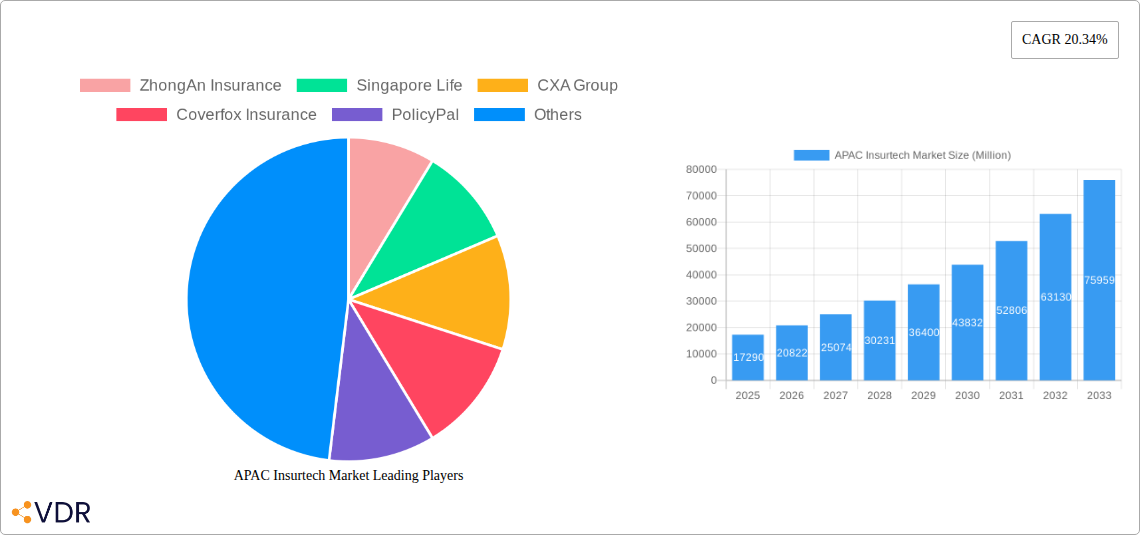
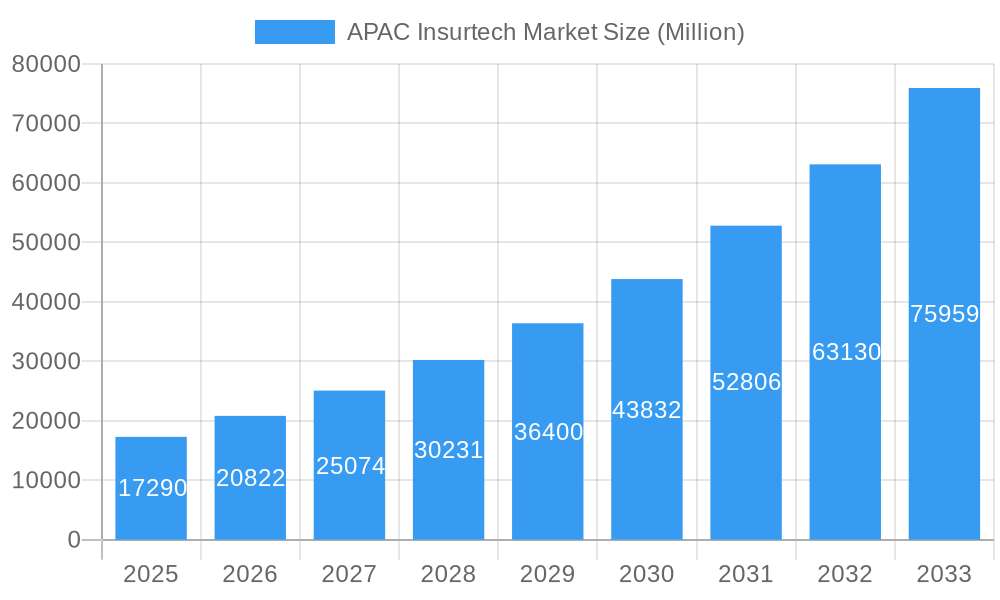
The Asia-Pacific (APAC) Insurtech market is experiencing explosive growth, projected to reach \$17.29 billion in 2025 and maintain a robust Compound Annual Growth Rate (CAGR) of 20.34% from 2025 to 2033. This expansion is fueled by several key drivers. Firstly, the region's burgeoning middle class and increasing smartphone penetration are creating a vast pool of digitally-savvy consumers receptive to innovative insurance solutions. Secondly, the growing adoption of digital technologies, including artificial intelligence (AI), machine learning (ML), and big data analytics, is enabling Insurtech companies to offer personalized, efficient, and cost-effective insurance products and services. Finally, supportive government regulations and initiatives aimed at fostering financial inclusion are further accelerating market growth. The market is witnessing a shift towards mobile-first insurance platforms, embedded insurance models within various digital ecosystems, and the utilization of telematics for risk assessment and personalized pricing. However, challenges remain, including the need for improved cybersecurity measures to protect sensitive customer data and addressing digital literacy gaps within certain segments of the population.
APAC Insurtech Market Market Size (In Billion)
Competition in the APAC Insurtech market is fierce, with a diverse range of players, from established insurance companies integrating digital technologies to agile startups offering niche solutions. Key players such as ZhongAn Insurance, Singapore Life, and PolicyBazaar are leading the charge, leveraging their technological expertise and extensive distribution networks. The market is also characterized by significant regional variations, with mature markets like Australia and Singapore leading the way, while others, particularly in Southeast Asia, present enormous untapped potential. This uneven distribution necessitates tailored strategies to effectively address diverse market conditions and regulatory frameworks across the APAC region. Continued investment in technological innovation, strategic partnerships, and a focus on customer experience will be crucial for companies to thrive in this dynamic and rapidly evolving landscape.
APAC Insurtech Market Company Market Share
APAC Insurtech Market Report: 2019-2033
This comprehensive report provides an in-depth analysis of the rapidly evolving Asia-Pacific Insurtech market, covering the period 2019-2033. It delves into market dynamics, growth trends, key players, and future opportunities, offering invaluable insights for industry professionals, investors, and strategists. The report segments the market by various categories and provides detailed forecasts, including market size projections in millions.
APAC Insurtech Market Dynamics & Structure
The APAC Insurtech market is characterized by a dynamic interplay of factors shaping its growth and competitive landscape. Market concentration is moderate, with a few large players and numerous smaller, niche players vying for market share. Technological innovation, particularly in areas like AI, blockchain, and big data analytics, is a key driver. However, regulatory frameworks vary across countries, creating both opportunities and challenges. The increasing adoption of digital technologies by consumers and businesses fuels market expansion.
- Market Concentration: Moderate, with xx% market share held by the top 5 players in 2024.
- Technological Innovation: AI, machine learning, blockchain, and IoT are key drivers.
- Regulatory Landscape: Varying regulations across countries present both opportunities and challenges.
- Competitive Substitutes: Traditional insurance models pose a competitive threat.
- M&A Activity: Significant M&A activity observed in recent years, with xx deals in the past 5 years (valued at xx Million).
- End-User Demographics: Growing middle class and increasing digital literacy boost demand.
APAC Insurtech Market Growth Trends & Insights
The APAC Insurtech market experienced significant growth during the historical period (2019-2024). The market size reached xx Million in 2024, exhibiting a CAGR of xx% during this period. This robust growth is driven by factors like rising smartphone penetration, increasing internet access, and a growing preference for digital solutions. Technological disruptions such as the emergence of embedded insurance and the integration of AI in claims processing are reshaping the industry. Consumer behavior shifts toward personalized and on-demand insurance services are further accelerating market expansion. The forecast period (2025-2033) projects continued expansion, with the market size expected to reach xx Million by 2033, driven by factors such as growing digitalization and increasing consumer demand for innovative insurance products and services. Market penetration is expected to increase from xx% in 2024 to xx% in 2033.
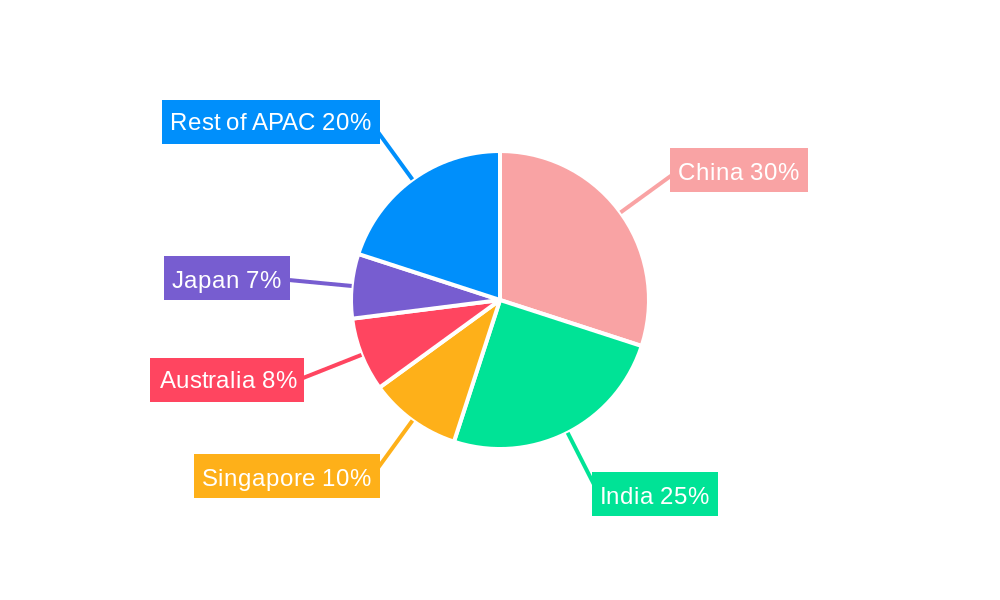
Dominant Regions, Countries, or Segments in APAC Insurtech Market
While the entire APAC region exhibits strong growth, certain countries and segments are leading the charge. India and China are the largest markets, benefiting from vast populations and rapid digital adoption. The health insurance and personal lines segments are experiencing faster growth rates compared to commercial lines.
- India: Large and rapidly growing market due to increasing digital adoption, favorable regulatory environment, and a large young population.
- China: Significant market size, but regulatory changes and competition impact growth rate.
- Singapore: Strong adoption of fintech innovations and a sophisticated regulatory framework.
- Indonesia: Large, underserved market with high potential for growth.
- Health Insurance: Higher growth rate compared to other segments, driven by rising health consciousness and aging population.
- Personal Lines: High growth due to increasing penetration of digital platforms and affordable options.
APAC Insurtech Market Product Landscape
The APAC Insurtech market showcases a diverse range of innovative products and services. These include AI-powered risk assessment tools, personalized insurance plans, blockchain-based fraud detection systems, and mobile-first insurance platforms. Unique selling propositions emphasize user-friendliness, affordability, and convenience. Technological advancements are focused on improving customer experience, streamlining processes, and enhancing efficiency.
Key Drivers, Barriers & Challenges in APAC Insurtech Market
Key Drivers:
- Rising smartphone penetration and internet access.
- Increasing consumer demand for personalized and on-demand insurance services.
- Government initiatives promoting financial inclusion and digitalization.
- Technological advancements such as AI, machine learning, and blockchain.
Challenges:
- Data security and privacy concerns.
- Regulatory uncertainties and varying compliance requirements across countries.
- Competition from established players and legacy systems.
- Limited digital literacy in some regions.
- Supply chain disruptions impacted negatively by xx%.
Emerging Opportunities in APAC Insurtech Market
- Untapped markets in less developed economies.
- Expansion into new insurance products and services (e.g., parametric insurance, microinsurance).
- Integration of Insurtech with other FinTech solutions.
- Increasing demand for personalized and customized insurance plans.
Growth Accelerators in the APAP Insurtech Market Industry
Several factors are poised to accelerate long-term growth in the APAC Insurtech market. These include continued advancements in AI and machine learning technologies, strategic partnerships between Insurtech companies and traditional insurers, and expansion into underserved markets. The increasing adoption of cloud-based solutions and the development of innovative business models such as embedded insurance will further propel market expansion.
Key Players Shaping the APAC Insurtech Market Market
- ZhongAn Insurance
- Singapore Life
- CXA Group
- Coverfox Insurance
- PolicyPal
- PolicyBazaar
- Acko General Insurance Ltd
- WaterDrop
- Digit Insurance
- CompareAsiaGroup
- GoBear
- SmartHR
- Prenetics
- PasarPolis
- List Not Exhaustive
Notable Milestones in APAC Insurtech Market Sector
- May 2024: MyGate obtains an aggregator license from IRDAI to distribute insurance policies in India. This signifies the expansion of insurance distribution channels beyond traditional methods.
- March 2023: BlackRock and Citi partner with Singlife, enhancing portfolio management capabilities and streamlining operations. This highlights the growing integration of technology in insurance operations and the increasing role of strategic partnerships.
In-Depth APAC Insurtech Market Market Outlook
The APAC Insurtech market is poised for continued robust growth, driven by technological innovation, changing consumer preferences, and favorable regulatory environments in certain regions. Strategic partnerships and expansions into untapped markets will create significant opportunities for both established players and new entrants. The market's future potential lies in the development of innovative products and services that leverage emerging technologies to deliver personalized, efficient, and affordable insurance solutions. The long-term outlook remains positive, with the market expected to experience substantial growth over the forecast period.
APAC Insurtech Market Segmentation
-
1. Insurance Line
- 1.1. Health
- 1.2. Life
- 1.3. Non-life
APAC Insurtech Market Segmentation By Geography
-
1. North America
- 1.1. United States
- 1.2. Canada
- 1.3. Mexico
-
2. South America
- 2.1. Brazil
- 2.2. Argentina
- 2.3. Rest of South America
-
3. Europe
- 3.1. United Kingdom
- 3.2. Germany
- 3.3. France
- 3.4. Italy
- 3.5. Spain
- 3.6. Russia
- 3.7. Benelux
- 3.8. Nordics
- 3.9. Rest of Europe
-
4. Middle East & Africa
- 4.1. Turkey
- 4.2. Israel
- 4.3. GCC
- 4.4. North Africa
- 4.5. South Africa
- 4.6. Rest of Middle East & Africa
-
5. Asia Pacific
- 5.1. China
- 5.2. India
- 5.3. Japan
- 5.4. South Korea
- 5.5. ASEAN
- 5.6. Oceania
- 5.7. Rest of Asia Pacific
APAC Insurtech Market Regional Market Share
Geographic Coverage of APAC Insurtech Market
APAC Insurtech Market REPORT HIGHLIGHTS
| Aspects | Details |
|---|---|
| Study Period | 2020-2034 |
| Base Year | 2025 |
| Estimated Year | 2026 |
| Forecast Period | 2026-2034 |
| Historical Period | 2020-2025 |
| Growth Rate | CAGR of 20.34% from 2020-2034 |
| Segmentation |
|
Table of Contents
- 1. Introduction
- 1.1. Research Scope
- 1.2. Market Segmentation
- 1.3. Research Objective
- 1.4. Definitions and Assumptions
- 2. Executive Summary
- 2.1. Market Snapshot
- 3. Market Dynamics
- 3.1. Market Drivers
- 3.2. Market Restrains
- 3.3. Market Trends
- 3.4. Market Opportunities
- 4. Market Factor Analysis
- 4.1. Porters Five Forces
- 4.1.1. Bargaining Power of Suppliers
- 4.1.2. Bargaining Power of Buyers
- 4.1.3. Threat of New Entrants
- 4.1.4. Threat of Substitutes
- 4.1.5. Competitive Rivalry
- 4.2. PESTEL analysis
- 4.3. BCG Analysis
- 4.3.1. Stars (High Growth, High Market Share)
- 4.3.2. Cash Cows (Low Growth, High Market Share)
- 4.3.3. Question Mark (High Growth, Low Market Share)
- 4.3.4. Dogs (Low Growth, Low Market Share)
- 4.4. Ansoff Matrix Analysis
- 4.5. Supply Chain Analysis
- 4.6. Regulatory Landscape
- 4.7. Current Market Potential and Opportunity Assessment (TAM–SAM–SOM Framework)
- 4.8. VDR Analyst Note
- 4.1. Porters Five Forces
- 5. Market Analysis, Insights and Forecast 2021-2033
- 5.1. Market Analysis, Insights and Forecast - by Insurance Line
- 5.1.1. Health
- 5.1.2. Life
- 5.1.3. Non-life
- 5.2. Market Analysis, Insights and Forecast - by Region
- 5.2.1. North America
- 5.2.2. South America
- 5.2.3. Europe
- 5.2.4. Middle East & Africa
- 5.2.5. Asia Pacific
- 5.1. Market Analysis, Insights and Forecast - by Insurance Line
- 6. Global APAC Insurtech Market Analysis, Insights and Forecast, 2021-2033
- 6.1. Market Analysis, Insights and Forecast - by Insurance Line
- 6.1.1. Health
- 6.1.2. Life
- 6.1.3. Non-life
- 6.1. Market Analysis, Insights and Forecast - by Insurance Line
- 7. North America APAC Insurtech Market Analysis, Insights and Forecast, 2021-2033
- 7.1. Market Analysis, Insights and Forecast - by Insurance Line
- 7.1.1. Health
- 7.1.2. Life
- 7.1.3. Non-life
- 7.1. Market Analysis, Insights and Forecast - by Insurance Line
- 8. South America APAC Insurtech Market Analysis, Insights and Forecast, 2021-2033
- 8.1. Market Analysis, Insights and Forecast - by Insurance Line
- 8.1.1. Health
- 8.1.2. Life
- 8.1.3. Non-life
- 8.1. Market Analysis, Insights and Forecast - by Insurance Line
- 9. Europe APAC Insurtech Market Analysis, Insights and Forecast, 2021-2033
- 9.1. Market Analysis, Insights and Forecast - by Insurance Line
- 9.1.1. Health
- 9.1.2. Life
- 9.1.3. Non-life
- 9.1. Market Analysis, Insights and Forecast - by Insurance Line
- 10. Middle East & Africa APAC Insurtech Market Analysis, Insights and Forecast, 2021-2033
- 10.1. Market Analysis, Insights and Forecast - by Insurance Line
- 10.1.1. Health
- 10.1.2. Life
- 10.1.3. Non-life
- 10.1. Market Analysis, Insights and Forecast - by Insurance Line
- 11. Asia Pacific APAC Insurtech Market Analysis, Insights and Forecast, 2021-2033
- 11.1. Market Analysis, Insights and Forecast - by Insurance Line
- 11.1.1. Health
- 11.1.2. Life
- 11.1.3. Non-life
- 11.1. Market Analysis, Insights and Forecast - by Insurance Line
- 12. Competitive Analysis
- 12.1. Company Profiles
- 12.1.1 ZhongAn Insurance
- 12.1.1.1. Company Overview
- 12.1.1.2. Products
- 12.1.1.3. Company Financials
- 12.1.1.4. SWOT Analysis
- 12.1.2 Singapore Life
- 12.1.2.1. Company Overview
- 12.1.2.2. Products
- 12.1.2.3. Company Financials
- 12.1.2.4. SWOT Analysis
- 12.1.3 CXA Group
- 12.1.3.1. Company Overview
- 12.1.3.2. Products
- 12.1.3.3. Company Financials
- 12.1.3.4. SWOT Analysis
- 12.1.4 Coverfox Insurance
- 12.1.4.1. Company Overview
- 12.1.4.2. Products
- 12.1.4.3. Company Financials
- 12.1.4.4. SWOT Analysis
- 12.1.5 PolicyPal
- 12.1.5.1. Company Overview
- 12.1.5.2. Products
- 12.1.5.3. Company Financials
- 12.1.5.4. SWOT Analysis
- 12.1.6 PolicyBazaar
- 12.1.6.1. Company Overview
- 12.1.6.2. Products
- 12.1.6.3. Company Financials
- 12.1.6.4. SWOT Analysis
- 12.1.7 Acko General Insurance Ltd
- 12.1.7.1. Company Overview
- 12.1.7.2. Products
- 12.1.7.3. Company Financials
- 12.1.7.4. SWOT Analysis
- 12.1.8 WaterDrop
- 12.1.8.1. Company Overview
- 12.1.8.2. Products
- 12.1.8.3. Company Financials
- 12.1.8.4. SWOT Analysis
- 12.1.9 Digit Insurance
- 12.1.9.1. Company Overview
- 12.1.9.2. Products
- 12.1.9.3. Company Financials
- 12.1.9.4. SWOT Analysis
- 12.1.10 CompareAsiaGroup
- 12.1.10.1. Company Overview
- 12.1.10.2. Products
- 12.1.10.3. Company Financials
- 12.1.10.4. SWOT Analysis
- 12.1.11 GoBear
- 12.1.11.1. Company Overview
- 12.1.11.2. Products
- 12.1.11.3. Company Financials
- 12.1.11.4. SWOT Analysis
- 12.1.12 SmartHR
- 12.1.12.1. Company Overview
- 12.1.12.2. Products
- 12.1.12.3. Company Financials
- 12.1.12.4. SWOT Analysis
- 12.1.13 Prenetics
- 12.1.13.1. Company Overview
- 12.1.13.2. Products
- 12.1.13.3. Company Financials
- 12.1.13.4. SWOT Analysis
- 12.1.14 PasarPolis**List Not Exhaustive
- 12.1.14.1. Company Overview
- 12.1.14.2. Products
- 12.1.14.3. Company Financials
- 12.1.14.4. SWOT Analysis
- 12.1.1 ZhongAn Insurance
- 12.2. Market Entropy
- 12.2.1 Company's Key Areas Served
- 12.2.2 Recent Developments
- 12.3. Company Market Share Analysis 2025
- 12.3.1 Top 5 Companies Market Share Analysis
- 12.3.2 Top 3 Companies Market Share Analysis
- 12.4. List of Potential Customers
- 13. Research Methodology
List of Figures
- Figure 1: Global APAC Insurtech Market Revenue Breakdown (Million, %) by Region 2025 & 2033
- Figure 2: Global APAC Insurtech Market Volume Breakdown (Billion, %) by Region 2025 & 2033
- Figure 3: North America APAC Insurtech Market Revenue (Million), by Insurance Line 2025 & 2033
- Figure 4: North America APAC Insurtech Market Volume (Billion), by Insurance Line 2025 & 2033
- Figure 5: North America APAC Insurtech Market Revenue Share (%), by Insurance Line 2025 & 2033
- Figure 6: North America APAC Insurtech Market Volume Share (%), by Insurance Line 2025 & 2033
- Figure 7: North America APAC Insurtech Market Revenue (Million), by Country 2025 & 2033
- Figure 8: North America APAC Insurtech Market Volume (Billion), by Country 2025 & 2033
- Figure 9: North America APAC Insurtech Market Revenue Share (%), by Country 2025 & 2033
- Figure 10: North America APAC Insurtech Market Volume Share (%), by Country 2025 & 2033
- Figure 11: South America APAC Insurtech Market Revenue (Million), by Insurance Line 2025 & 2033
- Figure 12: South America APAC Insurtech Market Volume (Billion), by Insurance Line 2025 & 2033
- Figure 13: South America APAC Insurtech Market Revenue Share (%), by Insurance Line 2025 & 2033
- Figure 14: South America APAC Insurtech Market Volume Share (%), by Insurance Line 2025 & 2033
- Figure 15: South America APAC Insurtech Market Revenue (Million), by Country 2025 & 2033
- Figure 16: South America APAC Insurtech Market Volume (Billion), by Country 2025 & 2033
- Figure 17: South America APAC Insurtech Market Revenue Share (%), by Country 2025 & 2033
- Figure 18: South America APAC Insurtech Market Volume Share (%), by Country 2025 & 2033
- Figure 19: Europe APAC Insurtech Market Revenue (Million), by Insurance Line 2025 & 2033
- Figure 20: Europe APAC Insurtech Market Volume (Billion), by Insurance Line 2025 & 2033
- Figure 21: Europe APAC Insurtech Market Revenue Share (%), by Insurance Line 2025 & 2033
- Figure 22: Europe APAC Insurtech Market Volume Share (%), by Insurance Line 2025 & 2033
- Figure 23: Europe APAC Insurtech Market Revenue (Million), by Country 2025 & 2033
- Figure 24: Europe APAC Insurtech Market Volume (Billion), by Country 2025 & 2033
- Figure 25: Europe APAC Insurtech Market Revenue Share (%), by Country 2025 & 2033
- Figure 26: Europe APAC Insurtech Market Volume Share (%), by Country 2025 & 2033
- Figure 27: Middle East & Africa APAC Insurtech Market Revenue (Million), by Insurance Line 2025 & 2033
- Figure 28: Middle East & Africa APAC Insurtech Market Volume (Billion), by Insurance Line 2025 & 2033
- Figure 29: Middle East & Africa APAC Insurtech Market Revenue Share (%), by Insurance Line 2025 & 2033
- Figure 30: Middle East & Africa APAC Insurtech Market Volume Share (%), by Insurance Line 2025 & 2033
- Figure 31: Middle East & Africa APAC Insurtech Market Revenue (Million), by Country 2025 & 2033
- Figure 32: Middle East & Africa APAC Insurtech Market Volume (Billion), by Country 2025 & 2033
- Figure 33: Middle East & Africa APAC Insurtech Market Revenue Share (%), by Country 2025 & 2033
- Figure 34: Middle East & Africa APAC Insurtech Market Volume Share (%), by Country 2025 & 2033
- Figure 35: Asia Pacific APAC Insurtech Market Revenue (Million), by Insurance Line 2025 & 2033
- Figure 36: Asia Pacific APAC Insurtech Market Volume (Billion), by Insurance Line 2025 & 2033
- Figure 37: Asia Pacific APAC Insurtech Market Revenue Share (%), by Insurance Line 2025 & 2033
- Figure 38: Asia Pacific APAC Insurtech Market Volume Share (%), by Insurance Line 2025 & 2033
- Figure 39: Asia Pacific APAC Insurtech Market Revenue (Million), by Country 2025 & 2033
- Figure 40: Asia Pacific APAC Insurtech Market Volume (Billion), by Country 2025 & 2033
- Figure 41: Asia Pacific APAC Insurtech Market Revenue Share (%), by Country 2025 & 2033
- Figure 42: Asia Pacific APAC Insurtech Market Volume Share (%), by Country 2025 & 2033
List of Tables
- Table 1: Global APAC Insurtech Market Revenue Million Forecast, by Insurance Line 2020 & 2033
- Table 2: Global APAC Insurtech Market Volume Billion Forecast, by Insurance Line 2020 & 2033
- Table 3: Global APAC Insurtech Market Revenue Million Forecast, by Region 2020 & 2033
- Table 4: Global APAC Insurtech Market Volume Billion Forecast, by Region 2020 & 2033
- Table 5: Global APAC Insurtech Market Revenue Million Forecast, by Insurance Line 2020 & 2033
- Table 6: Global APAC Insurtech Market Volume Billion Forecast, by Insurance Line 2020 & 2033
- Table 7: Global APAC Insurtech Market Revenue Million Forecast, by Country 2020 & 2033
- Table 8: Global APAC Insurtech Market Volume Billion Forecast, by Country 2020 & 2033
- Table 9: United States APAC Insurtech Market Revenue (Million) Forecast, by Application 2020 & 2033
- Table 10: United States APAC Insurtech Market Volume (Billion) Forecast, by Application 2020 & 2033
- Table 11: Canada APAC Insurtech Market Revenue (Million) Forecast, by Application 2020 & 2033
- Table 12: Canada APAC Insurtech Market Volume (Billion) Forecast, by Application 2020 & 2033
- Table 13: Mexico APAC Insurtech Market Revenue (Million) Forecast, by Application 2020 & 2033
- Table 14: Mexico APAC Insurtech Market Volume (Billion) Forecast, by Application 2020 & 2033
- Table 15: Global APAC Insurtech Market Revenue Million Forecast, by Insurance Line 2020 & 2033
- Table 16: Global APAC Insurtech Market Volume Billion Forecast, by Insurance Line 2020 & 2033
- Table 17: Global APAC Insurtech Market Revenue Million Forecast, by Country 2020 & 2033
- Table 18: Global APAC Insurtech Market Volume Billion Forecast, by Country 2020 & 2033
- Table 19: Brazil APAC Insurtech Market Revenue (Million) Forecast, by Application 2020 & 2033
- Table 20: Brazil APAC Insurtech Market Volume (Billion) Forecast, by Application 2020 & 2033
- Table 21: Argentina APAC Insurtech Market Revenue (Million) Forecast, by Application 2020 & 2033
- Table 22: Argentina APAC Insurtech Market Volume (Billion) Forecast, by Application 2020 & 2033
- Table 23: Rest of South America APAC Insurtech Market Revenue (Million) Forecast, by Application 2020 & 2033
- Table 24: Rest of South America APAC Insurtech Market Volume (Billion) Forecast, by Application 2020 & 2033
- Table 25: Global APAC Insurtech Market Revenue Million Forecast, by Insurance Line 2020 & 2033
- Table 26: Global APAC Insurtech Market Volume Billion Forecast, by Insurance Line 2020 & 2033
- Table 27: Global APAC Insurtech Market Revenue Million Forecast, by Country 2020 & 2033
- Table 28: Global APAC Insurtech Market Volume Billion Forecast, by Country 2020 & 2033
- Table 29: United Kingdom APAC Insurtech Market Revenue (Million) Forecast, by Application 2020 & 2033
- Table 30: United Kingdom APAC Insurtech Market Volume (Billion) Forecast, by Application 2020 & 2033
- Table 31: Germany APAC Insurtech Market Revenue (Million) Forecast, by Application 2020 & 2033
- Table 32: Germany APAC Insurtech Market Volume (Billion) Forecast, by Application 2020 & 2033
- Table 33: France APAC Insurtech Market Revenue (Million) Forecast, by Application 2020 & 2033
- Table 34: France APAC Insurtech Market Volume (Billion) Forecast, by Application 2020 & 2033
- Table 35: Italy APAC Insurtech Market Revenue (Million) Forecast, by Application 2020 & 2033
- Table 36: Italy APAC Insurtech Market Volume (Billion) Forecast, by Application 2020 & 2033
- Table 37: Spain APAC Insurtech Market Revenue (Million) Forecast, by Application 2020 & 2033
- Table 38: Spain APAC Insurtech Market Volume (Billion) Forecast, by Application 2020 & 2033
- Table 39: Russia APAC Insurtech Market Revenue (Million) Forecast, by Application 2020 & 2033
- Table 40: Russia APAC Insurtech Market Volume (Billion) Forecast, by Application 2020 & 2033
- Table 41: Benelux APAC Insurtech Market Revenue (Million) Forecast, by Application 2020 & 2033
- Table 42: Benelux APAC Insurtech Market Volume (Billion) Forecast, by Application 2020 & 2033
- Table 43: Nordics APAC Insurtech Market Revenue (Million) Forecast, by Application 2020 & 2033
- Table 44: Nordics APAC Insurtech Market Volume (Billion) Forecast, by Application 2020 & 2033
- Table 45: Rest of Europe APAC Insurtech Market Revenue (Million) Forecast, by Application 2020 & 2033
- Table 46: Rest of Europe APAC Insurtech Market Volume (Billion) Forecast, by Application 2020 & 2033
- Table 47: Global APAC Insurtech Market Revenue Million Forecast, by Insurance Line 2020 & 2033
- Table 48: Global APAC Insurtech Market Volume Billion Forecast, by Insurance Line 2020 & 2033
- Table 49: Global APAC Insurtech Market Revenue Million Forecast, by Country 2020 & 2033
- Table 50: Global APAC Insurtech Market Volume Billion Forecast, by Country 2020 & 2033
- Table 51: Turkey APAC Insurtech Market Revenue (Million) Forecast, by Application 2020 & 2033
- Table 52: Turkey APAC Insurtech Market Volume (Billion) Forecast, by Application 2020 & 2033
- Table 53: Israel APAC Insurtech Market Revenue (Million) Forecast, by Application 2020 & 2033
- Table 54: Israel APAC Insurtech Market Volume (Billion) Forecast, by Application 2020 & 2033
- Table 55: GCC APAC Insurtech Market Revenue (Million) Forecast, by Application 2020 & 2033
- Table 56: GCC APAC Insurtech Market Volume (Billion) Forecast, by Application 2020 & 2033
- Table 57: North Africa APAC Insurtech Market Revenue (Million) Forecast, by Application 2020 & 2033
- Table 58: North Africa APAC Insurtech Market Volume (Billion) Forecast, by Application 2020 & 2033
- Table 59: South Africa APAC Insurtech Market Revenue (Million) Forecast, by Application 2020 & 2033
- Table 60: South Africa APAC Insurtech Market Volume (Billion) Forecast, by Application 2020 & 2033
- Table 61: Rest of Middle East & Africa APAC Insurtech Market Revenue (Million) Forecast, by Application 2020 & 2033
- Table 62: Rest of Middle East & Africa APAC Insurtech Market Volume (Billion) Forecast, by Application 2020 & 2033
- Table 63: Global APAC Insurtech Market Revenue Million Forecast, by Insurance Line 2020 & 2033
- Table 64: Global APAC Insurtech Market Volume Billion Forecast, by Insurance Line 2020 & 2033
- Table 65: Global APAC Insurtech Market Revenue Million Forecast, by Country 2020 & 2033
- Table 66: Global APAC Insurtech Market Volume Billion Forecast, by Country 2020 & 2033
- Table 67: China APAC Insurtech Market Revenue (Million) Forecast, by Application 2020 & 2033
- Table 68: China APAC Insurtech Market Volume (Billion) Forecast, by Application 2020 & 2033
- Table 69: India APAC Insurtech Market Revenue (Million) Forecast, by Application 2020 & 2033
- Table 70: India APAC Insurtech Market Volume (Billion) Forecast, by Application 2020 & 2033
- Table 71: Japan APAC Insurtech Market Revenue (Million) Forecast, by Application 2020 & 2033
- Table 72: Japan APAC Insurtech Market Volume (Billion) Forecast, by Application 2020 & 2033
- Table 73: South Korea APAC Insurtech Market Revenue (Million) Forecast, by Application 2020 & 2033
- Table 74: South Korea APAC Insurtech Market Volume (Billion) Forecast, by Application 2020 & 2033
- Table 75: ASEAN APAC Insurtech Market Revenue (Million) Forecast, by Application 2020 & 2033
- Table 76: ASEAN APAC Insurtech Market Volume (Billion) Forecast, by Application 2020 & 2033
- Table 77: Oceania APAC Insurtech Market Revenue (Million) Forecast, by Application 2020 & 2033
- Table 78: Oceania APAC Insurtech Market Volume (Billion) Forecast, by Application 2020 & 2033
- Table 79: Rest of Asia Pacific APAC Insurtech Market Revenue (Million) Forecast, by Application 2020 & 2033
- Table 80: Rest of Asia Pacific APAC Insurtech Market Volume (Billion) Forecast, by Application 2020 & 2033
Frequently Asked Questions
1. What is the projected Compound Annual Growth Rate (CAGR) of the APAC Insurtech Market?
The projected CAGR is approximately 20.34%.
2. Which companies are prominent players in the APAC Insurtech Market?
Key companies in the market include ZhongAn Insurance, Singapore Life, CXA Group, Coverfox Insurance, PolicyPal, PolicyBazaar, Acko General Insurance Ltd, WaterDrop, Digit Insurance, CompareAsiaGroup, GoBear, SmartHR, Prenetics, PasarPolis**List Not Exhaustive.
3. What are the main segments of the APAC Insurtech Market?
The market segments include Insurance Line.
4. Can you provide details about the market size?
The market size is estimated to be USD 17.29 Million as of 2022.
5. What are some drivers contributing to market growth?
Increasing Adoption of Digital Technologies; Rise of Big Data and Advanced Analytics.
6. What are the notable trends driving market growth?
Rise in Non-life Insurance Fueling the APAC Insurtech Market.
7. Are there any restraints impacting market growth?
Increasing Adoption of Digital Technologies; Rise of Big Data and Advanced Analytics.
8. Can you provide examples of recent developments in the market?
May 2024: MyGate, a housing society management app, entered the insurance distribution business. It obtained an aggregator license from the Insurance Regulatory and Development Authority of India (IRDAI) to distribute insurance policies.March 2023: BlackRock and Citi formed a technological partnership with insurer Singlife. Clients will have access to full portfolio management capabilities through integration with BlackRock Aladdin and Citi, which will increase productivity, automate controls, and facilitate a smooth front-to-back experience.
9. What pricing options are available for accessing the report?
Pricing options include single-user, multi-user, and enterprise licenses priced at USD 4750, USD 4950, and USD 6800 respectively.
10. Is the market size provided in terms of value or volume?
The market size is provided in terms of value, measured in Million and volume, measured in Billion.
11. Are there any specific market keywords associated with the report?
Yes, the market keyword associated with the report is "APAC Insurtech Market," which aids in identifying and referencing the specific market segment covered.
12. How do I determine which pricing option suits my needs best?
The pricing options vary based on user requirements and access needs. Individual users may opt for single-user licenses, while businesses requiring broader access may choose multi-user or enterprise licenses for cost-effective access to the report.
13. Are there any additional resources or data provided in the APAC Insurtech Market report?
While the report offers comprehensive insights, it's advisable to review the specific contents or supplementary materials provided to ascertain if additional resources or data are available.
14. How can I stay updated on further developments or reports in the APAC Insurtech Market?
To stay informed about further developments, trends, and reports in the APAC Insurtech Market, consider subscribing to industry newsletters, following relevant companies and organizations, or regularly checking reputable industry news sources and publications.
Methodology
Step 1 - Identification of Relevant Samples Size from Population Database


Step 2 - Approaches for Defining Global Market Size (Value, Volume* & Price*)

Note*: In applicable scenarios
Step 3 - Data Sources
Primary Research
- Web Analytics
- Survey Reports
- Research Institute
- Latest Research Reports
- Opinion Leaders
Secondary Research
- Annual Reports
- White Paper
- Latest Press Release
- Industry Association
- Paid Database
- Investor Presentations

Step 4 - Data Triangulation
Involves using different sources of information in order to increase the validity of a study
These sources are likely to be stakeholders in a program - participants, other researchers, program staff, other community members, and so on.
Then we put all data in single framework & apply various statistical tools to find out the dynamic on the market.
During the analysis stage, feedback from the stakeholder groups would be compared to determine areas of agreement as well as areas of divergence