
Key Insights
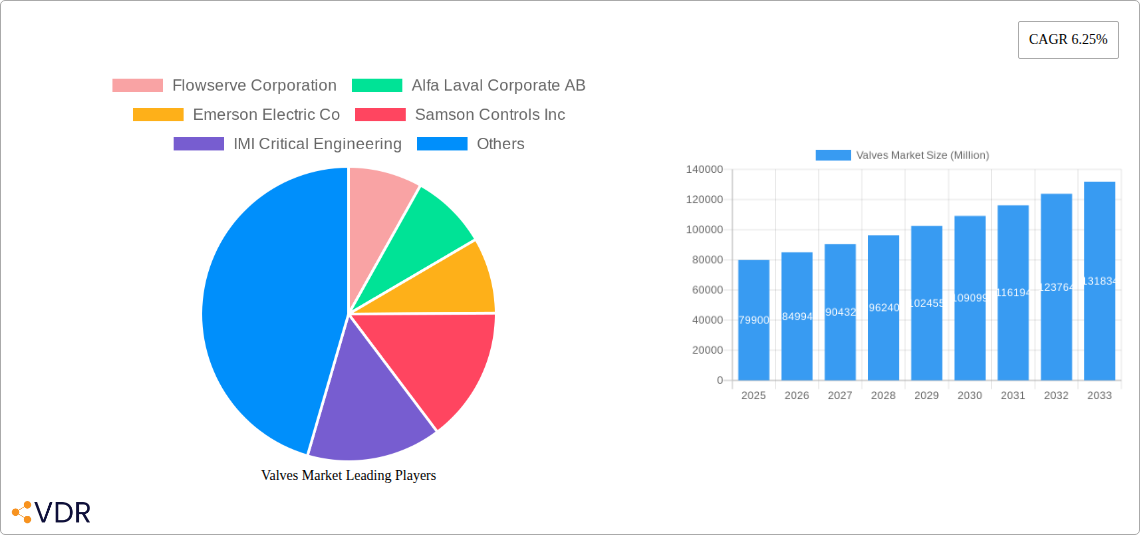
The global valves market, currently valued at $79.90 billion (2025), is projected to experience robust growth, exhibiting a compound annual growth rate (CAGR) of 6.25% from 2025 to 2033. This expansion is driven by several key factors. Firstly, the burgeoning energy sector, particularly in oil and gas and power generation, necessitates advanced valve technologies for efficient and safe operations. Increased investments in infrastructure projects globally, including water and wastewater treatment facilities and mining operations, further fuel demand. Technological advancements, such as the adoption of smart valves with improved monitoring and control capabilities, contribute significantly to market growth. Furthermore, stringent environmental regulations, promoting energy efficiency and reducing emissions, are pushing the adoption of high-performance valves across various industries. The market is segmented by valve type (ball, butterfly, gate/globe/check, plug, control, and others) and end-user vertical (oil and gas, power generation, chemical, water and wastewater, mining, and others). Each segment demonstrates unique growth trajectories, influenced by specific technological trends and industry-specific regulations. For instance, the demand for automated control valves is escalating rapidly in process industries, while the oil and gas sector continues to be a major consumer of high-pressure valves. Geographical distribution reveals significant market presence across North America, Europe, and Asia Pacific, with China and the United States leading as major consumers. However, emerging economies in Asia and South America are showing considerable growth potential, driven by industrialization and infrastructure development.
The competitive landscape is characterized by the presence of both established players and specialized niche manufacturers. Leading companies such as Flowserve Corporation, Alfa Laval, Emerson Electric, and Rotork plc are constantly innovating and expanding their product portfolios to cater to evolving market demands. Strategic mergers, acquisitions, and technological collaborations are further shaping the competitive dynamics. While factors such as raw material price fluctuations and economic downturns present potential restraints, the overall market outlook remains positive, driven by the long-term growth prospects of its core end-user sectors and continuous technological advancements. The forecast period from 2025 to 2033 anticipates significant market expansion across all segments and regions, driven by the trends mentioned above. The market is poised for continued growth driven by industrial automation, digitalization, and an increasing focus on operational efficiency.
Valves Market: A Comprehensive Report (2019-2033)
This in-depth report provides a comprehensive analysis of the global Valves Market, encompassing market dynamics, growth trends, regional dominance, product landscape, key challenges and opportunities, and a detailed competitive overview. The study period spans from 2019 to 2033, with 2025 serving as the base and estimated year. This report is an essential resource for industry professionals, investors, and strategic decision-makers seeking actionable insights into this crucial sector. The parent market is Industrial Automation and the child market is Industrial Valves.
Valves Market Dynamics & Structure
The global Valves Market, valued at xx Million units in 2024, exhibits a moderately concentrated structure with key players holding significant market share. Technological innovation, particularly in smart valves and automation technologies, is a primary growth driver. Stringent regulatory frameworks concerning safety and environmental compliance also shape market dynamics. Competitive pressure stems from the availability of substitute materials and the emergence of new entrants. End-user demographics, characterized by increasing demand from the oil & gas and power generation sectors, significantly influence market growth. M&A activities within the sector have been relatively frequent, with approximately xx deals recorded between 2019 and 2024, primarily aimed at expanding product portfolios and market reach.
- Market Concentration: Moderately concentrated, with top 10 players holding xx% market share in 2024.
- Technological Innovation: Smart valves, automation, and advanced materials are key drivers.
- Regulatory Landscape: Stringent safety and environmental regulations influence design and adoption.
- Competitive Substitutes: Presence of alternative flow control solutions creates competitive pressure.
- End-User Demographics: Oil & gas, power generation, and chemical sectors are major consumers.
- M&A Activity: Approximately xx M&A deals occurred between 2019 and 2024.
Valves Market Growth Trends & Insights
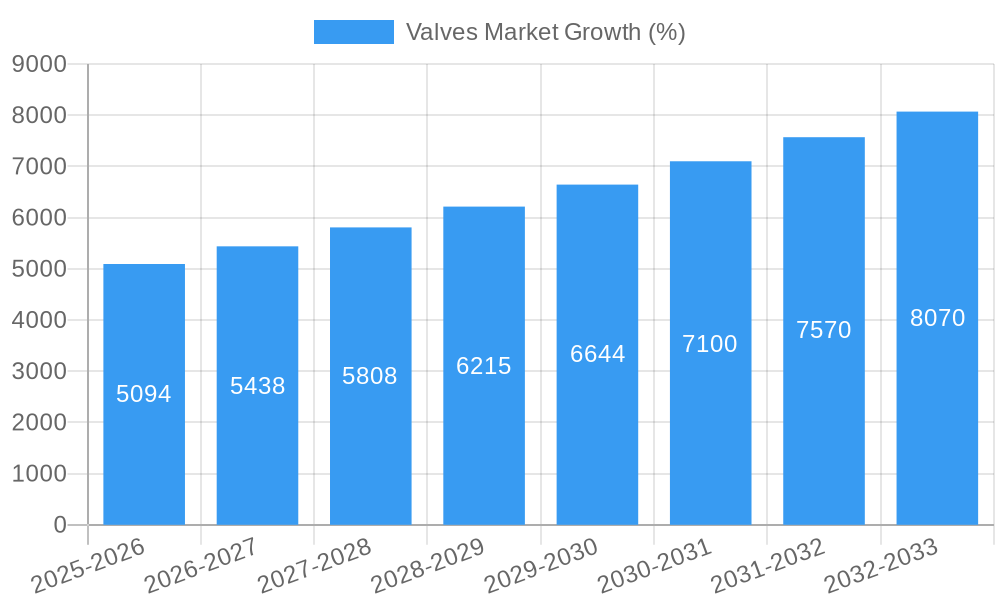
The global Valves Market has witnessed consistent growth over the historical period (2019-2024), expanding at a CAGR of xx%. This growth is attributed to several factors, including rising industrialization, increasing infrastructure development, and growing demand across diverse end-user verticals. Technological disruptions, such as the adoption of smart valves and remote monitoring systems, have significantly enhanced efficiency and reduced operational costs, further fueling market expansion. Shifting consumer behavior, with a preference for energy-efficient and sustainable solutions, is also driving the demand for advanced valve technologies. The market is projected to maintain a robust growth trajectory during the forecast period (2025-2033), with a projected CAGR of xx%, reaching a value of xx Million units by 2033. Market penetration of smart valves is expected to increase from xx% in 2024 to xx% by 2033.
Dominant Regions, Countries, or Segments in Valves Market
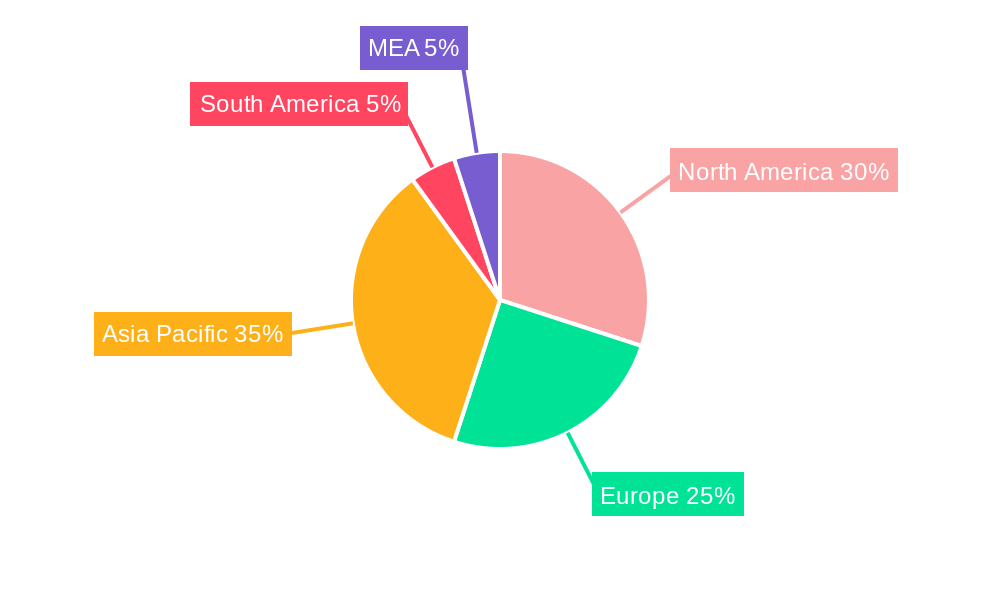
North America currently holds the largest market share, driven by robust industrial activity and substantial investments in infrastructure development. Within the segments, the Ball valve segment exhibits the highest growth potential due to its wide range of applications and cost-effectiveness. The Oil and Gas end-user vertical continues to dominate, fueled by ongoing exploration and production activities globally. Asia-Pacific is projected to experience significant growth in the forecast period, driven by rapid industrialization and urbanization, particularly in China and India. Europe maintains a strong market presence due to the established industrial base and stringent environmental regulations.
- North America: Largest market share, driven by industrial activity and infrastructure investments.
- Asia-Pacific: High growth potential due to industrialization and urbanization (China & India).
- Europe: Strong market presence due to established industrial base and environmental regulations.
- Ball Valves: Highest growth potential due to wide applications and cost-effectiveness.
- Oil & Gas: Dominant end-user vertical due to ongoing exploration and production activities.
Valves Market Product Landscape
The Valves Market encompasses a wide array of products, ranging from basic ball and butterfly valves to highly sophisticated control and specialty valves. Continuous innovation focuses on improving performance metrics such as flow control accuracy, durability, and energy efficiency. Smart valves, incorporating advanced sensors and automation capabilities, are gaining significant traction, offering enhanced monitoring and remote control features. Unique selling propositions include enhanced corrosion resistance, reduced maintenance requirements, and improved safety features.
Key Drivers, Barriers & Challenges in Valves Market
Key Drivers: The market is propelled by the expanding industrial sector, increasing infrastructure development, and growing demand for energy-efficient solutions. Government initiatives promoting sustainable technologies and investments in renewable energy projects also contribute to market growth.
Key Barriers & Challenges: Supply chain disruptions, particularly concerning raw material availability and logistics, pose a significant challenge. Stricter environmental regulations and safety standards can increase manufacturing costs and hinder market expansion. Intense competition from established and emerging players also limits growth for individual firms. The impact of supply chain issues is estimated to have reduced market growth by approximately xx% in 2022.
Emerging Opportunities in Valves Market
Untapped markets in developing economies present significant growth opportunities. The increasing adoption of smart technologies in industrial automation opens avenues for innovative applications and improved operational efficiency. Furthermore, evolving consumer preferences for sustainable and energy-efficient solutions drive the demand for eco-friendly valve designs.
Growth Accelerators in the Valves Market Industry
Technological advancements, particularly in materials science and automation, will continue to drive market growth. Strategic partnerships and collaborations between valve manufacturers and technology providers will accelerate innovation and market penetration. Expansion into new geographic markets and diversification into emerging applications will also fuel long-term growth.
Key Players Shaping the Valves Market Market
- Flowserve Corporation
- Alfa Laval Corporate AB
- Emerson Electric Co
- Samson Controls Inc
- IMI Critical Engineering
- Crane Co
- Rotork plc
- Schlumberger Limited
- Spirax Sarco Limited
- KITZ Corporation
Notable Milestones in Valves Market Sector
- 2021: Introduction of a new line of smart valves by Emerson Electric Co.
- 2022: Flowserve Corporation acquires a smaller valve manufacturer, expanding its product portfolio.
- 2023: IMI Critical Engineering launches a new range of energy-efficient valves.
- 2024: Alfa Laval Corporate AB invests in R&D for advanced materials in valve production.
In-Depth Valves Market Market Outlook
The Valves Market is poised for sustained growth over the forecast period, driven by ongoing technological advancements, increasing demand from key end-user verticals, and expansion into emerging markets. Strategic partnerships, focused investments in R&D, and the development of innovative valve technologies will further enhance market potential. Companies that prioritize sustainability and energy efficiency in their product offerings are expected to gain a competitive edge. The market's long-term outlook is optimistic, with ample opportunities for growth and innovation.
Valves Market Segmentation
-
1. Type
- 1.1. Ball
- 1.2. Butterfly
- 1.3. Gate/Globe/Check
- 1.4. Plug
- 1.5. Control
- 1.6. Other Types
-
2. End-User Vertical
- 2.1. Oil and Gas
- 2.2. Power Generation
- 2.3. Chemical
- 2.4. Water and Wastewater
- 2.5. Mining
- 2.6. Other End User Verticals
Valves Market Segmentation By Geography
- 1. North America
- 2. Europe
- 3. Asia Pacific
- 4. Latin America
- 5. Middle East and Africa
Valves Market REPORT HIGHLIGHTS
| Aspects | Details |
|---|---|
| Study Period | 2019-2033 |
| Base Year | 2024 |
| Estimated Year | 2025 |
| Forecast Period | 2025-2033 |
| Historical Period | 2019-2024 |
| Growth Rate | CAGR of 6.25% from 2019-2033 |
| Segmentation |
|
Table of Contents
- 1. Introduction
- 1.1. Research Scope
- 1.2. Market Segmentation
- 1.3. Research Methodology
- 1.4. Definitions and Assumptions
- 2. Executive Summary
- 2.1. Introduction
- 3. Market Dynamics
- 3.1. Introduction
- 3.2. Market Drivers
- 3.2.1. Rise in Infrastructure-Related Developments; Adoption of Emerging Technologies
- 3.3. Market Restrains
- 3.3.1. ; High Capital Investment and Increasing Use of Fiber Optic Transmission Cables; Regulatory Constraints and Limited Orbital Locations
- 3.4. Market Trends
- 3.4.1. Oil and Gas Vertical Accounts for a Major Market Share
- 4. Market Factor Analysis
- 4.1. Porters Five Forces
- 4.2. Supply/Value Chain
- 4.3. PESTEL analysis
- 4.4. Market Entropy
- 4.5. Patent/Trademark Analysis
- 5. Global Valves Market Analysis, Insights and Forecast, 2019-2031
- 5.1. Market Analysis, Insights and Forecast - by Type
- 5.1.1. Ball
- 5.1.2. Butterfly
- 5.1.3. Gate/Globe/Check
- 5.1.4. Plug
- 5.1.5. Control
- 5.1.6. Other Types
- 5.2. Market Analysis, Insights and Forecast - by End-User Vertical
- 5.2.1. Oil and Gas
- 5.2.2. Power Generation
- 5.2.3. Chemical
- 5.2.4. Water and Wastewater
- 5.2.5. Mining
- 5.2.6. Other End User Verticals
- 5.3. Market Analysis, Insights and Forecast - by Region
- 5.3.1. North America
- 5.3.2. Europe
- 5.3.3. Asia Pacific
- 5.3.4. Latin America
- 5.3.5. Middle East and Africa
- 5.1. Market Analysis, Insights and Forecast - by Type
- 6. North America Valves Market Analysis, Insights and Forecast, 2019-2031
- 6.1. Market Analysis, Insights and Forecast - by Type
- 6.1.1. Ball
- 6.1.2. Butterfly
- 6.1.3. Gate/Globe/Check
- 6.1.4. Plug
- 6.1.5. Control
- 6.1.6. Other Types
- 6.2. Market Analysis, Insights and Forecast - by End-User Vertical
- 6.2.1. Oil and Gas
- 6.2.2. Power Generation
- 6.2.3. Chemical
- 6.2.4. Water and Wastewater
- 6.2.5. Mining
- 6.2.6. Other End User Verticals
- 6.1. Market Analysis, Insights and Forecast - by Type
- 7. Europe Valves Market Analysis, Insights and Forecast, 2019-2031
- 7.1. Market Analysis, Insights and Forecast - by Type
- 7.1.1. Ball
- 7.1.2. Butterfly
- 7.1.3. Gate/Globe/Check
- 7.1.4. Plug
- 7.1.5. Control
- 7.1.6. Other Types
- 7.2. Market Analysis, Insights and Forecast - by End-User Vertical
- 7.2.1. Oil and Gas
- 7.2.2. Power Generation
- 7.2.3. Chemical
- 7.2.4. Water and Wastewater
- 7.2.5. Mining
- 7.2.6. Other End User Verticals
- 7.1. Market Analysis, Insights and Forecast - by Type
- 8. Asia Pacific Valves Market Analysis, Insights and Forecast, 2019-2031
- 8.1. Market Analysis, Insights and Forecast - by Type
- 8.1.1. Ball
- 8.1.2. Butterfly
- 8.1.3. Gate/Globe/Check
- 8.1.4. Plug
- 8.1.5. Control
- 8.1.6. Other Types
- 8.2. Market Analysis, Insights and Forecast - by End-User Vertical
- 8.2.1. Oil and Gas
- 8.2.2. Power Generation
- 8.2.3. Chemical
- 8.2.4. Water and Wastewater
- 8.2.5. Mining
- 8.2.6. Other End User Verticals
- 8.1. Market Analysis, Insights and Forecast - by Type
- 9. Latin America Valves Market Analysis, Insights and Forecast, 2019-2031
- 9.1. Market Analysis, Insights and Forecast - by Type
- 9.1.1. Ball
- 9.1.2. Butterfly
- 9.1.3. Gate/Globe/Check
- 9.1.4. Plug
- 9.1.5. Control
- 9.1.6. Other Types
- 9.2. Market Analysis, Insights and Forecast - by End-User Vertical
- 9.2.1. Oil and Gas
- 9.2.2. Power Generation
- 9.2.3. Chemical
- 9.2.4. Water and Wastewater
- 9.2.5. Mining
- 9.2.6. Other End User Verticals
- 9.1. Market Analysis, Insights and Forecast - by Type
- 10. Middle East and Africa Valves Market Analysis, Insights and Forecast, 2019-2031
- 10.1. Market Analysis, Insights and Forecast - by Type
- 10.1.1. Ball
- 10.1.2. Butterfly
- 10.1.3. Gate/Globe/Check
- 10.1.4. Plug
- 10.1.5. Control
- 10.1.6. Other Types
- 10.2. Market Analysis, Insights and Forecast - by End-User Vertical
- 10.2.1. Oil and Gas
- 10.2.2. Power Generation
- 10.2.3. Chemical
- 10.2.4. Water and Wastewater
- 10.2.5. Mining
- 10.2.6. Other End User Verticals
- 10.1. Market Analysis, Insights and Forecast - by Type
- 11. North America Valves Market Analysis, Insights and Forecast, 2019-2031
- 11.1. Market Analysis, Insights and Forecast - By Country/Sub-region
- 11.1.1 United States
- 11.1.2 Canada
- 11.1.3 Mexico
- 12. Europe Valves Market Analysis, Insights and Forecast, 2019-2031
- 12.1. Market Analysis, Insights and Forecast - By Country/Sub-region
- 12.1.1 Germany
- 12.1.2 United Kingdom
- 12.1.3 France
- 12.1.4 Spain
- 12.1.5 Italy
- 12.1.6 Spain
- 12.1.7 Belgium
- 12.1.8 Netherland
- 12.1.9 Nordics
- 12.1.10 Rest of Europe
- 13. Asia Pacific Valves Market Analysis, Insights and Forecast, 2019-2031
- 13.1. Market Analysis, Insights and Forecast - By Country/Sub-region
- 13.1.1 China
- 13.1.2 Japan
- 13.1.3 India
- 13.1.4 South Korea
- 13.1.5 Southeast Asia
- 13.1.6 Australia
- 13.1.7 Indonesia
- 13.1.8 Phillipes
- 13.1.9 Singapore
- 13.1.10 Thailandc
- 13.1.11 Rest of Asia Pacific
- 14. South America Valves Market Analysis, Insights and Forecast, 2019-2031
- 14.1. Market Analysis, Insights and Forecast - By Country/Sub-region
- 14.1.1 Brazil
- 14.1.2 Argentina
- 14.1.3 Peru
- 14.1.4 Chile
- 14.1.5 Colombia
- 14.1.6 Ecuador
- 14.1.7 Venezuela
- 14.1.8 Rest of South America
- 15. North America Valves Market Analysis, Insights and Forecast, 2019-2031
- 15.1. Market Analysis, Insights and Forecast - By Country/Sub-region
- 15.1.1 United States
- 15.1.2 Canada
- 15.1.3 Mexico
- 16. MEA Valves Market Analysis, Insights and Forecast, 2019-2031
- 16.1. Market Analysis, Insights and Forecast - By Country/Sub-region
- 16.1.1 United Arab Emirates
- 16.1.2 Saudi Arabia
- 16.1.3 South Africa
- 16.1.4 Rest of Middle East and Africa
- 17. Competitive Analysis
- 17.1. Global Market Share Analysis 2024
- 17.2. Company Profiles
- 17.2.1 Flowserve Corporation
- 17.2.1.1. Overview
- 17.2.1.2. Products
- 17.2.1.3. SWOT Analysis
- 17.2.1.4. Recent Developments
- 17.2.1.5. Financials (Based on Availability)
- 17.2.2 Alfa Laval Corporate AB
- 17.2.2.1. Overview
- 17.2.2.2. Products
- 17.2.2.3. SWOT Analysis
- 17.2.2.4. Recent Developments
- 17.2.2.5. Financials (Based on Availability)
- 17.2.3 Emerson Electric Co
- 17.2.3.1. Overview
- 17.2.3.2. Products
- 17.2.3.3. SWOT Analysis
- 17.2.3.4. Recent Developments
- 17.2.3.5. Financials (Based on Availability)
- 17.2.4 Samson Controls Inc
- 17.2.4.1. Overview
- 17.2.4.2. Products
- 17.2.4.3. SWOT Analysis
- 17.2.4.4. Recent Developments
- 17.2.4.5. Financials (Based on Availability)
- 17.2.5 IMI Critical Engineering
- 17.2.5.1. Overview
- 17.2.5.2. Products
- 17.2.5.3. SWOT Analysis
- 17.2.5.4. Recent Developments
- 17.2.5.5. Financials (Based on Availability)
- 17.2.6 Crane Co
- 17.2.6.1. Overview
- 17.2.6.2. Products
- 17.2.6.3. SWOT Analysis
- 17.2.6.4. Recent Developments
- 17.2.6.5. Financials (Based on Availability)
- 17.2.7 Rotork plc
- 17.2.7.1. Overview
- 17.2.7.2. Products
- 17.2.7.3. SWOT Analysis
- 17.2.7.4. Recent Developments
- 17.2.7.5. Financials (Based on Availability)
- 17.2.8 Schlumberger Limited
- 17.2.8.1. Overview
- 17.2.8.2. Products
- 17.2.8.3. SWOT Analysis
- 17.2.8.4. Recent Developments
- 17.2.8.5. Financials (Based on Availability)
- 17.2.9 Spirax Sarco Limited
- 17.2.9.1. Overview
- 17.2.9.2. Products
- 17.2.9.3. SWOT Analysis
- 17.2.9.4. Recent Developments
- 17.2.9.5. Financials (Based on Availability)
- 17.2.10 KITZ Corporation
- 17.2.10.1. Overview
- 17.2.10.2. Products
- 17.2.10.3. SWOT Analysis
- 17.2.10.4. Recent Developments
- 17.2.10.5. Financials (Based on Availability)
- 17.2.1 Flowserve Corporation
List of Figures
- Figure 1: Global Valves Market Revenue Breakdown (Million, %) by Region 2024 & 2032
- Figure 2: North America Valves Market Revenue (Million), by Country 2024 & 2032
- Figure 3: North America Valves Market Revenue Share (%), by Country 2024 & 2032
- Figure 4: Europe Valves Market Revenue (Million), by Country 2024 & 2032
- Figure 5: Europe Valves Market Revenue Share (%), by Country 2024 & 2032
- Figure 6: Asia Pacific Valves Market Revenue (Million), by Country 2024 & 2032
- Figure 7: Asia Pacific Valves Market Revenue Share (%), by Country 2024 & 2032
- Figure 8: South America Valves Market Revenue (Million), by Country 2024 & 2032
- Figure 9: South America Valves Market Revenue Share (%), by Country 2024 & 2032
- Figure 10: North America Valves Market Revenue (Million), by Country 2024 & 2032
- Figure 11: North America Valves Market Revenue Share (%), by Country 2024 & 2032
- Figure 12: MEA Valves Market Revenue (Million), by Country 2024 & 2032
- Figure 13: MEA Valves Market Revenue Share (%), by Country 2024 & 2032
- Figure 14: North America Valves Market Revenue (Million), by Type 2024 & 2032
- Figure 15: North America Valves Market Revenue Share (%), by Type 2024 & 2032
- Figure 16: North America Valves Market Revenue (Million), by End-User Vertical 2024 & 2032
- Figure 17: North America Valves Market Revenue Share (%), by End-User Vertical 2024 & 2032
- Figure 18: North America Valves Market Revenue (Million), by Country 2024 & 2032
- Figure 19: North America Valves Market Revenue Share (%), by Country 2024 & 2032
- Figure 20: Europe Valves Market Revenue (Million), by Type 2024 & 2032
- Figure 21: Europe Valves Market Revenue Share (%), by Type 2024 & 2032
- Figure 22: Europe Valves Market Revenue (Million), by End-User Vertical 2024 & 2032
- Figure 23: Europe Valves Market Revenue Share (%), by End-User Vertical 2024 & 2032
- Figure 24: Europe Valves Market Revenue (Million), by Country 2024 & 2032
- Figure 25: Europe Valves Market Revenue Share (%), by Country 2024 & 2032
- Figure 26: Asia Pacific Valves Market Revenue (Million), by Type 2024 & 2032
- Figure 27: Asia Pacific Valves Market Revenue Share (%), by Type 2024 & 2032
- Figure 28: Asia Pacific Valves Market Revenue (Million), by End-User Vertical 2024 & 2032
- Figure 29: Asia Pacific Valves Market Revenue Share (%), by End-User Vertical 2024 & 2032
- Figure 30: Asia Pacific Valves Market Revenue (Million), by Country 2024 & 2032
- Figure 31: Asia Pacific Valves Market Revenue Share (%), by Country 2024 & 2032
- Figure 32: Latin America Valves Market Revenue (Million), by Type 2024 & 2032
- Figure 33: Latin America Valves Market Revenue Share (%), by Type 2024 & 2032
- Figure 34: Latin America Valves Market Revenue (Million), by End-User Vertical 2024 & 2032
- Figure 35: Latin America Valves Market Revenue Share (%), by End-User Vertical 2024 & 2032
- Figure 36: Latin America Valves Market Revenue (Million), by Country 2024 & 2032
- Figure 37: Latin America Valves Market Revenue Share (%), by Country 2024 & 2032
- Figure 38: Middle East and Africa Valves Market Revenue (Million), by Type 2024 & 2032
- Figure 39: Middle East and Africa Valves Market Revenue Share (%), by Type 2024 & 2032
- Figure 40: Middle East and Africa Valves Market Revenue (Million), by End-User Vertical 2024 & 2032
- Figure 41: Middle East and Africa Valves Market Revenue Share (%), by End-User Vertical 2024 & 2032
- Figure 42: Middle East and Africa Valves Market Revenue (Million), by Country 2024 & 2032
- Figure 43: Middle East and Africa Valves Market Revenue Share (%), by Country 2024 & 2032
List of Tables
- Table 1: Global Valves Market Revenue Million Forecast, by Region 2019 & 2032
- Table 2: Global Valves Market Revenue Million Forecast, by Type 2019 & 2032
- Table 3: Global Valves Market Revenue Million Forecast, by End-User Vertical 2019 & 2032
- Table 4: Global Valves Market Revenue Million Forecast, by Region 2019 & 2032
- Table 5: Global Valves Market Revenue Million Forecast, by Country 2019 & 2032
- Table 6: United States Valves Market Revenue (Million) Forecast, by Application 2019 & 2032
- Table 7: Canada Valves Market Revenue (Million) Forecast, by Application 2019 & 2032
- Table 8: Mexico Valves Market Revenue (Million) Forecast, by Application 2019 & 2032
- Table 9: Global Valves Market Revenue Million Forecast, by Country 2019 & 2032
- Table 10: Germany Valves Market Revenue (Million) Forecast, by Application 2019 & 2032
- Table 11: United Kingdom Valves Market Revenue (Million) Forecast, by Application 2019 & 2032
- Table 12: France Valves Market Revenue (Million) Forecast, by Application 2019 & 2032
- Table 13: Spain Valves Market Revenue (Million) Forecast, by Application 2019 & 2032
- Table 14: Italy Valves Market Revenue (Million) Forecast, by Application 2019 & 2032
- Table 15: Spain Valves Market Revenue (Million) Forecast, by Application 2019 & 2032
- Table 16: Belgium Valves Market Revenue (Million) Forecast, by Application 2019 & 2032
- Table 17: Netherland Valves Market Revenue (Million) Forecast, by Application 2019 & 2032
- Table 18: Nordics Valves Market Revenue (Million) Forecast, by Application 2019 & 2032
- Table 19: Rest of Europe Valves Market Revenue (Million) Forecast, by Application 2019 & 2032
- Table 20: Global Valves Market Revenue Million Forecast, by Country 2019 & 2032
- Table 21: China Valves Market Revenue (Million) Forecast, by Application 2019 & 2032
- Table 22: Japan Valves Market Revenue (Million) Forecast, by Application 2019 & 2032
- Table 23: India Valves Market Revenue (Million) Forecast, by Application 2019 & 2032
- Table 24: South Korea Valves Market Revenue (Million) Forecast, by Application 2019 & 2032
- Table 25: Southeast Asia Valves Market Revenue (Million) Forecast, by Application 2019 & 2032
- Table 26: Australia Valves Market Revenue (Million) Forecast, by Application 2019 & 2032
- Table 27: Indonesia Valves Market Revenue (Million) Forecast, by Application 2019 & 2032
- Table 28: Phillipes Valves Market Revenue (Million) Forecast, by Application 2019 & 2032
- Table 29: Singapore Valves Market Revenue (Million) Forecast, by Application 2019 & 2032
- Table 30: Thailandc Valves Market Revenue (Million) Forecast, by Application 2019 & 2032
- Table 31: Rest of Asia Pacific Valves Market Revenue (Million) Forecast, by Application 2019 & 2032
- Table 32: Global Valves Market Revenue Million Forecast, by Country 2019 & 2032
- Table 33: Brazil Valves Market Revenue (Million) Forecast, by Application 2019 & 2032
- Table 34: Argentina Valves Market Revenue (Million) Forecast, by Application 2019 & 2032
- Table 35: Peru Valves Market Revenue (Million) Forecast, by Application 2019 & 2032
- Table 36: Chile Valves Market Revenue (Million) Forecast, by Application 2019 & 2032
- Table 37: Colombia Valves Market Revenue (Million) Forecast, by Application 2019 & 2032
- Table 38: Ecuador Valves Market Revenue (Million) Forecast, by Application 2019 & 2032
- Table 39: Venezuela Valves Market Revenue (Million) Forecast, by Application 2019 & 2032
- Table 40: Rest of South America Valves Market Revenue (Million) Forecast, by Application 2019 & 2032
- Table 41: Global Valves Market Revenue Million Forecast, by Country 2019 & 2032
- Table 42: United States Valves Market Revenue (Million) Forecast, by Application 2019 & 2032
- Table 43: Canada Valves Market Revenue (Million) Forecast, by Application 2019 & 2032
- Table 44: Mexico Valves Market Revenue (Million) Forecast, by Application 2019 & 2032
- Table 45: Global Valves Market Revenue Million Forecast, by Country 2019 & 2032
- Table 46: United Arab Emirates Valves Market Revenue (Million) Forecast, by Application 2019 & 2032
- Table 47: Saudi Arabia Valves Market Revenue (Million) Forecast, by Application 2019 & 2032
- Table 48: South Africa Valves Market Revenue (Million) Forecast, by Application 2019 & 2032
- Table 49: Rest of Middle East and Africa Valves Market Revenue (Million) Forecast, by Application 2019 & 2032
- Table 50: Global Valves Market Revenue Million Forecast, by Type 2019 & 2032
- Table 51: Global Valves Market Revenue Million Forecast, by End-User Vertical 2019 & 2032
- Table 52: Global Valves Market Revenue Million Forecast, by Country 2019 & 2032
- Table 53: Global Valves Market Revenue Million Forecast, by Type 2019 & 2032
- Table 54: Global Valves Market Revenue Million Forecast, by End-User Vertical 2019 & 2032
- Table 55: Global Valves Market Revenue Million Forecast, by Country 2019 & 2032
- Table 56: Global Valves Market Revenue Million Forecast, by Type 2019 & 2032
- Table 57: Global Valves Market Revenue Million Forecast, by End-User Vertical 2019 & 2032
- Table 58: Global Valves Market Revenue Million Forecast, by Country 2019 & 2032
- Table 59: Global Valves Market Revenue Million Forecast, by Type 2019 & 2032
- Table 60: Global Valves Market Revenue Million Forecast, by End-User Vertical 2019 & 2032
- Table 61: Global Valves Market Revenue Million Forecast, by Country 2019 & 2032
- Table 62: Global Valves Market Revenue Million Forecast, by Type 2019 & 2032
- Table 63: Global Valves Market Revenue Million Forecast, by End-User Vertical 2019 & 2032
- Table 64: Global Valves Market Revenue Million Forecast, by Country 2019 & 2032
Frequently Asked Questions
1. What is the projected Compound Annual Growth Rate (CAGR) of the Valves Market?
The projected CAGR is approximately 6.25%.
2. Which companies are prominent players in the Valves Market?
Key companies in the market include Flowserve Corporation, Alfa Laval Corporate AB, Emerson Electric Co, Samson Controls Inc, IMI Critical Engineering, Crane Co, Rotork plc, Schlumberger Limited, Spirax Sarco Limited, KITZ Corporation.
3. What are the main segments of the Valves Market?
The market segments include Type, End-User Vertical.
4. Can you provide details about the market size?
The market size is estimated to be USD 79.90 Million as of 2022.
5. What are some drivers contributing to market growth?
Rise in Infrastructure-Related Developments; Adoption of Emerging Technologies.
6. What are the notable trends driving market growth?
Oil and Gas Vertical Accounts for a Major Market Share.
7. Are there any restraints impacting market growth?
; High Capital Investment and Increasing Use of Fiber Optic Transmission Cables; Regulatory Constraints and Limited Orbital Locations.
8. Can you provide examples of recent developments in the market?
N/A
9. What pricing options are available for accessing the report?
Pricing options include single-user, multi-user, and enterprise licenses priced at USD 4750, USD 5250, and USD 8750 respectively.
10. Is the market size provided in terms of value or volume?
The market size is provided in terms of value, measured in Million.
11. Are there any specific market keywords associated with the report?
Yes, the market keyword associated with the report is "Valves Market," which aids in identifying and referencing the specific market segment covered.
12. How do I determine which pricing option suits my needs best?
The pricing options vary based on user requirements and access needs. Individual users may opt for single-user licenses, while businesses requiring broader access may choose multi-user or enterprise licenses for cost-effective access to the report.
13. Are there any additional resources or data provided in the Valves Market report?
While the report offers comprehensive insights, it's advisable to review the specific contents or supplementary materials provided to ascertain if additional resources or data are available.
14. How can I stay updated on further developments or reports in the Valves Market?
To stay informed about further developments, trends, and reports in the Valves Market, consider subscribing to industry newsletters, following relevant companies and organizations, or regularly checking reputable industry news sources and publications.
Methodology
Step 1 - Identification of Relevant Samples Size from Population Database


Step 2 - Approaches for Defining Global Market Size (Value, Volume* & Price*)

Note*: In applicable scenarios
Step 3 - Data Sources
Primary Research
- Web Analytics
- Survey Reports
- Research Institute
- Latest Research Reports
- Opinion Leaders
Secondary Research
- Annual Reports
- White Paper
- Latest Press Release
- Industry Association
- Paid Database
- Investor Presentations

Step 4 - Data Triangulation
Involves using different sources of information in order to increase the validity of a study
These sources are likely to be stakeholders in a program - participants, other researchers, program staff, other community members, and so on.
Then we put all data in single framework & apply various statistical tools to find out the dynamic on the market.
During the analysis stage, feedback from the stakeholder groups would be compared to determine areas of agreement as well as areas of divergence


