
Key Insights
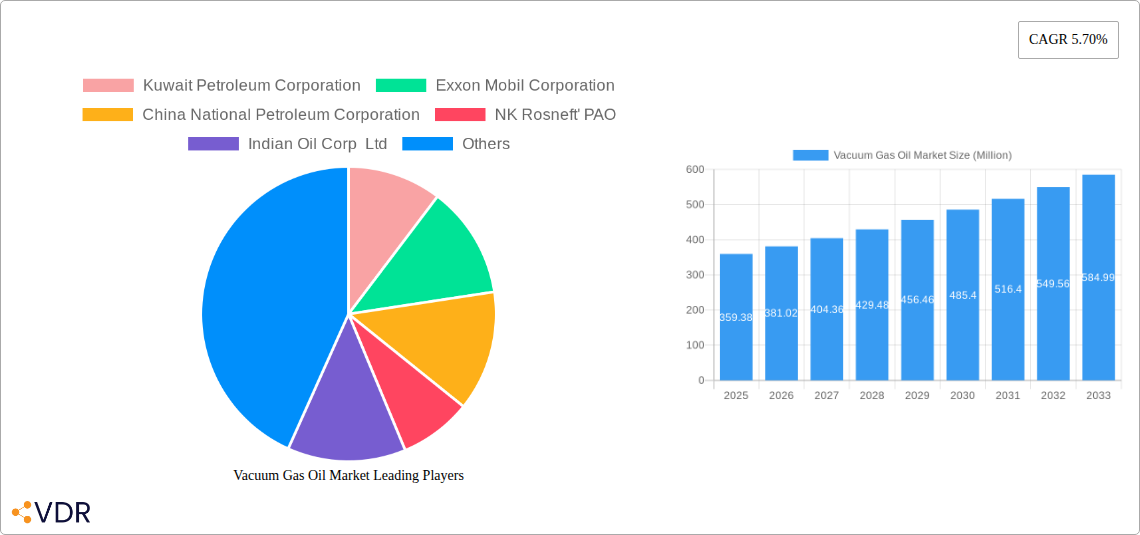
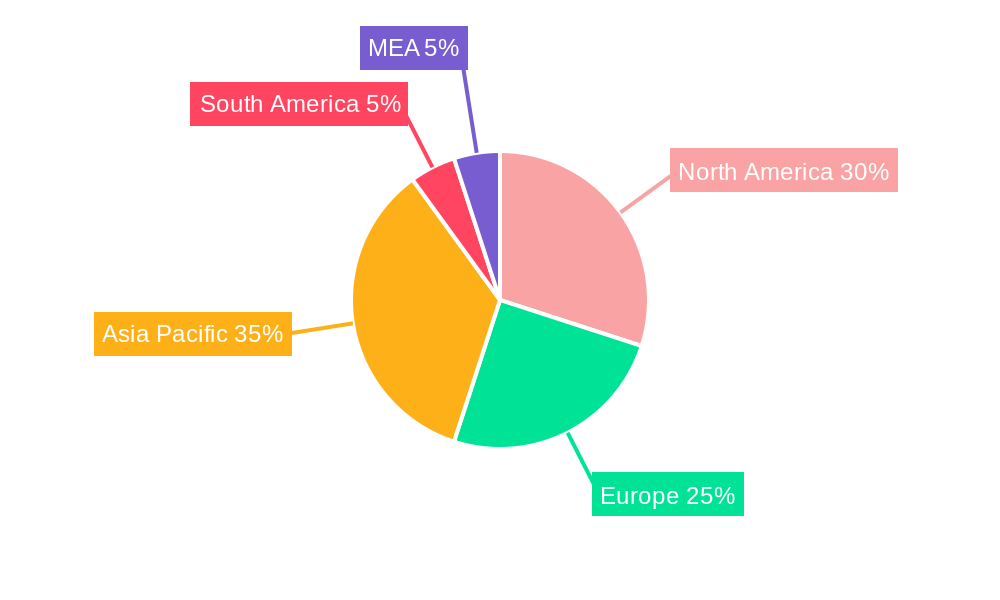
The Vacuum Gas Oil (VGO) market, valued at $359.38 million in 2025, is projected to experience robust growth, driven by increasing demand for gasoline and diesel fuel production. A compound annual growth rate (CAGR) of 5.70% from 2025 to 2033 indicates a significant expansion of the market during the forecast period. This growth is fueled by several key factors. The rising global population and associated increase in vehicle ownership are directly contributing to higher fuel consumption, creating a sustained demand for VGO as a crucial feedstock in refining processes. Furthermore, ongoing investments in refinery infrastructure, particularly in emerging economies experiencing rapid industrialization, are bolstering the market. The market segmentation reveals a strong preference for light vacuum gas oil due to its suitability for producing higher-value gasoline products, while the heavy vacuum gas oil segment is expected to witness steady growth, driven by the consistent demand for diesel fuel. Geographically, North America and Asia Pacific are anticipated to dominate the market due to their established refining capabilities and substantial energy consumption. However, developing regions in South America and the Middle East and Africa are projected to exhibit faster growth rates, fueled by increasing infrastructure development and industrial activities.
Competitive dynamics are shaped by the presence of major integrated oil and gas companies, including Kuwait Petroleum Corporation, ExxonMobil Corporation, and China National Petroleum Corporation, amongst others. These established players leverage their extensive downstream operations and global networks to maintain their market dominance. However, the market also provides opportunities for smaller players specializing in specific segments or geographic regions. The increasing focus on reducing sulfur content in VGO to meet stricter environmental regulations presents both a challenge and an opportunity, stimulating innovation and investment in advanced refining technologies. The interplay between these factors shapes the market's evolution, presenting strategic opportunities for both established players and emerging competitors to capitalize on the long-term growth trajectory of the VGO market.
Vacuum Gas Oil Market: A Comprehensive Market Report (2019-2033)
This comprehensive report provides an in-depth analysis of the Vacuum Gas Oil (VGO) market, encompassing market dynamics, growth trends, regional dominance, product landscape, key players, and future outlook. The report covers the parent market of petroleum products and the child market of vacuum gas oil, offering a granular view of this crucial segment within the energy industry. The study period spans from 2019 to 2033, with 2025 serving as the base and estimated year. The report projects a market size of xx Million units by 2033.
Vacuum Gas Oil Market Dynamics & Structure
The Vacuum Gas Oil market exhibits a moderately concentrated structure with key players like Kuwait Petroleum Corporation, Exxon Mobil Corporation, China National Petroleum Corporation, NK Rosneft' PAO, Indian Oil Corp Ltd, Chevron Corporation, Eni SpA, BP PLC, and Shell Plc holding significant market share. The market is characterized by ongoing technological innovations in refining processes aimed at maximizing VGO yield and minimizing sulfur content. Stringent environmental regulations globally are driving the demand for low-sulfur VGO, impacting the market dynamics significantly. Competitive product substitutes, though limited, include other refinery streams, while M&A activities within the energy sector influence market consolidation and expansion.
- Market Concentration: Moderately concentrated, with top 10 players accounting for approximately xx% of the market share in 2025.
- Technological Innovation: Focus on improving refining efficiency, sulfur removal technologies, and maximizing valuable product yields.
- Regulatory Framework: Stringent environmental regulations driving demand for low-sulfur VGO, impacting production and pricing.
- Competitive Substitutes: Limited, primarily other refinery streams with varying qualities.
- End-User Demographics: Primarily refiners and petrochemical companies globally, with regional variations based on refining capacity and demand for downstream products.
- M&A Trends: Moderate M&A activity, primarily focused on consolidation and expanding downstream operations. An estimated xx M&A deals occurred between 2019-2024.
Vacuum Gas Oil Market Growth Trends & Insights
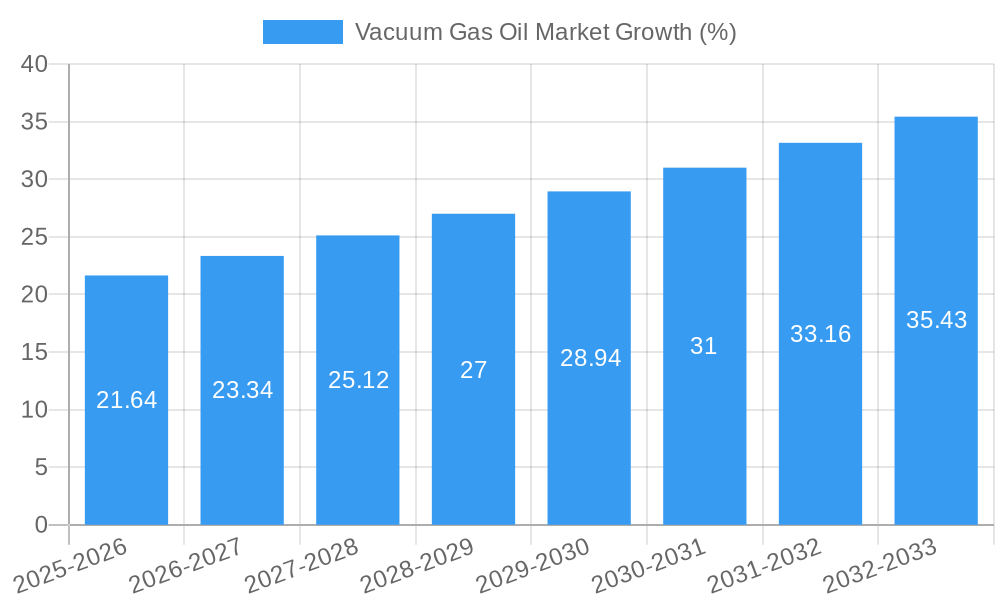
The VGO market experienced robust growth between 2019 and 2024, driven by rising global energy demand and expanding refining capacity. The market is expected to continue its growth trajectory, albeit at a moderated pace, during the forecast period (2025-2033). Technological advancements, such as the adoption of hydrocracking and hydro treating technologies, improve the quality and yield of VGO, contributing to market expansion. Changes in consumer behavior, particularly in developing economies, with increasing demand for transportation fuels, have a positive impact on the market. The CAGR for the period 2025-2033 is projected to be xx%. Market penetration within the refining sector is expected to reach xx% by 2033. Geopolitical factors and fluctuations in crude oil prices remain significant influencing factors.
Dominant Regions, Countries, or Segments in Vacuum Gas Oil Market
Asia-Pacific, particularly China and India, are projected to dominate the VGO market during the forecast period, driven by rapid industrialization and increasing demand for transportation fuels. High sulfur content VGO segment is currently larger but the low sulfur content segment is expected to grow faster due to environmental regulations. Within product types, heavy VGO holds a larger market share than light VGO due to its wider application in various refining processes. The gasoline production application segment currently dominates, but the diesel oil production segment is anticipated to witness substantial growth, driven by the rising demand for diesel fuel globally.
- Key Drivers for Asia-Pacific dominance: Rapid industrialization, rising energy consumption, expanding refining capacity, and favorable government policies.
- High Sulfur Content VGO: Larger market share currently, but growth may slow due to environmental regulations.
- Low Sulfur Content VGO: Smaller market share but anticipated faster growth due to environmental regulations and stricter emission standards.
- Heavy Vacuum Gas Oil: Larger market share due to broader applications in refining processes.
- Light Vacuum Gas Oil: Smaller market share than heavy VGO.
- Gasoline Production: Largest application segment.
- Diesel Oil Production: Expected to experience significant growth.
Vacuum Gas Oil Market Product Landscape
Vacuum Gas Oil is categorized primarily by its sulfur content (low and high) and physical properties (light and heavy). Recent innovations focus on improving the efficiency of sulfur removal technologies, enabling the production of ultra-low sulfur VGO that meets increasingly stringent environmental standards. Technological advancements are geared toward enhancing the yield of valuable products from VGO through optimization of refining processes. Unique selling propositions center on the purity and consistency of the VGO offered, ensuring optimal performance in downstream refining applications.
Key Drivers, Barriers & Challenges in Vacuum Gas Oil Market
Key Drivers: Rising global energy demand, increasing refining capacity, particularly in developing economies, stringent environmental regulations promoting low-sulfur VGO, and technological advancements leading to increased VGO yield.
Challenges and Restraints: Fluctuations in crude oil prices, geopolitical instability impacting supply chains, stringent environmental regulations imposing compliance costs, and intense competition among refiners. The impact of these factors on profitability can be significant, with an estimated xx% impact on profit margins due to price fluctuations in 2024.
Emerging Opportunities in Vacuum Gas Oil Market
Emerging markets in Africa and Latin America present significant opportunities for VGO market expansion, driven by rapid industrial growth and infrastructural development. The growing demand for cleaner fuels is creating opportunities for the production and utilization of low-sulfur VGO. Innovative applications of VGO in petrochemical industries, beyond traditional fuel production, are also emerging as significant growth avenues.
Growth Accelerators in the Vacuum Gas Oil Market Industry
Technological breakthroughs in refining technologies, such as advanced hydrocracking and hydro-treating processes, are key growth accelerators, improving VGO yield and quality. Strategic partnerships between refiners and petrochemical companies can accelerate market penetration and the development of new applications. Expansion of refining capacity, particularly in regions with high growth potential, further boosts market growth.
Key Players Shaping the Vacuum Gas Oil Market Market
- Kuwait Petroleum Corporation
- Exxon Mobil Corporation
- China National Petroleum Corporation
- NK Rosneft' PAO
- Indian Oil Corp Ltd
- Chevron Corporation
- Eni SpA
- BP PLC
- Shell Plc *List Not Exhaustive
Notable Milestones in Vacuum Gas Oil Market Sector
- August 2023: India significantly increases imports of high-sulfur fuel oil and vacuum gas oil from Russia, doubling to approximately 269,000 barrels per day. This demonstrates the impact of geopolitical factors and refinery maintenance on market dynamics.
- August 2022: Toyo Engineering India Private Limited secures a contract from Indian Oil Corporation Limited for the construction of a 3.6 MMTPA Vacuum Gas Oil Hydrotreater Unit in Panipat, India. This signifies investments in refining capacity expansion and upgrading technology.
In-Depth Vacuum Gas Oil Market Market Outlook
The Vacuum Gas Oil market is poised for continued growth, driven by factors such as rising energy demand, technological advancements, and strategic investments in refining capacity. The focus on producing cleaner fuels and the exploration of new applications for VGO will further drive market expansion. Strategic partnerships and M&A activities will shape the market landscape, and the adaptation to geopolitical dynamics will determine the trajectory of market growth. The market holds significant potential for both established players and new entrants, presenting a dynamic and evolving environment.
Vacuum Gas Oil Market Segmentation
-
1. Product
- 1.1. Low Sulfur Content
- 1.2. High Sulfur Content
-
2. Type
- 2.1. Light Vacuum Gas Oil
- 2.2. Heavy Vacuum Gas Oil
-
3. Application
- 3.1. Gasoline Production
- 3.2. Diesel Oil Production
Vacuum Gas Oil Market Segmentation By Geography
-
1. North America
- 1.1. United States
- 1.2. Canada
- 1.3. Mexico
- 1.4. Rest of North America
-
2. Asia Pacific
- 2.1. China
- 2.2. India
- 2.3. Japan
- 2.4. Rest of Asia Pacific
-
3. Europe
- 3.1. United Kingdom
- 3.2. Germany
- 3.3. France
- 3.4. Rest of Europe
-
4. South America
- 4.1. Brazil
- 4.2. Argentina
- 4.3. Colombia
- 4.4. Rest of South America
-
5. Middle East and Africa
- 5.1. United Arab Emirates
- 5.2. Saudi Arabia
- 5.3. South Africa
- 5.4. Qatar
- 5.5. Kuwait
- 5.6. Rest of Middle East and Africa
Vacuum Gas Oil Market REPORT HIGHLIGHTS
| Aspects | Details |
|---|---|
| Study Period | 2019-2033 |
| Base Year | 2024 |
| Estimated Year | 2025 |
| Forecast Period | 2025-2033 |
| Historical Period | 2019-2024 |
| Growth Rate | CAGR of 5.70% from 2019-2033 |
| Segmentation |
|
Table of Contents
- 1. Introduction
- 1.1. Research Scope
- 1.2. Market Segmentation
- 1.3. Research Methodology
- 1.4. Definitions and Assumptions
- 2. Executive Summary
- 2.1. Introduction
- 3. Market Dynamics
- 3.1. Introduction
- 3.2. Market Drivers
- 3.2.1. 4.; Increasing Demand for Gasoline and Diesel Across the Globe4.; Rapid Expansion of Automotive Industry
- 3.3. Market Restrains
- 3.3.1. 4.; Strict Mandates by the Global Organizations on VGO Composition
- 3.4. Market Trends
- 3.4.1. Increasing Demand for Gasoline and Diesel Across the Globe to Drive the Market
- 4. Market Factor Analysis
- 4.1. Porters Five Forces
- 4.2. Supply/Value Chain
- 4.3. PESTEL analysis
- 4.4. Market Entropy
- 4.5. Patent/Trademark Analysis
- 5. Global Vacuum Gas Oil Market Analysis, Insights and Forecast, 2019-2031
- 5.1. Market Analysis, Insights and Forecast - by Product
- 5.1.1. Low Sulfur Content
- 5.1.2. High Sulfur Content
- 5.2. Market Analysis, Insights and Forecast - by Type
- 5.2.1. Light Vacuum Gas Oil
- 5.2.2. Heavy Vacuum Gas Oil
- 5.3. Market Analysis, Insights and Forecast - by Application
- 5.3.1. Gasoline Production
- 5.3.2. Diesel Oil Production
- 5.4. Market Analysis, Insights and Forecast - by Region
- 5.4.1. North America
- 5.4.2. Asia Pacific
- 5.4.3. Europe
- 5.4.4. South America
- 5.4.5. Middle East and Africa
- 5.1. Market Analysis, Insights and Forecast - by Product
- 6. North America Vacuum Gas Oil Market Analysis, Insights and Forecast, 2019-2031
- 6.1. Market Analysis, Insights and Forecast - by Product
- 6.1.1. Low Sulfur Content
- 6.1.2. High Sulfur Content
- 6.2. Market Analysis, Insights and Forecast - by Type
- 6.2.1. Light Vacuum Gas Oil
- 6.2.2. Heavy Vacuum Gas Oil
- 6.3. Market Analysis, Insights and Forecast - by Application
- 6.3.1. Gasoline Production
- 6.3.2. Diesel Oil Production
- 6.1. Market Analysis, Insights and Forecast - by Product
- 7. Asia Pacific Vacuum Gas Oil Market Analysis, Insights and Forecast, 2019-2031
- 7.1. Market Analysis, Insights and Forecast - by Product
- 7.1.1. Low Sulfur Content
- 7.1.2. High Sulfur Content
- 7.2. Market Analysis, Insights and Forecast - by Type
- 7.2.1. Light Vacuum Gas Oil
- 7.2.2. Heavy Vacuum Gas Oil
- 7.3. Market Analysis, Insights and Forecast - by Application
- 7.3.1. Gasoline Production
- 7.3.2. Diesel Oil Production
- 7.1. Market Analysis, Insights and Forecast - by Product
- 8. Europe Vacuum Gas Oil Market Analysis, Insights and Forecast, 2019-2031
- 8.1. Market Analysis, Insights and Forecast - by Product
- 8.1.1. Low Sulfur Content
- 8.1.2. High Sulfur Content
- 8.2. Market Analysis, Insights and Forecast - by Type
- 8.2.1. Light Vacuum Gas Oil
- 8.2.2. Heavy Vacuum Gas Oil
- 8.3. Market Analysis, Insights and Forecast - by Application
- 8.3.1. Gasoline Production
- 8.3.2. Diesel Oil Production
- 8.1. Market Analysis, Insights and Forecast - by Product
- 9. South America Vacuum Gas Oil Market Analysis, Insights and Forecast, 2019-2031
- 9.1. Market Analysis, Insights and Forecast - by Product
- 9.1.1. Low Sulfur Content
- 9.1.2. High Sulfur Content
- 9.2. Market Analysis, Insights and Forecast - by Type
- 9.2.1. Light Vacuum Gas Oil
- 9.2.2. Heavy Vacuum Gas Oil
- 9.3. Market Analysis, Insights and Forecast - by Application
- 9.3.1. Gasoline Production
- 9.3.2. Diesel Oil Production
- 9.1. Market Analysis, Insights and Forecast - by Product
- 10. Middle East and Africa Vacuum Gas Oil Market Analysis, Insights and Forecast, 2019-2031
- 10.1. Market Analysis, Insights and Forecast - by Product
- 10.1.1. Low Sulfur Content
- 10.1.2. High Sulfur Content
- 10.2. Market Analysis, Insights and Forecast - by Type
- 10.2.1. Light Vacuum Gas Oil
- 10.2.2. Heavy Vacuum Gas Oil
- 10.3. Market Analysis, Insights and Forecast - by Application
- 10.3.1. Gasoline Production
- 10.3.2. Diesel Oil Production
- 10.1. Market Analysis, Insights and Forecast - by Product
- 11. North America Vacuum Gas Oil Market Analysis, Insights and Forecast, 2019-2031
- 11.1. Market Analysis, Insights and Forecast - By Country/Sub-region
- 11.1.1 United States
- 11.1.2 Canada
- 11.1.3 Mexico
- 12. Europe Vacuum Gas Oil Market Analysis, Insights and Forecast, 2019-2031
- 12.1. Market Analysis, Insights and Forecast - By Country/Sub-region
- 12.1.1 Germany
- 12.1.2 United Kingdom
- 12.1.3 France
- 12.1.4 Spain
- 12.1.5 Italy
- 12.1.6 Spain
- 12.1.7 Belgium
- 12.1.8 Netherland
- 12.1.9 Nordics
- 12.1.10 Rest of Europe
- 13. Asia Pacific Vacuum Gas Oil Market Analysis, Insights and Forecast, 2019-2031
- 13.1. Market Analysis, Insights and Forecast - By Country/Sub-region
- 13.1.1 China
- 13.1.2 Japan
- 13.1.3 India
- 13.1.4 South Korea
- 13.1.5 Southeast Asia
- 13.1.6 Australia
- 13.1.7 Indonesia
- 13.1.8 Phillipes
- 13.1.9 Singapore
- 13.1.10 Thailandc
- 13.1.11 Rest of Asia Pacific
- 14. South America Vacuum Gas Oil Market Analysis, Insights and Forecast, 2019-2031
- 14.1. Market Analysis, Insights and Forecast - By Country/Sub-region
- 14.1.1 Brazil
- 14.1.2 Argentina
- 14.1.3 Peru
- 14.1.4 Chile
- 14.1.5 Colombia
- 14.1.6 Ecuador
- 14.1.7 Venezuela
- 14.1.8 Rest of South America
- 15. North America Vacuum Gas Oil Market Analysis, Insights and Forecast, 2019-2031
- 15.1. Market Analysis, Insights and Forecast - By Country/Sub-region
- 15.1.1 United States
- 15.1.2 Canada
- 15.1.3 Mexico
- 16. MEA Vacuum Gas Oil Market Analysis, Insights and Forecast, 2019-2031
- 16.1. Market Analysis, Insights and Forecast - By Country/Sub-region
- 16.1.1 United Arab Emirates
- 16.1.2 Saudi Arabia
- 16.1.3 South Africa
- 16.1.4 Rest of Middle East and Africa
- 17. Competitive Analysis
- 17.1. Global Market Share Analysis 2024
- 17.2. Company Profiles
- 17.2.1 Kuwait Petroleum Corporation
- 17.2.1.1. Overview
- 17.2.1.2. Products
- 17.2.1.3. SWOT Analysis
- 17.2.1.4. Recent Developments
- 17.2.1.5. Financials (Based on Availability)
- 17.2.2 Exxon Mobil Corporation
- 17.2.2.1. Overview
- 17.2.2.2. Products
- 17.2.2.3. SWOT Analysis
- 17.2.2.4. Recent Developments
- 17.2.2.5. Financials (Based on Availability)
- 17.2.3 China National Petroleum Corporation
- 17.2.3.1. Overview
- 17.2.3.2. Products
- 17.2.3.3. SWOT Analysis
- 17.2.3.4. Recent Developments
- 17.2.3.5. Financials (Based on Availability)
- 17.2.4 NK Rosneft' PAO
- 17.2.4.1. Overview
- 17.2.4.2. Products
- 17.2.4.3. SWOT Analysis
- 17.2.4.4. Recent Developments
- 17.2.4.5. Financials (Based on Availability)
- 17.2.5 Indian Oil Corp Ltd
- 17.2.5.1. Overview
- 17.2.5.2. Products
- 17.2.5.3. SWOT Analysis
- 17.2.5.4. Recent Developments
- 17.2.5.5. Financials (Based on Availability)
- 17.2.6 Chevron Corporation
- 17.2.6.1. Overview
- 17.2.6.2. Products
- 17.2.6.3. SWOT Analysis
- 17.2.6.4. Recent Developments
- 17.2.6.5. Financials (Based on Availability)
- 17.2.7 Eni SpA
- 17.2.7.1. Overview
- 17.2.7.2. Products
- 17.2.7.3. SWOT Analysis
- 17.2.7.4. Recent Developments
- 17.2.7.5. Financials (Based on Availability)
- 17.2.8 BP PLC
- 17.2.8.1. Overview
- 17.2.8.2. Products
- 17.2.8.3. SWOT Analysis
- 17.2.8.4. Recent Developments
- 17.2.8.5. Financials (Based on Availability)
- 17.2.9 Shell Plc*List Not Exhaustive
- 17.2.9.1. Overview
- 17.2.9.2. Products
- 17.2.9.3. SWOT Analysis
- 17.2.9.4. Recent Developments
- 17.2.9.5. Financials (Based on Availability)
- 17.2.1 Kuwait Petroleum Corporation
List of Figures
- Figure 1: Global Vacuum Gas Oil Market Revenue Breakdown (Million, %) by Region 2024 & 2032
- Figure 2: North America Vacuum Gas Oil Market Revenue (Million), by Country 2024 & 2032
- Figure 3: North America Vacuum Gas Oil Market Revenue Share (%), by Country 2024 & 2032
- Figure 4: Europe Vacuum Gas Oil Market Revenue (Million), by Country 2024 & 2032
- Figure 5: Europe Vacuum Gas Oil Market Revenue Share (%), by Country 2024 & 2032
- Figure 6: Asia Pacific Vacuum Gas Oil Market Revenue (Million), by Country 2024 & 2032
- Figure 7: Asia Pacific Vacuum Gas Oil Market Revenue Share (%), by Country 2024 & 2032
- Figure 8: South America Vacuum Gas Oil Market Revenue (Million), by Country 2024 & 2032
- Figure 9: South America Vacuum Gas Oil Market Revenue Share (%), by Country 2024 & 2032
- Figure 10: North America Vacuum Gas Oil Market Revenue (Million), by Country 2024 & 2032
- Figure 11: North America Vacuum Gas Oil Market Revenue Share (%), by Country 2024 & 2032
- Figure 12: MEA Vacuum Gas Oil Market Revenue (Million), by Country 2024 & 2032
- Figure 13: MEA Vacuum Gas Oil Market Revenue Share (%), by Country 2024 & 2032
- Figure 14: North America Vacuum Gas Oil Market Revenue (Million), by Product 2024 & 2032
- Figure 15: North America Vacuum Gas Oil Market Revenue Share (%), by Product 2024 & 2032
- Figure 16: North America Vacuum Gas Oil Market Revenue (Million), by Type 2024 & 2032
- Figure 17: North America Vacuum Gas Oil Market Revenue Share (%), by Type 2024 & 2032
- Figure 18: North America Vacuum Gas Oil Market Revenue (Million), by Application 2024 & 2032
- Figure 19: North America Vacuum Gas Oil Market Revenue Share (%), by Application 2024 & 2032
- Figure 20: North America Vacuum Gas Oil Market Revenue (Million), by Country 2024 & 2032
- Figure 21: North America Vacuum Gas Oil Market Revenue Share (%), by Country 2024 & 2032
- Figure 22: Asia Pacific Vacuum Gas Oil Market Revenue (Million), by Product 2024 & 2032
- Figure 23: Asia Pacific Vacuum Gas Oil Market Revenue Share (%), by Product 2024 & 2032
- Figure 24: Asia Pacific Vacuum Gas Oil Market Revenue (Million), by Type 2024 & 2032
- Figure 25: Asia Pacific Vacuum Gas Oil Market Revenue Share (%), by Type 2024 & 2032
- Figure 26: Asia Pacific Vacuum Gas Oil Market Revenue (Million), by Application 2024 & 2032
- Figure 27: Asia Pacific Vacuum Gas Oil Market Revenue Share (%), by Application 2024 & 2032
- Figure 28: Asia Pacific Vacuum Gas Oil Market Revenue (Million), by Country 2024 & 2032
- Figure 29: Asia Pacific Vacuum Gas Oil Market Revenue Share (%), by Country 2024 & 2032
- Figure 30: Europe Vacuum Gas Oil Market Revenue (Million), by Product 2024 & 2032
- Figure 31: Europe Vacuum Gas Oil Market Revenue Share (%), by Product 2024 & 2032
- Figure 32: Europe Vacuum Gas Oil Market Revenue (Million), by Type 2024 & 2032
- Figure 33: Europe Vacuum Gas Oil Market Revenue Share (%), by Type 2024 & 2032
- Figure 34: Europe Vacuum Gas Oil Market Revenue (Million), by Application 2024 & 2032
- Figure 35: Europe Vacuum Gas Oil Market Revenue Share (%), by Application 2024 & 2032
- Figure 36: Europe Vacuum Gas Oil Market Revenue (Million), by Country 2024 & 2032
- Figure 37: Europe Vacuum Gas Oil Market Revenue Share (%), by Country 2024 & 2032
- Figure 38: South America Vacuum Gas Oil Market Revenue (Million), by Product 2024 & 2032
- Figure 39: South America Vacuum Gas Oil Market Revenue Share (%), by Product 2024 & 2032
- Figure 40: South America Vacuum Gas Oil Market Revenue (Million), by Type 2024 & 2032
- Figure 41: South America Vacuum Gas Oil Market Revenue Share (%), by Type 2024 & 2032
- Figure 42: South America Vacuum Gas Oil Market Revenue (Million), by Application 2024 & 2032
- Figure 43: South America Vacuum Gas Oil Market Revenue Share (%), by Application 2024 & 2032
- Figure 44: South America Vacuum Gas Oil Market Revenue (Million), by Country 2024 & 2032
- Figure 45: South America Vacuum Gas Oil Market Revenue Share (%), by Country 2024 & 2032
- Figure 46: Middle East and Africa Vacuum Gas Oil Market Revenue (Million), by Product 2024 & 2032
- Figure 47: Middle East and Africa Vacuum Gas Oil Market Revenue Share (%), by Product 2024 & 2032
- Figure 48: Middle East and Africa Vacuum Gas Oil Market Revenue (Million), by Type 2024 & 2032
- Figure 49: Middle East and Africa Vacuum Gas Oil Market Revenue Share (%), by Type 2024 & 2032
- Figure 50: Middle East and Africa Vacuum Gas Oil Market Revenue (Million), by Application 2024 & 2032
- Figure 51: Middle East and Africa Vacuum Gas Oil Market Revenue Share (%), by Application 2024 & 2032
- Figure 52: Middle East and Africa Vacuum Gas Oil Market Revenue (Million), by Country 2024 & 2032
- Figure 53: Middle East and Africa Vacuum Gas Oil Market Revenue Share (%), by Country 2024 & 2032
List of Tables
- Table 1: Global Vacuum Gas Oil Market Revenue Million Forecast, by Region 2019 & 2032
- Table 2: Global Vacuum Gas Oil Market Revenue Million Forecast, by Product 2019 & 2032
- Table 3: Global Vacuum Gas Oil Market Revenue Million Forecast, by Type 2019 & 2032
- Table 4: Global Vacuum Gas Oil Market Revenue Million Forecast, by Application 2019 & 2032
- Table 5: Global Vacuum Gas Oil Market Revenue Million Forecast, by Region 2019 & 2032
- Table 6: Global Vacuum Gas Oil Market Revenue Million Forecast, by Country 2019 & 2032
- Table 7: United States Vacuum Gas Oil Market Revenue (Million) Forecast, by Application 2019 & 2032
- Table 8: Canada Vacuum Gas Oil Market Revenue (Million) Forecast, by Application 2019 & 2032
- Table 9: Mexico Vacuum Gas Oil Market Revenue (Million) Forecast, by Application 2019 & 2032
- Table 10: Global Vacuum Gas Oil Market Revenue Million Forecast, by Country 2019 & 2032
- Table 11: Germany Vacuum Gas Oil Market Revenue (Million) Forecast, by Application 2019 & 2032
- Table 12: United Kingdom Vacuum Gas Oil Market Revenue (Million) Forecast, by Application 2019 & 2032
- Table 13: France Vacuum Gas Oil Market Revenue (Million) Forecast, by Application 2019 & 2032
- Table 14: Spain Vacuum Gas Oil Market Revenue (Million) Forecast, by Application 2019 & 2032
- Table 15: Italy Vacuum Gas Oil Market Revenue (Million) Forecast, by Application 2019 & 2032
- Table 16: Spain Vacuum Gas Oil Market Revenue (Million) Forecast, by Application 2019 & 2032
- Table 17: Belgium Vacuum Gas Oil Market Revenue (Million) Forecast, by Application 2019 & 2032
- Table 18: Netherland Vacuum Gas Oil Market Revenue (Million) Forecast, by Application 2019 & 2032
- Table 19: Nordics Vacuum Gas Oil Market Revenue (Million) Forecast, by Application 2019 & 2032
- Table 20: Rest of Europe Vacuum Gas Oil Market Revenue (Million) Forecast, by Application 2019 & 2032
- Table 21: Global Vacuum Gas Oil Market Revenue Million Forecast, by Country 2019 & 2032
- Table 22: China Vacuum Gas Oil Market Revenue (Million) Forecast, by Application 2019 & 2032
- Table 23: Japan Vacuum Gas Oil Market Revenue (Million) Forecast, by Application 2019 & 2032
- Table 24: India Vacuum Gas Oil Market Revenue (Million) Forecast, by Application 2019 & 2032
- Table 25: South Korea Vacuum Gas Oil Market Revenue (Million) Forecast, by Application 2019 & 2032
- Table 26: Southeast Asia Vacuum Gas Oil Market Revenue (Million) Forecast, by Application 2019 & 2032
- Table 27: Australia Vacuum Gas Oil Market Revenue (Million) Forecast, by Application 2019 & 2032
- Table 28: Indonesia Vacuum Gas Oil Market Revenue (Million) Forecast, by Application 2019 & 2032
- Table 29: Phillipes Vacuum Gas Oil Market Revenue (Million) Forecast, by Application 2019 & 2032
- Table 30: Singapore Vacuum Gas Oil Market Revenue (Million) Forecast, by Application 2019 & 2032
- Table 31: Thailandc Vacuum Gas Oil Market Revenue (Million) Forecast, by Application 2019 & 2032
- Table 32: Rest of Asia Pacific Vacuum Gas Oil Market Revenue (Million) Forecast, by Application 2019 & 2032
- Table 33: Global Vacuum Gas Oil Market Revenue Million Forecast, by Country 2019 & 2032
- Table 34: Brazil Vacuum Gas Oil Market Revenue (Million) Forecast, by Application 2019 & 2032
- Table 35: Argentina Vacuum Gas Oil Market Revenue (Million) Forecast, by Application 2019 & 2032
- Table 36: Peru Vacuum Gas Oil Market Revenue (Million) Forecast, by Application 2019 & 2032
- Table 37: Chile Vacuum Gas Oil Market Revenue (Million) Forecast, by Application 2019 & 2032
- Table 38: Colombia Vacuum Gas Oil Market Revenue (Million) Forecast, by Application 2019 & 2032
- Table 39: Ecuador Vacuum Gas Oil Market Revenue (Million) Forecast, by Application 2019 & 2032
- Table 40: Venezuela Vacuum Gas Oil Market Revenue (Million) Forecast, by Application 2019 & 2032
- Table 41: Rest of South America Vacuum Gas Oil Market Revenue (Million) Forecast, by Application 2019 & 2032
- Table 42: Global Vacuum Gas Oil Market Revenue Million Forecast, by Country 2019 & 2032
- Table 43: United States Vacuum Gas Oil Market Revenue (Million) Forecast, by Application 2019 & 2032
- Table 44: Canada Vacuum Gas Oil Market Revenue (Million) Forecast, by Application 2019 & 2032
- Table 45: Mexico Vacuum Gas Oil Market Revenue (Million) Forecast, by Application 2019 & 2032
- Table 46: Global Vacuum Gas Oil Market Revenue Million Forecast, by Country 2019 & 2032
- Table 47: United Arab Emirates Vacuum Gas Oil Market Revenue (Million) Forecast, by Application 2019 & 2032
- Table 48: Saudi Arabia Vacuum Gas Oil Market Revenue (Million) Forecast, by Application 2019 & 2032
- Table 49: South Africa Vacuum Gas Oil Market Revenue (Million) Forecast, by Application 2019 & 2032
- Table 50: Rest of Middle East and Africa Vacuum Gas Oil Market Revenue (Million) Forecast, by Application 2019 & 2032
- Table 51: Global Vacuum Gas Oil Market Revenue Million Forecast, by Product 2019 & 2032
- Table 52: Global Vacuum Gas Oil Market Revenue Million Forecast, by Type 2019 & 2032
- Table 53: Global Vacuum Gas Oil Market Revenue Million Forecast, by Application 2019 & 2032
- Table 54: Global Vacuum Gas Oil Market Revenue Million Forecast, by Country 2019 & 2032
- Table 55: United States Vacuum Gas Oil Market Revenue (Million) Forecast, by Application 2019 & 2032
- Table 56: Canada Vacuum Gas Oil Market Revenue (Million) Forecast, by Application 2019 & 2032
- Table 57: Mexico Vacuum Gas Oil Market Revenue (Million) Forecast, by Application 2019 & 2032
- Table 58: Rest of North America Vacuum Gas Oil Market Revenue (Million) Forecast, by Application 2019 & 2032
- Table 59: Global Vacuum Gas Oil Market Revenue Million Forecast, by Product 2019 & 2032
- Table 60: Global Vacuum Gas Oil Market Revenue Million Forecast, by Type 2019 & 2032
- Table 61: Global Vacuum Gas Oil Market Revenue Million Forecast, by Application 2019 & 2032
- Table 62: Global Vacuum Gas Oil Market Revenue Million Forecast, by Country 2019 & 2032
- Table 63: China Vacuum Gas Oil Market Revenue (Million) Forecast, by Application 2019 & 2032
- Table 64: India Vacuum Gas Oil Market Revenue (Million) Forecast, by Application 2019 & 2032
- Table 65: Japan Vacuum Gas Oil Market Revenue (Million) Forecast, by Application 2019 & 2032
- Table 66: Rest of Asia Pacific Vacuum Gas Oil Market Revenue (Million) Forecast, by Application 2019 & 2032
- Table 67: Global Vacuum Gas Oil Market Revenue Million Forecast, by Product 2019 & 2032
- Table 68: Global Vacuum Gas Oil Market Revenue Million Forecast, by Type 2019 & 2032
- Table 69: Global Vacuum Gas Oil Market Revenue Million Forecast, by Application 2019 & 2032
- Table 70: Global Vacuum Gas Oil Market Revenue Million Forecast, by Country 2019 & 2032
- Table 71: United Kingdom Vacuum Gas Oil Market Revenue (Million) Forecast, by Application 2019 & 2032
- Table 72: Germany Vacuum Gas Oil Market Revenue (Million) Forecast, by Application 2019 & 2032
- Table 73: France Vacuum Gas Oil Market Revenue (Million) Forecast, by Application 2019 & 2032
- Table 74: Rest of Europe Vacuum Gas Oil Market Revenue (Million) Forecast, by Application 2019 & 2032
- Table 75: Global Vacuum Gas Oil Market Revenue Million Forecast, by Product 2019 & 2032
- Table 76: Global Vacuum Gas Oil Market Revenue Million Forecast, by Type 2019 & 2032
- Table 77: Global Vacuum Gas Oil Market Revenue Million Forecast, by Application 2019 & 2032
- Table 78: Global Vacuum Gas Oil Market Revenue Million Forecast, by Country 2019 & 2032
- Table 79: Brazil Vacuum Gas Oil Market Revenue (Million) Forecast, by Application 2019 & 2032
- Table 80: Argentina Vacuum Gas Oil Market Revenue (Million) Forecast, by Application 2019 & 2032
- Table 81: Colombia Vacuum Gas Oil Market Revenue (Million) Forecast, by Application 2019 & 2032
- Table 82: Rest of South America Vacuum Gas Oil Market Revenue (Million) Forecast, by Application 2019 & 2032
- Table 83: Global Vacuum Gas Oil Market Revenue Million Forecast, by Product 2019 & 2032
- Table 84: Global Vacuum Gas Oil Market Revenue Million Forecast, by Type 2019 & 2032
- Table 85: Global Vacuum Gas Oil Market Revenue Million Forecast, by Application 2019 & 2032
- Table 86: Global Vacuum Gas Oil Market Revenue Million Forecast, by Country 2019 & 2032
- Table 87: United Arab Emirates Vacuum Gas Oil Market Revenue (Million) Forecast, by Application 2019 & 2032
- Table 88: Saudi Arabia Vacuum Gas Oil Market Revenue (Million) Forecast, by Application 2019 & 2032
- Table 89: South Africa Vacuum Gas Oil Market Revenue (Million) Forecast, by Application 2019 & 2032
- Table 90: Qatar Vacuum Gas Oil Market Revenue (Million) Forecast, by Application 2019 & 2032
- Table 91: Kuwait Vacuum Gas Oil Market Revenue (Million) Forecast, by Application 2019 & 2032
- Table 92: Rest of Middle East and Africa Vacuum Gas Oil Market Revenue (Million) Forecast, by Application 2019 & 2032
Frequently Asked Questions
1. What is the projected Compound Annual Growth Rate (CAGR) of the Vacuum Gas Oil Market?
The projected CAGR is approximately 5.70%.
2. Which companies are prominent players in the Vacuum Gas Oil Market?
Key companies in the market include Kuwait Petroleum Corporation, Exxon Mobil Corporation, China National Petroleum Corporation, NK Rosneft' PAO, Indian Oil Corp Ltd, Chevron Corporation, Eni SpA, BP PLC, Shell Plc*List Not Exhaustive.
3. What are the main segments of the Vacuum Gas Oil Market?
The market segments include Product, Type, Application.
4. Can you provide details about the market size?
The market size is estimated to be USD 359.38 Million as of 2022.
5. What are some drivers contributing to market growth?
4.; Increasing Demand for Gasoline and Diesel Across the Globe4.; Rapid Expansion of Automotive Industry.
6. What are the notable trends driving market growth?
Increasing Demand for Gasoline and Diesel Across the Globe to Drive the Market.
7. Are there any restraints impacting market growth?
4.; Strict Mandates by the Global Organizations on VGO Composition.
8. Can you provide examples of recent developments in the market?
August 2023, India is poised to purchase a considerable dirty fuels from Russia in years, as a slump in crude flows from the critical producer and looming refinery maintenance threaten supplies. In August, imports of sludgy products from Russia should double from last month to about 269,000 barrels a day. The flows primarily include high-sulfur fuel oil and vacuum gasoil, which can be employed in secondary refining units to improve yields of higher-value products like diesel and gasoline.
9. What pricing options are available for accessing the report?
Pricing options include single-user, multi-user, and enterprise licenses priced at USD 4750, USD 5250, and USD 8750 respectively.
10. Is the market size provided in terms of value or volume?
The market size is provided in terms of value, measured in Million.
11. Are there any specific market keywords associated with the report?
Yes, the market keyword associated with the report is "Vacuum Gas Oil Market," which aids in identifying and referencing the specific market segment covered.
12. How do I determine which pricing option suits my needs best?
The pricing options vary based on user requirements and access needs. Individual users may opt for single-user licenses, while businesses requiring broader access may choose multi-user or enterprise licenses for cost-effective access to the report.
13. Are there any additional resources or data provided in the Vacuum Gas Oil Market report?
While the report offers comprehensive insights, it's advisable to review the specific contents or supplementary materials provided to ascertain if additional resources or data are available.
14. How can I stay updated on further developments or reports in the Vacuum Gas Oil Market?
To stay informed about further developments, trends, and reports in the Vacuum Gas Oil Market, consider subscribing to industry newsletters, following relevant companies and organizations, or regularly checking reputable industry news sources and publications.
Methodology
Step 1 - Identification of Relevant Samples Size from Population Database


Step 2 - Approaches for Defining Global Market Size (Value, Volume* & Price*)

Note*: In applicable scenarios
Step 3 - Data Sources
Primary Research
- Web Analytics
- Survey Reports
- Research Institute
- Latest Research Reports
- Opinion Leaders
Secondary Research
- Annual Reports
- White Paper
- Latest Press Release
- Industry Association
- Paid Database
- Investor Presentations

Step 4 - Data Triangulation
Involves using different sources of information in order to increase the validity of a study
These sources are likely to be stakeholders in a program - participants, other researchers, program staff, other community members, and so on.
Then we put all data in single framework & apply various statistical tools to find out the dynamic on the market.
During the analysis stage, feedback from the stakeholder groups would be compared to determine areas of agreement as well as areas of divergence


