Fuel Tanker Services Market in Developing Economies: Trends and Growth Analysis 2025-2033

Fuel Tanker Services Market by Material Type (Carbon Steel, Stainless Steel, Aluminum Alloy), by Capacity (Below 20000 Liters, 30000 - 40000 Liters, Above 40000 Liters), by Fuel Type (Petrol, LNG, Other Fuels), by Operator (Retail Petrol Companies, Refineries), by North America (United States, Canada, Rest of North America), by Europe (Germany, France, United Kingdom, Italy, Spain, NORDIC, Russia, Rest of Europe), by Asia Pacific (China, India, Australia, Malaysia, Indonesia, Thailand, Vietnam, Rest of Asia Pacific), by Middle East and Africa (Saudi Arabia, United Arab Emirates, South Africa, Nigeria, Rest of Middle East and Africa, Egypt), by South America (Brazil, Argentina, Colombia, Rest of South America) Forecast 2025-2033

Jul 14 2025
Base Year: 2024

234 Pages
Main Logo

Fuel Tanker Services Market in Developing Economies: Trends and Growth Analysis 2025-2033


Home
Industries
Energy & Power
sponsor image
sponsor image
sponsor image
sponsor image
sponsor image

Tailored for you

  • In-depth Analysis Tailored to Specified Regions or Segments
  • Company Profiles Customized to User Preferences
  • Comprehensive Insights Focused on Specific Segments or Regions
  • Customized Evaluation of Competitive Landscape to Meet Your Needs
  • Tailored Customization to Address Other Specific Requirements
Ask for customization


Key Insights

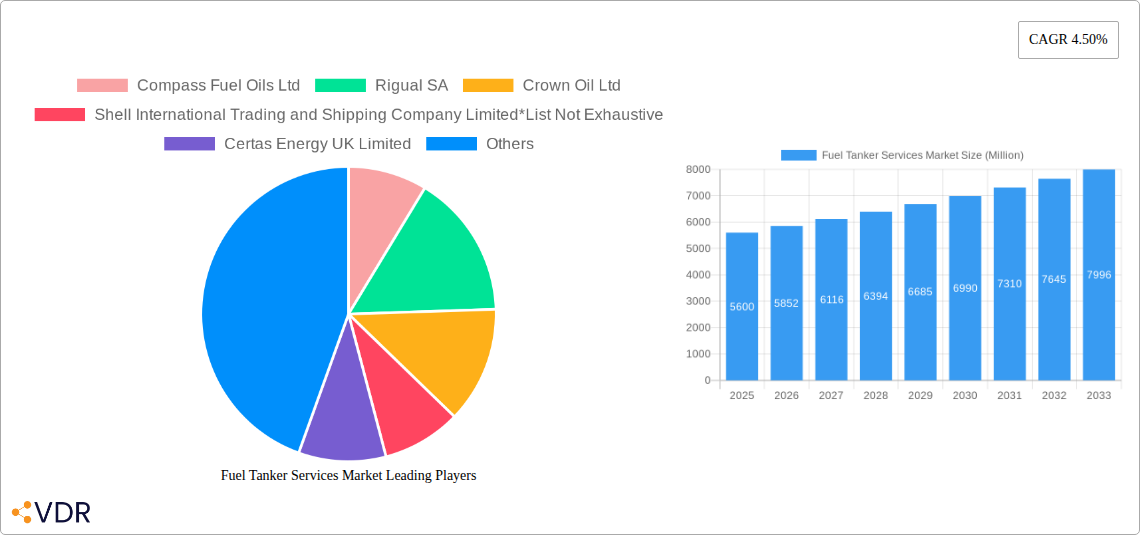
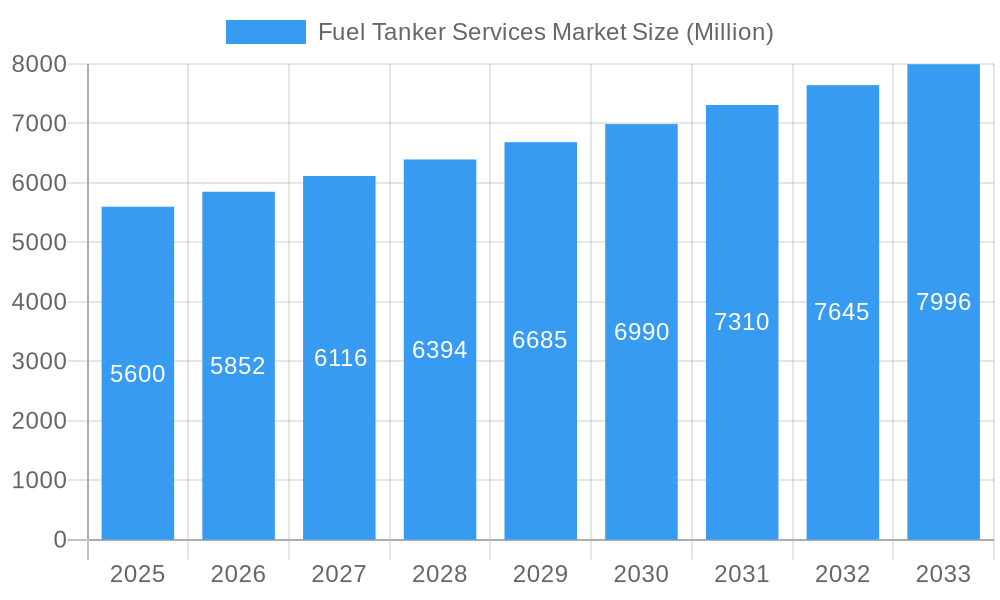
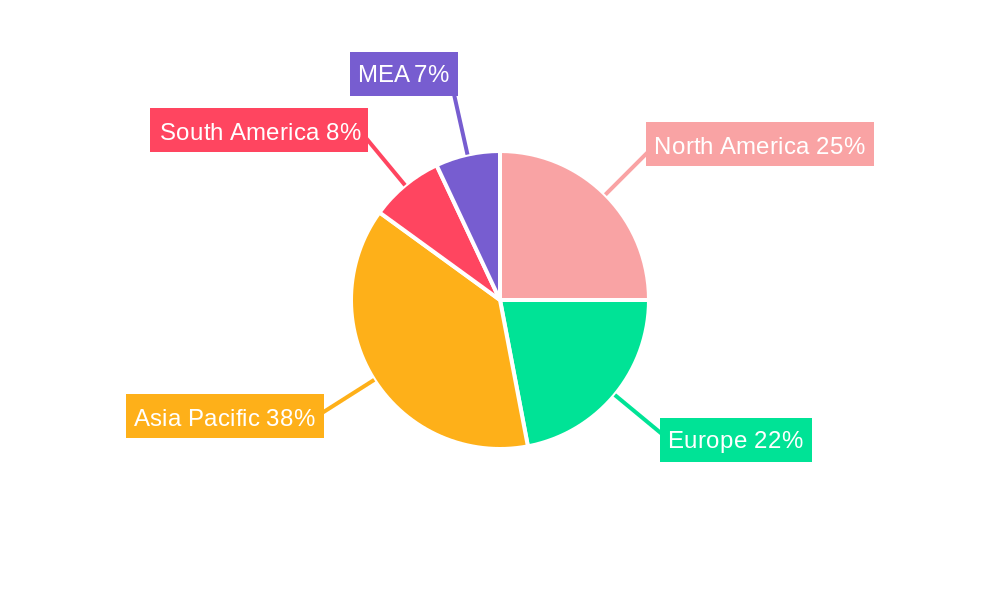
The Fuel Tanker Services Market, valued at $5.60 billion in 2025, is projected to experience robust growth, driven by increasing global fuel demand, expanding infrastructure development in emerging economies, and the rising need for efficient fuel transportation. The market's Compound Annual Growth Rate (CAGR) of 4.50% from 2025 to 2033 indicates a steady upward trajectory. Key market segments include capacity (below 20,000 liters, 30,000-40,000 liters, above 40,000 liters), fuel type (petrol, LNG, other fuels), operator (retail petrol companies, refineries), and material type (carbon steel, stainless steel, aluminum alloy). Growth is further fueled by the increasing adoption of LNG as a cleaner fuel alternative and the expansion of refinery operations globally. However, fluctuating fuel prices, stringent environmental regulations, and the potential for geopolitical instability represent key restraints on market expansion. The Asia-Pacific region, driven by rapid industrialization and infrastructure development in countries like China and India, is expected to dominate the market, followed by North America and Europe. Competition within the market is moderately intense, with major players like Compass Fuel Oils Ltd, Rigual SA, Crown Oil Ltd, Shell International Trading and Shipping Company Limited, and Certas Energy UK Limited vying for market share. Future growth will likely be influenced by technological advancements in tanker design and fuel efficiency, as well as government policies promoting sustainable transportation.

The diverse geographic segmentation offers significant opportunities for specialized services. North America benefits from existing infrastructure and established logistical networks, while the European market focuses on stringent environmental standards and efficient cross-border transportation. The Asia-Pacific region's growth potential is massive due to its rapidly developing economies and burgeoning energy demands. South America and the MEA regions, while presenting unique challenges and opportunities related to infrastructure and regulatory environments, show potential for steady growth over the forecast period. The continued expansion of the global fuel tanker services market will hinge on the interplay between fuel demand, infrastructure investments, technological innovation, and global economic conditions. Companies will need to adapt their strategies to address evolving regulations and customer preferences to maintain a competitive edge.

Fuel Tanker Services Market Research Report - Market Size, Growth & Forecast

Fuel Tanker Services Market: A Comprehensive Report (2019-2033)

This in-depth report provides a comprehensive analysis of the Fuel Tanker Services Market, encompassing market dynamics, growth trends, regional insights, and competitive landscapes. The study period covers 2019-2033, with 2025 as the base and estimated year. The report segments the market by capacity (Below 20,000 Liters, 30,000-40,000 Liters, Above 40,000 Liters), fuel type (Petrol, LNG, Other Fuels), operator (Retail Petrol Companies, Refineries), and material type (Carbon Steel, Stainless Steel, Aluminum Alloy). Key players analyzed include Compass Fuel Oils Ltd, Rigual SA, Crown Oil Ltd, Shell International Trading and Shipping Company Limited, Certas Energy UK Limited, and others. The report is invaluable for industry professionals, investors, and strategic decision-makers seeking a thorough understanding of this dynamic market.


Fuel Tanker Services Market Dynamics & Structure

The Fuel Tanker Services Market exhibits a moderately concentrated structure, with a few large players holding significant market share. Technological innovation, particularly in fuel efficiency and safety features, is a key driver. Stringent regulatory frameworks concerning emissions and safety standards influence market dynamics. Competitive substitutes, such as pipelines and rail transport, exert pressure. End-user demographics are shaped by the growth of the logistics and transportation industries. M&A activity, as illustrated by recent acquisitions like Compass Fuel Oils Ltd's purchase of an Arctic fuel tanker, signifies consolidation and expansion efforts within the sector.

  • Market Concentration: XX% of market share held by top 5 players in 2024.
  • Technological Innovation: Focus on automation, fuel efficiency, and emission reduction technologies.
  • Regulatory Framework: Stringent safety and environmental regulations driving innovation and investment.
  • Competitive Substitutes: Pipeline and rail transport posing competition, especially for long-distance fuel delivery.
  • M&A Activity: XX M&A deals recorded in the last 5 years (2019-2024), indicating ongoing consolidation.
  • Innovation Barriers: High capital expenditure requirements for new technologies and stringent regulatory approvals.


Fuel Tanker Services Market Growth Trends & Insights

The Fuel Tanker Services Market is projected to experience significant growth during the forecast period (2025-2033). Driven by increasing global fuel demand and expanding transportation networks, the market size is expected to reach xx Million by 2033, registering a CAGR of xx% during 2025-2033. The adoption rate of advanced fuel tanker technologies, such as those with enhanced safety features and improved fuel efficiency, is steadily increasing. Technological disruptions, including the introduction of alternative fuels like LNG, are reshaping the market landscape. Consumer behavior shifts towards sustainable and environmentally friendly transportation options are also influencing the demand for fuel-efficient tankers. Market penetration of LNG tankers, for example, is expected to grow significantly in the coming years.


Fuel Tanker Services Market Growth

Dominant Regions, Countries, or Segments in Fuel Tanker Services Market

The North American and European regions dominate the Fuel Tanker Services Market, driven by robust infrastructure, high fuel consumption, and stringent regulatory compliance standards. Within these regions, countries with large industrial and logistics sectors show significant growth potential. Regarding segments, the 'Above 40,000 Liters' capacity segment holds the largest market share due to its efficiency in long-haul transportation. The Petrol fuel type currently commands the largest share, but LNG is projected to witness faster growth in the coming years. Refineries are the largest operators of fuel tankers. Carbon Steel is the most prevalent material, but the adoption of Stainless Steel and Aluminum Alloy is on the rise due to their corrosion-resistant properties.

  • Key Drivers: Robust infrastructure development in key regions, increasing industrial activity, and rising fuel demand.
  • Dominant Regions: North America and Europe.
  • Leading Segments: Above 40,000 Liters capacity, Petrol fuel type, Refineries as operators, and Carbon Steel material type.
  • Growth Potential: Emerging economies in Asia-Pacific and Latin America present significant growth opportunities.


Fuel Tanker Services Market Product Landscape

Fuel tanker design is constantly evolving with a focus on enhanced safety features, increased fuel efficiency, and reduced emissions. Innovations include advanced monitoring systems, improved fuel management technologies, and the incorporation of alternative materials like aluminum alloys for lighter weight and improved fuel economy. These advancements improve operational efficiency and reduce the environmental impact of fuel transportation. Unique selling propositions (USPs) emphasize factors like durability, safety features, and customization for specific fuel types and transportation needs.


Key Drivers, Barriers & Challenges in Fuel Tanker Services Market

Key Drivers: Rising global fuel demand, expansion of the logistics sector, and increasing investments in infrastructure are significant drivers. Government initiatives promoting sustainable transportation also contribute to growth.

Key Challenges: Fluctuations in fuel prices, stringent environmental regulations, and intense competition among fuel tanker service providers pose considerable challenges. Supply chain disruptions can also affect market dynamics. For example, increasing steel prices can drive up manufacturing costs.


Emerging Opportunities in Fuel Tanker Services Market

The adoption of alternative fuels (e.g., LNG, hydrogen) presents significant growth opportunities. The rise of e-commerce and its consequent demand for efficient last-mile delivery solutions boosts market growth. Specialized tankers designed to transport biofuels and other renewable energy sources are expected to gain traction.


Growth Accelerators in the Fuel Tanker Services Market Industry

Technological advancements in fuel efficiency, safety, and monitoring systems drive long-term growth. Strategic partnerships between fuel tanker operators and logistics companies contribute significantly to market expansion. Investment in new infrastructure, particularly in emerging economies, fuels market growth.


Key Players Shaping the Fuel Tanker Services Market Market

  • Compass Fuel Oils Ltd
  • Rigual SA
  • Crown Oil Ltd
  • Shell International Trading and Shipping Company Limited
  • Certas Energy UK Limited
  • List Not Exhaustive


Notable Milestones in Fuel Tanker Services Market Sector

  • January 2024: Compass Fuel Oils Ltd announced the acquisition of a new Arctic fuel tanker, enhancing its capacity.
  • December 2023: ReFuels announced the construction of a new CNG refueling facility, promoting sustainable transportation.


In-Depth Fuel Tanker Services Market Market Outlook

The Fuel Tanker Services Market is poised for continued expansion driven by robust demand, technological innovation, and strategic partnerships. The integration of alternative fuels and enhanced safety technologies will create new market opportunities, while strategic alliances and market expansions into emerging regions will further fuel the market's growth potential. Opportunities abound for companies that adapt to evolving technological advancements and environmental regulations.

Fuel Tanker Services Market Segmentation

  • 1. Material Type
    • 1.1. Carbon Steel
    • 1.2. Stainless Steel
    • 1.3. Aluminum Alloy
  • 2. Capacity
    • 2.1. Below 20000 Liters
    • 2.2. 30000 - 40000 Liters
    • 2.3. Above 40000 Liters
  • 3. Fuel Type
    • 3.1. Petrol
    • 3.2. LNG
    • 3.3. Other Fuels
  • 4. Operator
    • 4.1. Retail Petrol Companies
    • 4.2. Refineries

Fuel Tanker Services Market Segmentation By Geography

  • 1. North America
    • 1.1. United States
    • 1.2. Canada
    • 1.3. Rest of North America
  • 2. Europe
    • 2.1. Germany
    • 2.2. France
    • 2.3. United Kingdom
    • 2.4. Italy
    • 2.5. Spain
    • 2.6. NORDIC
    • 2.7. Russia
    • 2.8. Rest of Europe
  • 3. Asia Pacific
    • 3.1. China
    • 3.2. India
    • 3.3. Australia
    • 3.4. Malaysia
    • 3.5. Indonesia
    • 3.6. Thailand
    • 3.7. Vietnam
    • 3.8. Rest of Asia Pacific
  • 4. Middle East and Africa
    • 4.1. Saudi Arabia
    • 4.2. United Arab Emirates
    • 4.3. South Africa
    • 4.4. Nigeria
    • 4.5. Rest of Middle East and Africa
    • 4.6. Egypt
  • 5. South America
    • 5.1. Brazil
    • 5.2. Argentina
    • 5.3. Colombia
    • 5.4. Rest of South America
Fuel Tanker Services Market Regional Share


Fuel Tanker Services Market REPORT HIGHLIGHTS

AspectsDetails
Study Period 2019-2033
Base Year 2024
Estimated Year 2025
Forecast Period2025-2033
Historical Period2019-2024
Growth RateCAGR of 4.50% from 2019-2033
Segmentation
    • By Material Type
      • Carbon Steel
      • Stainless Steel
      • Aluminum Alloy
    • By Capacity
      • Below 20000 Liters
      • 30000 - 40000 Liters
      • Above 40000 Liters
    • By Fuel Type
      • Petrol
      • LNG
      • Other Fuels
    • By Operator
      • Retail Petrol Companies
      • Refineries
  • By Geography
    • North America
      • United States
      • Canada
      • Rest of North America
    • Europe
      • Germany
      • France
      • United Kingdom
      • Italy
      • Spain
      • NORDIC
      • Russia
      • Rest of Europe
    • Asia Pacific
      • China
      • India
      • Australia
      • Malaysia
      • Indonesia
      • Thailand
      • Vietnam
      • Rest of Asia Pacific
    • Middle East and Africa
      • Saudi Arabia
      • United Arab Emirates
      • South Africa
      • Nigeria
      • Rest of Middle East and Africa
      • Egypt
    • South America
      • Brazil
      • Argentina
      • Colombia
      • Rest of South America


Table of Contents

  1. 1. Introduction
    • 1.1. Research Scope
    • 1.2. Market Segmentation
    • 1.3. Research Methodology
    • 1.4. Definitions and Assumptions
  2. 2. Executive Summary
    • 2.1. Introduction
  3. 3. Market Dynamics
    • 3.1. Introduction
      • 3.2. Market Drivers
        • 3.2.1. 4.; Increasing Demand for Sales of Commercial Vehicles4.; Increasing Deployment of Retail Fuel Outlets Across Various Countries
      • 3.3. Market Restrains
        • 3.3.1. 4.; Growing Penetration and Demand for Electric Vehicles
      • 3.4. Market Trends
        • 3.4.1. The LNG Segment is Expected to Dominate the Market
  4. 4. Market Factor Analysis
    • 4.1. Porters Five Forces
    • 4.2. Supply/Value Chain
    • 4.3. PESTEL analysis
    • 4.4. Market Entropy
    • 4.5. Patent/Trademark Analysis
  5. 5. Global Fuel Tanker Services Market Analysis, Insights and Forecast, 2019-2031
    • 5.1. Market Analysis, Insights and Forecast - by Material Type
      • 5.1.1. Carbon Steel
      • 5.1.2. Stainless Steel
      • 5.1.3. Aluminum Alloy
    • 5.2. Market Analysis, Insights and Forecast - by Capacity
      • 5.2.1. Below 20000 Liters
      • 5.2.2. 30000 - 40000 Liters
      • 5.2.3. Above 40000 Liters
    • 5.3. Market Analysis, Insights and Forecast - by Fuel Type
      • 5.3.1. Petrol
      • 5.3.2. LNG
      • 5.3.3. Other Fuels
    • 5.4. Market Analysis, Insights and Forecast - by Operator
      • 5.4.1. Retail Petrol Companies
      • 5.4.2. Refineries
    • 5.5. Market Analysis, Insights and Forecast - by Region
      • 5.5.1. North America
      • 5.5.2. Europe
      • 5.5.3. Asia Pacific
      • 5.5.4. Middle East and Africa
      • 5.5.5. South America
  6. 6. North America Fuel Tanker Services Market Analysis, Insights and Forecast, 2019-2031
    • 6.1. Market Analysis, Insights and Forecast - by Material Type
      • 6.1.1. Carbon Steel
      • 6.1.2. Stainless Steel
      • 6.1.3. Aluminum Alloy
    • 6.2. Market Analysis, Insights and Forecast - by Capacity
      • 6.2.1. Below 20000 Liters
      • 6.2.2. 30000 - 40000 Liters
      • 6.2.3. Above 40000 Liters
    • 6.3. Market Analysis, Insights and Forecast - by Fuel Type
      • 6.3.1. Petrol
      • 6.3.2. LNG
      • 6.3.3. Other Fuels
    • 6.4. Market Analysis, Insights and Forecast - by Operator
      • 6.4.1. Retail Petrol Companies
      • 6.4.2. Refineries
  7. 7. Europe Fuel Tanker Services Market Analysis, Insights and Forecast, 2019-2031
    • 7.1. Market Analysis, Insights and Forecast - by Material Type
      • 7.1.1. Carbon Steel
      • 7.1.2. Stainless Steel
      • 7.1.3. Aluminum Alloy
    • 7.2. Market Analysis, Insights and Forecast - by Capacity
      • 7.2.1. Below 20000 Liters
      • 7.2.2. 30000 - 40000 Liters
      • 7.2.3. Above 40000 Liters
    • 7.3. Market Analysis, Insights and Forecast - by Fuel Type
      • 7.3.1. Petrol
      • 7.3.2. LNG
      • 7.3.3. Other Fuels
    • 7.4. Market Analysis, Insights and Forecast - by Operator
      • 7.4.1. Retail Petrol Companies
      • 7.4.2. Refineries
  8. 8. Asia Pacific Fuel Tanker Services Market Analysis, Insights and Forecast, 2019-2031
    • 8.1. Market Analysis, Insights and Forecast - by Material Type
      • 8.1.1. Carbon Steel
      • 8.1.2. Stainless Steel
      • 8.1.3. Aluminum Alloy
    • 8.2. Market Analysis, Insights and Forecast - by Capacity
      • 8.2.1. Below 20000 Liters
      • 8.2.2. 30000 - 40000 Liters
      • 8.2.3. Above 40000 Liters
    • 8.3. Market Analysis, Insights and Forecast - by Fuel Type
      • 8.3.1. Petrol
      • 8.3.2. LNG
      • 8.3.3. Other Fuels
    • 8.4. Market Analysis, Insights and Forecast - by Operator
      • 8.4.1. Retail Petrol Companies
      • 8.4.2. Refineries
  9. 9. Middle East and Africa Fuel Tanker Services Market Analysis, Insights and Forecast, 2019-2031
    • 9.1. Market Analysis, Insights and Forecast - by Material Type
      • 9.1.1. Carbon Steel
      • 9.1.2. Stainless Steel
      • 9.1.3. Aluminum Alloy
    • 9.2. Market Analysis, Insights and Forecast - by Capacity
      • 9.2.1. Below 20000 Liters
      • 9.2.2. 30000 - 40000 Liters
      • 9.2.3. Above 40000 Liters
    • 9.3. Market Analysis, Insights and Forecast - by Fuel Type
      • 9.3.1. Petrol
      • 9.3.2. LNG
      • 9.3.3. Other Fuels
    • 9.4. Market Analysis, Insights and Forecast - by Operator
      • 9.4.1. Retail Petrol Companies
      • 9.4.2. Refineries
  10. 10. South America Fuel Tanker Services Market Analysis, Insights and Forecast, 2019-2031
    • 10.1. Market Analysis, Insights and Forecast - by Material Type
      • 10.1.1. Carbon Steel
      • 10.1.2. Stainless Steel
      • 10.1.3. Aluminum Alloy
    • 10.2. Market Analysis, Insights and Forecast - by Capacity
      • 10.2.1. Below 20000 Liters
      • 10.2.2. 30000 - 40000 Liters
      • 10.2.3. Above 40000 Liters
    • 10.3. Market Analysis, Insights and Forecast - by Fuel Type
      • 10.3.1. Petrol
      • 10.3.2. LNG
      • 10.3.3. Other Fuels
    • 10.4. Market Analysis, Insights and Forecast - by Operator
      • 10.4.1. Retail Petrol Companies
      • 10.4.2. Refineries
  11. 11. North America Fuel Tanker Services Market Analysis, Insights and Forecast, 2019-2031
      • 11.1. Market Analysis, Insights and Forecast - By Country/Sub-region
        • 11.1.1 United States
        • 11.1.2 Canada
        • 11.1.3 Mexico
  12. 12. Europe Fuel Tanker Services Market Analysis, Insights and Forecast, 2019-2031
      • 12.1. Market Analysis, Insights and Forecast - By Country/Sub-region
        • 12.1.1 Germany
        • 12.1.2 United Kingdom
        • 12.1.3 France
        • 12.1.4 Spain
        • 12.1.5 Italy
        • 12.1.6 Spain
        • 12.1.7 Belgium
        • 12.1.8 Netherland
        • 12.1.9 Nordics
        • 12.1.10 Rest of Europe
  13. 13. Asia Pacific Fuel Tanker Services Market Analysis, Insights and Forecast, 2019-2031
      • 13.1. Market Analysis, Insights and Forecast - By Country/Sub-region
        • 13.1.1 China
        • 13.1.2 Japan
        • 13.1.3 India
        • 13.1.4 South Korea
        • 13.1.5 Southeast Asia
        • 13.1.6 Australia
        • 13.1.7 Indonesia
        • 13.1.8 Phillipes
        • 13.1.9 Singapore
        • 13.1.10 Thailandc
        • 13.1.11 Rest of Asia Pacific
  14. 14. South America Fuel Tanker Services Market Analysis, Insights and Forecast, 2019-2031
      • 14.1. Market Analysis, Insights and Forecast - By Country/Sub-region
        • 14.1.1 Brazil
        • 14.1.2 Argentina
        • 14.1.3 Peru
        • 14.1.4 Chile
        • 14.1.5 Colombia
        • 14.1.6 Ecuador
        • 14.1.7 Venezuela
        • 14.1.8 Rest of South America
  15. 15. North America Fuel Tanker Services Market Analysis, Insights and Forecast, 2019-2031
      • 15.1. Market Analysis, Insights and Forecast - By Country/Sub-region
        • 15.1.1 United States
        • 15.1.2 Canada
        • 15.1.3 Mexico
  16. 16. MEA Fuel Tanker Services Market Analysis, Insights and Forecast, 2019-2031
      • 16.1. Market Analysis, Insights and Forecast - By Country/Sub-region
        • 16.1.1 United Arab Emirates
        • 16.1.2 Saudi Arabia
        • 16.1.3 South Africa
        • 16.1.4 Rest of Middle East and Africa
  17. 17. Competitive Analysis
    • 17.1. Global Market Share Analysis 2024
      • 17.2. Company Profiles
        • 17.2.1 Compass Fuel Oils Ltd
          • 17.2.1.1. Overview
          • 17.2.1.2. Products
          • 17.2.1.3. SWOT Analysis
          • 17.2.1.4. Recent Developments
          • 17.2.1.5. Financials (Based on Availability)
        • 17.2.2 Rigual SA
          • 17.2.2.1. Overview
          • 17.2.2.2. Products
          • 17.2.2.3. SWOT Analysis
          • 17.2.2.4. Recent Developments
          • 17.2.2.5. Financials (Based on Availability)
        • 17.2.3 Crown Oil Ltd
          • 17.2.3.1. Overview
          • 17.2.3.2. Products
          • 17.2.3.3. SWOT Analysis
          • 17.2.3.4. Recent Developments
          • 17.2.3.5. Financials (Based on Availability)
        • 17.2.4 Shell International Trading and Shipping Company Limited*List Not Exhaustive
          • 17.2.4.1. Overview
          • 17.2.4.2. Products
          • 17.2.4.3. SWOT Analysis
          • 17.2.4.4. Recent Developments
          • 17.2.4.5. Financials (Based on Availability)
        • 17.2.5 Certas Energy UK Limited
          • 17.2.5.1. Overview
          • 17.2.5.2. Products
          • 17.2.5.3. SWOT Analysis
          • 17.2.5.4. Recent Developments
          • 17.2.5.5. Financials (Based on Availability)

List of Figures

  1. Figure 1: Global Fuel Tanker Services Market Revenue Breakdown (Million, %) by Region 2024 & 2032
  2. Figure 2: North America Fuel Tanker Services Market Revenue (Million), by Country 2024 & 2032
  3. Figure 3: North America Fuel Tanker Services Market Revenue Share (%), by Country 2024 & 2032
  4. Figure 4: Europe Fuel Tanker Services Market Revenue (Million), by Country 2024 & 2032
  5. Figure 5: Europe Fuel Tanker Services Market Revenue Share (%), by Country 2024 & 2032
  6. Figure 6: Asia Pacific Fuel Tanker Services Market Revenue (Million), by Country 2024 & 2032
  7. Figure 7: Asia Pacific Fuel Tanker Services Market Revenue Share (%), by Country 2024 & 2032
  8. Figure 8: South America Fuel Tanker Services Market Revenue (Million), by Country 2024 & 2032
  9. Figure 9: South America Fuel Tanker Services Market Revenue Share (%), by Country 2024 & 2032
  10. Figure 10: North America Fuel Tanker Services Market Revenue (Million), by Country 2024 & 2032
  11. Figure 11: North America Fuel Tanker Services Market Revenue Share (%), by Country 2024 & 2032
  12. Figure 12: MEA Fuel Tanker Services Market Revenue (Million), by Country 2024 & 2032
  13. Figure 13: MEA Fuel Tanker Services Market Revenue Share (%), by Country 2024 & 2032
  14. Figure 14: North America Fuel Tanker Services Market Revenue (Million), by Material Type 2024 & 2032
  15. Figure 15: North America Fuel Tanker Services Market Revenue Share (%), by Material Type 2024 & 2032
  16. Figure 16: North America Fuel Tanker Services Market Revenue (Million), by Capacity 2024 & 2032
  17. Figure 17: North America Fuel Tanker Services Market Revenue Share (%), by Capacity 2024 & 2032
  18. Figure 18: North America Fuel Tanker Services Market Revenue (Million), by Fuel Type 2024 & 2032
  19. Figure 19: North America Fuel Tanker Services Market Revenue Share (%), by Fuel Type 2024 & 2032
  20. Figure 20: North America Fuel Tanker Services Market Revenue (Million), by Operator 2024 & 2032
  21. Figure 21: North America Fuel Tanker Services Market Revenue Share (%), by Operator 2024 & 2032
  22. Figure 22: North America Fuel Tanker Services Market Revenue (Million), by Country 2024 & 2032
  23. Figure 23: North America Fuel Tanker Services Market Revenue Share (%), by Country 2024 & 2032
  24. Figure 24: Europe Fuel Tanker Services Market Revenue (Million), by Material Type 2024 & 2032
  25. Figure 25: Europe Fuel Tanker Services Market Revenue Share (%), by Material Type 2024 & 2032
  26. Figure 26: Europe Fuel Tanker Services Market Revenue (Million), by Capacity 2024 & 2032
  27. Figure 27: Europe Fuel Tanker Services Market Revenue Share (%), by Capacity 2024 & 2032
  28. Figure 28: Europe Fuel Tanker Services Market Revenue (Million), by Fuel Type 2024 & 2032
  29. Figure 29: Europe Fuel Tanker Services Market Revenue Share (%), by Fuel Type 2024 & 2032
  30. Figure 30: Europe Fuel Tanker Services Market Revenue (Million), by Operator 2024 & 2032
  31. Figure 31: Europe Fuel Tanker Services Market Revenue Share (%), by Operator 2024 & 2032
  32. Figure 32: Europe Fuel Tanker Services Market Revenue (Million), by Country 2024 & 2032
  33. Figure 33: Europe Fuel Tanker Services Market Revenue Share (%), by Country 2024 & 2032
  34. Figure 34: Asia Pacific Fuel Tanker Services Market Revenue (Million), by Material Type 2024 & 2032
  35. Figure 35: Asia Pacific Fuel Tanker Services Market Revenue Share (%), by Material Type 2024 & 2032
  36. Figure 36: Asia Pacific Fuel Tanker Services Market Revenue (Million), by Capacity 2024 & 2032
  37. Figure 37: Asia Pacific Fuel Tanker Services Market Revenue Share (%), by Capacity 2024 & 2032
  38. Figure 38: Asia Pacific Fuel Tanker Services Market Revenue (Million), by Fuel Type 2024 & 2032
  39. Figure 39: Asia Pacific Fuel Tanker Services Market Revenue Share (%), by Fuel Type 2024 & 2032
  40. Figure 40: Asia Pacific Fuel Tanker Services Market Revenue (Million), by Operator 2024 & 2032
  41. Figure 41: Asia Pacific Fuel Tanker Services Market Revenue Share (%), by Operator 2024 & 2032
  42. Figure 42: Asia Pacific Fuel Tanker Services Market Revenue (Million), by Country 2024 & 2032
  43. Figure 43: Asia Pacific Fuel Tanker Services Market Revenue Share (%), by Country 2024 & 2032
  44. Figure 44: Middle East and Africa Fuel Tanker Services Market Revenue (Million), by Material Type 2024 & 2032
  45. Figure 45: Middle East and Africa Fuel Tanker Services Market Revenue Share (%), by Material Type 2024 & 2032
  46. Figure 46: Middle East and Africa Fuel Tanker Services Market Revenue (Million), by Capacity 2024 & 2032
  47. Figure 47: Middle East and Africa Fuel Tanker Services Market Revenue Share (%), by Capacity 2024 & 2032
  48. Figure 48: Middle East and Africa Fuel Tanker Services Market Revenue (Million), by Fuel Type 2024 & 2032
  49. Figure 49: Middle East and Africa Fuel Tanker Services Market Revenue Share (%), by Fuel Type 2024 & 2032
  50. Figure 50: Middle East and Africa Fuel Tanker Services Market Revenue (Million), by Operator 2024 & 2032
  51. Figure 51: Middle East and Africa Fuel Tanker Services Market Revenue Share (%), by Operator 2024 & 2032
  52. Figure 52: Middle East and Africa Fuel Tanker Services Market Revenue (Million), by Country 2024 & 2032
  53. Figure 53: Middle East and Africa Fuel Tanker Services Market Revenue Share (%), by Country 2024 & 2032
  54. Figure 54: South America Fuel Tanker Services Market Revenue (Million), by Material Type 2024 & 2032
  55. Figure 55: South America Fuel Tanker Services Market Revenue Share (%), by Material Type 2024 & 2032
  56. Figure 56: South America Fuel Tanker Services Market Revenue (Million), by Capacity 2024 & 2032
  57. Figure 57: South America Fuel Tanker Services Market Revenue Share (%), by Capacity 2024 & 2032
  58. Figure 58: South America Fuel Tanker Services Market Revenue (Million), by Fuel Type 2024 & 2032
  59. Figure 59: South America Fuel Tanker Services Market Revenue Share (%), by Fuel Type 2024 & 2032
  60. Figure 60: South America Fuel Tanker Services Market Revenue (Million), by Operator 2024 & 2032
  61. Figure 61: South America Fuel Tanker Services Market Revenue Share (%), by Operator 2024 & 2032
  62. Figure 62: South America Fuel Tanker Services Market Revenue (Million), by Country 2024 & 2032
  63. Figure 63: South America Fuel Tanker Services Market Revenue Share (%), by Country 2024 & 2032

List of Tables

  1. Table 1: Global Fuel Tanker Services Market Revenue Million Forecast, by Region 2019 & 2032
  2. Table 2: Global Fuel Tanker Services Market Revenue Million Forecast, by Material Type 2019 & 2032
  3. Table 3: Global Fuel Tanker Services Market Revenue Million Forecast, by Capacity 2019 & 2032
  4. Table 4: Global Fuel Tanker Services Market Revenue Million Forecast, by Fuel Type 2019 & 2032
  5. Table 5: Global Fuel Tanker Services Market Revenue Million Forecast, by Operator 2019 & 2032
  6. Table 6: Global Fuel Tanker Services Market Revenue Million Forecast, by Region 2019 & 2032
  7. Table 7: Global Fuel Tanker Services Market Revenue Million Forecast, by Country 2019 & 2032
  8. Table 8: United States Fuel Tanker Services Market Revenue (Million) Forecast, by Application 2019 & 2032
  9. Table 9: Canada Fuel Tanker Services Market Revenue (Million) Forecast, by Application 2019 & 2032
  10. Table 10: Mexico Fuel Tanker Services Market Revenue (Million) Forecast, by Application 2019 & 2032
  11. Table 11: Global Fuel Tanker Services Market Revenue Million Forecast, by Country 2019 & 2032
  12. Table 12: Germany Fuel Tanker Services Market Revenue (Million) Forecast, by Application 2019 & 2032
  13. Table 13: United Kingdom Fuel Tanker Services Market Revenue (Million) Forecast, by Application 2019 & 2032
  14. Table 14: France Fuel Tanker Services Market Revenue (Million) Forecast, by Application 2019 & 2032
  15. Table 15: Spain Fuel Tanker Services Market Revenue (Million) Forecast, by Application 2019 & 2032
  16. Table 16: Italy Fuel Tanker Services Market Revenue (Million) Forecast, by Application 2019 & 2032
  17. Table 17: Spain Fuel Tanker Services Market Revenue (Million) Forecast, by Application 2019 & 2032
  18. Table 18: Belgium Fuel Tanker Services Market Revenue (Million) Forecast, by Application 2019 & 2032
  19. Table 19: Netherland Fuel Tanker Services Market Revenue (Million) Forecast, by Application 2019 & 2032
  20. Table 20: Nordics Fuel Tanker Services Market Revenue (Million) Forecast, by Application 2019 & 2032
  21. Table 21: Rest of Europe Fuel Tanker Services Market Revenue (Million) Forecast, by Application 2019 & 2032
  22. Table 22: Global Fuel Tanker Services Market Revenue Million Forecast, by Country 2019 & 2032
  23. Table 23: China Fuel Tanker Services Market Revenue (Million) Forecast, by Application 2019 & 2032
  24. Table 24: Japan Fuel Tanker Services Market Revenue (Million) Forecast, by Application 2019 & 2032
  25. Table 25: India Fuel Tanker Services Market Revenue (Million) Forecast, by Application 2019 & 2032
  26. Table 26: South Korea Fuel Tanker Services Market Revenue (Million) Forecast, by Application 2019 & 2032
  27. Table 27: Southeast Asia Fuel Tanker Services Market Revenue (Million) Forecast, by Application 2019 & 2032
  28. Table 28: Australia Fuel Tanker Services Market Revenue (Million) Forecast, by Application 2019 & 2032
  29. Table 29: Indonesia Fuel Tanker Services Market Revenue (Million) Forecast, by Application 2019 & 2032
  30. Table 30: Phillipes Fuel Tanker Services Market Revenue (Million) Forecast, by Application 2019 & 2032
  31. Table 31: Singapore Fuel Tanker Services Market Revenue (Million) Forecast, by Application 2019 & 2032
  32. Table 32: Thailandc Fuel Tanker Services Market Revenue (Million) Forecast, by Application 2019 & 2032
  33. Table 33: Rest of Asia Pacific Fuel Tanker Services Market Revenue (Million) Forecast, by Application 2019 & 2032
  34. Table 34: Global Fuel Tanker Services Market Revenue Million Forecast, by Country 2019 & 2032
  35. Table 35: Brazil Fuel Tanker Services Market Revenue (Million) Forecast, by Application 2019 & 2032
  36. Table 36: Argentina Fuel Tanker Services Market Revenue (Million) Forecast, by Application 2019 & 2032
  37. Table 37: Peru Fuel Tanker Services Market Revenue (Million) Forecast, by Application 2019 & 2032
  38. Table 38: Chile Fuel Tanker Services Market Revenue (Million) Forecast, by Application 2019 & 2032
  39. Table 39: Colombia Fuel Tanker Services Market Revenue (Million) Forecast, by Application 2019 & 2032
  40. Table 40: Ecuador Fuel Tanker Services Market Revenue (Million) Forecast, by Application 2019 & 2032
  41. Table 41: Venezuela Fuel Tanker Services Market Revenue (Million) Forecast, by Application 2019 & 2032
  42. Table 42: Rest of South America Fuel Tanker Services Market Revenue (Million) Forecast, by Application 2019 & 2032
  43. Table 43: Global Fuel Tanker Services Market Revenue Million Forecast, by Country 2019 & 2032
  44. Table 44: United States Fuel Tanker Services Market Revenue (Million) Forecast, by Application 2019 & 2032
  45. Table 45: Canada Fuel Tanker Services Market Revenue (Million) Forecast, by Application 2019 & 2032
  46. Table 46: Mexico Fuel Tanker Services Market Revenue (Million) Forecast, by Application 2019 & 2032
  47. Table 47: Global Fuel Tanker Services Market Revenue Million Forecast, by Country 2019 & 2032
  48. Table 48: United Arab Emirates Fuel Tanker Services Market Revenue (Million) Forecast, by Application 2019 & 2032
  49. Table 49: Saudi Arabia Fuel Tanker Services Market Revenue (Million) Forecast, by Application 2019 & 2032
  50. Table 50: South Africa Fuel Tanker Services Market Revenue (Million) Forecast, by Application 2019 & 2032
  51. Table 51: Rest of Middle East and Africa Fuel Tanker Services Market Revenue (Million) Forecast, by Application 2019 & 2032
  52. Table 52: Global Fuel Tanker Services Market Revenue Million Forecast, by Material Type 2019 & 2032
  53. Table 53: Global Fuel Tanker Services Market Revenue Million Forecast, by Capacity 2019 & 2032
  54. Table 54: Global Fuel Tanker Services Market Revenue Million Forecast, by Fuel Type 2019 & 2032
  55. Table 55: Global Fuel Tanker Services Market Revenue Million Forecast, by Operator 2019 & 2032
  56. Table 56: Global Fuel Tanker Services Market Revenue Million Forecast, by Country 2019 & 2032
  57. Table 57: United States Fuel Tanker Services Market Revenue (Million) Forecast, by Application 2019 & 2032
  58. Table 58: Canada Fuel Tanker Services Market Revenue (Million) Forecast, by Application 2019 & 2032
  59. Table 59: Rest of North America Fuel Tanker Services Market Revenue (Million) Forecast, by Application 2019 & 2032
  60. Table 60: Global Fuel Tanker Services Market Revenue Million Forecast, by Material Type 2019 & 2032
  61. Table 61: Global Fuel Tanker Services Market Revenue Million Forecast, by Capacity 2019 & 2032
  62. Table 62: Global Fuel Tanker Services Market Revenue Million Forecast, by Fuel Type 2019 & 2032
  63. Table 63: Global Fuel Tanker Services Market Revenue Million Forecast, by Operator 2019 & 2032
  64. Table 64: Global Fuel Tanker Services Market Revenue Million Forecast, by Country 2019 & 2032
  65. Table 65: Germany Fuel Tanker Services Market Revenue (Million) Forecast, by Application 2019 & 2032
  66. Table 66: France Fuel Tanker Services Market Revenue (Million) Forecast, by Application 2019 & 2032
  67. Table 67: United Kingdom Fuel Tanker Services Market Revenue (Million) Forecast, by Application 2019 & 2032
  68. Table 68: Italy Fuel Tanker Services Market Revenue (Million) Forecast, by Application 2019 & 2032
  69. Table 69: Spain Fuel Tanker Services Market Revenue (Million) Forecast, by Application 2019 & 2032
  70. Table 70: NORDIC Fuel Tanker Services Market Revenue (Million) Forecast, by Application 2019 & 2032
  71. Table 71: Russia Fuel Tanker Services Market Revenue (Million) Forecast, by Application 2019 & 2032
  72. Table 72: Rest of Europe Fuel Tanker Services Market Revenue (Million) Forecast, by Application 2019 & 2032
  73. Table 73: Global Fuel Tanker Services Market Revenue Million Forecast, by Material Type 2019 & 2032
  74. Table 74: Global Fuel Tanker Services Market Revenue Million Forecast, by Capacity 2019 & 2032
  75. Table 75: Global Fuel Tanker Services Market Revenue Million Forecast, by Fuel Type 2019 & 2032
  76. Table 76: Global Fuel Tanker Services Market Revenue Million Forecast, by Operator 2019 & 2032
  77. Table 77: Global Fuel Tanker Services Market Revenue Million Forecast, by Country 2019 & 2032
  78. Table 78: China Fuel Tanker Services Market Revenue (Million) Forecast, by Application 2019 & 2032
  79. Table 79: India Fuel Tanker Services Market Revenue (Million) Forecast, by Application 2019 & 2032
  80. Table 80: Australia Fuel Tanker Services Market Revenue (Million) Forecast, by Application 2019 & 2032
  81. Table 81: Malaysia Fuel Tanker Services Market Revenue (Million) Forecast, by Application 2019 & 2032
  82. Table 82: Indonesia Fuel Tanker Services Market Revenue (Million) Forecast, by Application 2019 & 2032
  83. Table 83: Thailand Fuel Tanker Services Market Revenue (Million) Forecast, by Application 2019 & 2032
  84. Table 84: Vietnam Fuel Tanker Services Market Revenue (Million) Forecast, by Application 2019 & 2032
  85. Table 85: Rest of Asia Pacific Fuel Tanker Services Market Revenue (Million) Forecast, by Application 2019 & 2032
  86. Table 86: Global Fuel Tanker Services Market Revenue Million Forecast, by Material Type 2019 & 2032
  87. Table 87: Global Fuel Tanker Services Market Revenue Million Forecast, by Capacity 2019 & 2032
  88. Table 88: Global Fuel Tanker Services Market Revenue Million Forecast, by Fuel Type 2019 & 2032
  89. Table 89: Global Fuel Tanker Services Market Revenue Million Forecast, by Operator 2019 & 2032
  90. Table 90: Global Fuel Tanker Services Market Revenue Million Forecast, by Country 2019 & 2032
  91. Table 91: Saudi Arabia Fuel Tanker Services Market Revenue (Million) Forecast, by Application 2019 & 2032
  92. Table 92: United Arab Emirates Fuel Tanker Services Market Revenue (Million) Forecast, by Application 2019 & 2032
  93. Table 93: South Africa Fuel Tanker Services Market Revenue (Million) Forecast, by Application 2019 & 2032
  94. Table 94: Nigeria Fuel Tanker Services Market Revenue (Million) Forecast, by Application 2019 & 2032
  95. Table 95: Rest of Middle East and Africa Fuel Tanker Services Market Revenue (Million) Forecast, by Application 2019 & 2032
  96. Table 96: Egypt Fuel Tanker Services Market Revenue (Million) Forecast, by Application 2019 & 2032
  97. Table 97: Global Fuel Tanker Services Market Revenue Million Forecast, by Material Type 2019 & 2032
  98. Table 98: Global Fuel Tanker Services Market Revenue Million Forecast, by Capacity 2019 & 2032
  99. Table 99: Global Fuel Tanker Services Market Revenue Million Forecast, by Fuel Type 2019 & 2032
  100. Table 100: Global Fuel Tanker Services Market Revenue Million Forecast, by Operator 2019 & 2032
  101. Table 101: Global Fuel Tanker Services Market Revenue Million Forecast, by Country 2019 & 2032
  102. Table 102: Brazil Fuel Tanker Services Market Revenue (Million) Forecast, by Application 2019 & 2032
  103. Table 103: Argentina Fuel Tanker Services Market Revenue (Million) Forecast, by Application 2019 & 2032
  104. Table 104: Colombia Fuel Tanker Services Market Revenue (Million) Forecast, by Application 2019 & 2032
  105. Table 105: Rest of South America Fuel Tanker Services Market Revenue (Million) Forecast, by Application 2019 & 2032


Frequently Asked Questions

1. What is the projected Compound Annual Growth Rate (CAGR) of the Fuel Tanker Services Market?

The projected CAGR is approximately 4.50%.

2. Which companies are prominent players in the Fuel Tanker Services Market?

Key companies in the market include Compass Fuel Oils Ltd, Rigual SA, Crown Oil Ltd, Shell International Trading and Shipping Company Limited*List Not Exhaustive, Certas Energy UK Limited.

3. What are the main segments of the Fuel Tanker Services Market?

The market segments include Material Type, Capacity, Fuel Type, Operator.

4. Can you provide details about the market size?

The market size is estimated to be USD 5.60 Million as of 2022.

5. What are some drivers contributing to market growth?

4.; Increasing Demand for Sales of Commercial Vehicles4.; Increasing Deployment of Retail Fuel Outlets Across Various Countries.

6. What are the notable trends driving market growth?

The LNG Segment is Expected to Dominate the Market.

7. Are there any restraints impacting market growth?

4.; Growing Penetration and Demand for Electric Vehicles.

8. Can you provide examples of recent developments in the market?

January 2024: Compass Fuel Oils Ltd announced the acquisition of a new Arctic fuel tanker, marking a significant addition to their expanding fleet at their headquarters in Preston, United Kingdom. This latest addition underscores the company’s commitment to enhancing its capacity.

9. What pricing options are available for accessing the report?

Pricing options include single-user, multi-user, and enterprise licenses priced at USD 4750, USD 5250, and USD 8750 respectively.

10. Is the market size provided in terms of value or volume?

The market size is provided in terms of value, measured in Million.

11. Are there any specific market keywords associated with the report?

Yes, the market keyword associated with the report is "Fuel Tanker Services Market," which aids in identifying and referencing the specific market segment covered.

12. How do I determine which pricing option suits my needs best?

The pricing options vary based on user requirements and access needs. Individual users may opt for single-user licenses, while businesses requiring broader access may choose multi-user or enterprise licenses for cost-effective access to the report.

13. Are there any additional resources or data provided in the Fuel Tanker Services Market report?

While the report offers comprehensive insights, it's advisable to review the specific contents or supplementary materials provided to ascertain if additional resources or data are available.

14. How can I stay updated on further developments or reports in the Fuel Tanker Services Market?

To stay informed about further developments, trends, and reports in the Fuel Tanker Services Market, consider subscribing to industry newsletters, following relevant companies and organizations, or regularly checking reputable industry news sources and publications.


Methodology

Step 1 - Identification of Relevant Samples Size from Population Database

Step Chart
Bar Chart
Method Chart

Step 2 - Approaches for Defining Global Market Size (Value, Volume* & Price*)

Approach Chart
Top-down and bottom-up approaches are used to validate the global market size and estimate the market size for manufactures, regional segments, product, and application.

Note*: In applicable scenarios

Step 3 - Data Sources

Primary Research

  • Web Analytics
  • Survey Reports
  • Research Institute
  • Latest Research Reports
  • Opinion Leaders

Secondary Research

  • Annual Reports
  • White Paper
  • Latest Press Release
  • Industry Association
  • Paid Database
  • Investor Presentations
Analyst Chart

Step 4 - Data Triangulation

Involves using different sources of information in order to increase the validity of a study

These sources are likely to be stakeholders in a program - participants, other researchers, program staff, other community members, and so on.

Then we put all data in single framework & apply various statistical tools to find out the dynamic on the market.

During the analysis stage, feedback from the stakeholder groups would be compared to determine areas of agreement as well as areas of divergence

Additionally, after gathering mixed and scattered data from a wide range of sources, data is triangulated and correlated to come up with estimated figures which are further validated through primary mediums or industry experts, opinion leaders.

About Visionary Data Reports

Visionary Data Reports provides future-focused market research, advanced analytics, and strategic insights for technology, healthcare, green energy, and finance. Our reports help you anticipate trends, innovate, and lead in your industry. Our expert team combines primary research, data science, and industry knowledge to deliver actionable intelligence. We offer syndicated reports, custom analytics, and consulting services tailored to your business needs. At Visionary Data Reports, we are committed to quality, transparency, and client satisfaction. Every report is rigorously validated to ensure accuracy and relevance. Our global perspective and forward-thinking approach help you understand both current and emerging market dynamics.

Stay ahead with Visionary Data Reports. Subscribe to our newsletter for the latest insights and research highlights, and follow us on social media for real-time updates. Visionary Data Reports – Your Guide to Tomorrow’s Opportunities.

artwork spiralartwork spiralRelated Reports
artwork underline

Strategizing Growth: Asia Pacific Liquid Hydrogen Market Market’s Decade Ahead 2025-2033

The Asia-Pacific liquid hydrogen market is booming, projected to reach [Value from chart_data for 2033] million by 2033, driven by automotive, chemical, and aerospace sectors. Explore key trends, drivers, restraints, and leading companies in this rapidly expanding market.

August 2025
Base Year: 2024
No Of Pages: 234
Price: $4750

Energy Storage in United Kingdom Market Market Dynamics: Drivers and Barriers to Growth 2025-2033

Discover the booming UK energy storage market! This in-depth analysis reveals key trends, growth drivers, market size projections (2025-2033), leading companies, and regional insights. Learn about battery storage, pumped hydro, and other technologies shaping the UK's energy future.

August 2025
Base Year: 2024
No Of Pages: 197
Price: $3800

South America Intelligent Pigging Market Market’s Evolution: Key Growth Drivers 2025-2033

Discover the booming South American intelligent pigging market! This in-depth analysis reveals a CAGR exceeding 4%, driven by aging pipelines and stringent safety regulations. Learn about market trends, key players (Baker Hughes, Rosen Group), and future growth projections for oil & gas pipeline inspection.

August 2025
Base Year: 2024
No Of Pages: 234
Price: $4750

Solar Energy Market in Romania 2025-2033: Preparing for Growth and Change

Discover the booming Romanian solar energy market! This in-depth analysis reveals a CAGR of 18.50%, driven by government incentives, falling costs, and growing demand. Explore market size, key segments (residential, commercial, utility-scale), leading companies, and future trends until 2033.

August 2025
Base Year: 2024
No Of Pages: 197
Price: $3800

Oman Oil and Gas Pipeline Market Unlocking Growth Potential: 2025-2033 Analysis and Forecasts

Discover the booming Oman oil and gas pipeline market, projected to exceed $2.57 billion by 2033. Explore market drivers, trends, and key players shaping this dynamic sector's future. Learn about onshore vs. offshore segments, crude oil vs. gas pipelines, and investment opportunities in this high-growth region.

August 2025
Base Year: 2024
No Of Pages: 197
Price: $3800

Wind Turbine Refurbishment Industry Market Demand and Consumption Trends: Outlook 2025-2033

Booming wind turbine refurbishment market analysis reveals a CAGR exceeding 3.53%, driven by aging infrastructure and cost-effective maintenance. Explore key trends, regional insights, and leading companies shaping this multi-billion dollar industry's future in our comprehensive report.

August 2025
Base Year: 2024
No Of Pages: 234
Price: $4750

Power Quality Meter Industry Growth Forecast and Consumer Insights

Discover the booming power quality meter market! This comprehensive analysis reveals a CAGR of 7.40% through 2033, driven by industrial automation and renewable energy. Explore key players, regional trends, and market segmentation for informed business decisions.

August 2025
Base Year: 2024
No Of Pages: 234
Price: $4750

North America Distribution Transformer Industry Market Drivers and Challenges: Trends 2025-2033

The North American distribution transformer market is booming, projected to reach \$[insert projected 2033 value based on chart data] billion by 2033, driven by grid modernization, renewable energy integration, and smart grid technologies. Discover key trends, market segmentation, and leading players in this dynamic industry.

August 2025
Base Year: 2024
No Of Pages: 234
Price: $4750

France Nuclear Power Reactor Decommissioning Market Trends and Forecast 2025-2033

The France Nuclear Power Reactor Decommissioning market is experiencing robust growth (CAGR >4%), driven by aging reactors and stringent regulations. Explore market size, trends, key players (Orano SA, EDF), and future projections (2025-2033) in this comprehensive analysis.

August 2025
Base Year: 2024
No Of Pages: 197
Price: $3800

Brazil Oil and Gas Downstream Market Consumer Behavior Dynamics: Key Trends 2025-2033

Discover the booming Brazil oil and gas downstream market! Our in-depth analysis reveals a CAGR exceeding 5.13% through 2033, driven by automotive growth and biofuel initiatives. Explore market size, key players (Petrobras, Shell, ExxonMobil), and regional trends. Invest wisely in this dynamic sector.

August 2025
Base Year: 2024
No Of Pages: 197
Price: $3800

Japan Nuclear Power Reactor Decommissioning Market Analysis Uncovered: Market Drivers and Forecasts 2025-2033

Discover the booming Japan Nuclear Power Reactor Decommissioning market. Explore market size, CAGR, key drivers, trends, and challenges impacting this $1.5B+ sector, with insights into leading companies and regional analysis (2019-2033).

August 2025
Base Year: 2024
No Of Pages: 197
Price: $3800

North America Artificial Lift Systems Market Market’s Evolution: Key Growth Drivers 2025-2033

The North American Artificial Lift Systems market is booming, projected to exceed $3.8 billion by 2033, driven by surging oil & gas production and technological advancements in ESPs, PCPs, and gas lift systems. Learn about key market trends, leading companies, and regional insights in this comprehensive analysis.

August 2025
Base Year: 2024
No Of Pages: 234
Price: $4750

North America AI-Powered Energy Storage Market Unlocking Growth Potential: Analysis and Forecasts 2025-2033

Discover the explosive growth of the North American AI-powered energy storage market. This in-depth analysis reveals a CAGR of 46.35%, driven by renewable energy adoption, AI optimization, and key players like Tesla and BYD. Explore market trends, segmentation, and future projections for 2025-2033.

August 2025
Base Year: 2024
No Of Pages: 234
Price: $4750

Navigating India Petrol Station Market Market Trends: Competitor Analysis and Growth 2025-2033

Discover the booming India petrol station market! This comprehensive analysis reveals a ₹250 billion (USD 30 billion) market growing at a CAGR exceeding 5% until 2033, driven by rising vehicle ownership and economic growth. Learn about key players, regional trends, and future projections.

August 2025
Base Year: 2024
No Of Pages: 197
Price: $3800

France Wind Energy Market Growth Opportunities: Market Size Forecast to 2033

Discover the booming France wind energy market forecast to 2033! This in-depth analysis reveals a CAGR of 7.43%, driven by government initiatives and technological advancements. Explore key players, market segments (onshore & offshore), and growth challenges.

August 2025
Base Year: 2024
No Of Pages: 197
Price: $3800

APAC Offshore Support Market CAGR Trends: Growth Outlook 2025-2033

Discover the booming APAC offshore support vessel market, projected to exceed a massive valuation by 2033. Explore key drivers like renewable energy growth, regional economic expansion, and leading companies shaping this dynamic sector. Analyze market trends and future forecasts in this in-depth analysis.

August 2025
Base Year: 2024
No Of Pages: 234
Price: $4750

East Asia Battery Market Market’s Tech Revolution: Projections to 2033

Discover the explosive growth of the East Asia battery market! This comprehensive analysis reveals key trends, driving forces, and leading players shaping the future of EV, energy storage, and data center technologies in China, Japan, South Korea and beyond. Project your market strategies with our insightful forecast through 2033.

August 2025
Base Year: 2024
No Of Pages: 234
Price: $4750

Drill Pipe Industry Report Probes the XXX Million Size, Share, Growth Report and Future Analysis by 2033

Discover the booming drill pipe market! Explore its $XX million valuation, 4.5%+ CAGR, key drivers, regional insights (North America, Europe, Asia-Pacific), top players (NOV, TMK, Tenaris), and future trends in this comprehensive market analysis covering 2019-2033. Learn about onshore vs. offshore deployment and the impact of technological advancements.

August 2025
Base Year: 2024
No Of Pages: 234
Price: $4750

Renewable Energy Market in Germany Market Disruption: Competitor Insights and Trends 2025-2033

Discover the booming German renewable energy market! This in-depth analysis reveals a €5 billion (2025 estimate) market with a 7.27% CAGR, driven by strong government policies and technological advancements. Explore key players, regional trends, and growth projections for solar, wind, hydro, and bioenergy sectors until 2033.

August 2025
Base Year: 2024
No Of Pages: 197
Price: $3800

MEA Power Rental Industry Report Probes the XXX Million Size, Share, Growth Report and Future Analysis by 2033

Discover the booming MEA power rental market! Our analysis reveals a CAGR exceeding 9.68%, driven by infrastructure growth & energy demands. Explore key trends, segments (prime power, peak shaving, emergency standby), and leading companies shaping this dynamic industry. Learn more about market size, regional breakdown, and future projections.

August 2025
Base Year: 2024
No Of Pages: 234
Price: $4750

Thailand Oil and Gas Industry Market Report: Strategic Insights

Discover the future of Thailand's oil and gas industry. This in-depth market analysis reveals a steady growth trajectory (CAGR 2.33%), driven by industrial and transportation demands, while outlining challenges such as price volatility and the global shift towards renewables. Learn about key players, market segmentation, and regional trends.

August 2025
Base Year: 2024
No Of Pages: 197
Price: $3800

LNG as a Fuel Industry Strategic Insights: Analysis 2025 and Forecasts 2033

Discover the booming LNG as fuel market! This comprehensive analysis reveals key trends, drivers, and restraints, projecting a CAGR >8% through 2033. Explore regional market shares, leading companies, and the future of LNG in transportation and power generation.

August 2025
Base Year: 2024
No Of Pages: 234
Price: $4750

Exploring Opportunities in North Sea Offshore Helicopter Services Market Sector

Discover the booming North Sea Offshore Helicopter Services market. This in-depth analysis reveals key trends, growth drivers (offshore wind, oil & gas), and challenges for 2025-2033, including regional market share and leading companies like Airbus and Bristow. Explore market size, CAGR, and future projections for this vital sector.

August 2025
Base Year: 2024
No Of Pages: 234
Price: $4750

Polymer Photovoltaic Cell Market Market Expansion: Growth Outlook 2025-2033

The Polymer Photovoltaic Cell market is booming, with a projected CAGR of 21.40% to 2033. Discover key trends, drivers, and restraints shaping this dynamic sector, including insights into organic vs. inorganic materials, flexible vs. rigid form factors, and leading companies. Explore regional market shares and growth projections.

August 2025
Base Year: 2024
No Of Pages: 234
Price: $4750

Future Forecasts for Chile Renewable Energy Industry Industry Growth

Discover the booming Chilean renewable energy market! Explore its 9%+ CAGR, key drivers, leading companies (JinkoSolar, First Solar, Vestas), and segment analysis (solar, wind, hydro). Learn about market forecasts and investment opportunities in this rapidly expanding sector.

August 2025
Base Year: 2024
No Of Pages: 197
Price: $3800

North West Europe Diesel Generator Market Future-proof Strategies: Trends, Competitor Dynamics, and Opportunities 2025-2033

The North West Europe diesel generator market is booming, driven by industrial growth and the need for reliable backup power. Discover key trends, market size projections (2025-2033), leading companies, and regional breakdowns in this comprehensive market analysis. Explore growth drivers, restraints, and segment analysis (capacity, end-user, application) for this dynamic sector.

August 2025
Base Year: 2024
No Of Pages: 234
Price: $4750

Open Hole Logging Services Market Market Dynamics: Drivers and Barriers to Growth 2025-2033

The Open Hole Logging Services market is booming, projected to exceed $XX million by 2033 with a CAGR above 2%. Driven by technological advancements and rising demand for efficient subsurface data acquisition, this report analyzes market trends, key players (Schlumberger, Baker Hughes, Halliburton), regional growth, and future projections. Learn more about this lucrative sector.

August 2025
Base Year: 2024
No Of Pages: 234
Price: $4750

Strategic Analysis of United States Turbine Control Systems Market Industry Opportunities

Discover the booming US Turbine Control Systems market! This in-depth analysis reveals a CAGR exceeding 3.59%, driven by renewable energy integration and smart grid technologies. Learn about key players, market segments, and future growth projections for 2025-2033.

August 2025
Base Year: 2024
No Of Pages: 197
Price: $3800

Europe High Voltage Switchgear Market Industry’s Growth Dynamics and Insights

The European High Voltage Switchgear Market is booming, projected to reach €7.24 billion by 2033 with a CAGR of 8.71%. Driven by renewable energy integration and grid modernization, this market analysis reveals key trends, leading players (ABB, Siemens, Hitachi), and regional breakdowns. Learn more about this high-growth sector.

August 2025
Base Year: 2024
No Of Pages: 234
Price: $4750

UAE Power Market Growth Pathways: Strategic Analysis and Forecasts 2025-2033

Discover the booming UAE power market forecast to 2033! This comprehensive analysis reveals a CAGR of 4.20%, driven by renewable energy investments, economic diversification, and key players like DEWA and TAQA. Explore market size, segmentation, and future trends.

August 2025
Base Year: 2024
No Of Pages: 197
Price: $3800

United Arab Emirates Solar Photovoltaic (PV) Market Projected to Grow at XX CAGR: Insights and Forecasts 2025-2033

Discover the booming UAE solar PV market! Our analysis reveals impressive growth projections exceeding 12% CAGR, driven by government initiatives and rising sustainability concerns. Explore market size, segmentation, key players, and future trends in this in-depth report.

August 2025
Base Year: 2024
No Of Pages: 197
Price: $3800

Understanding Canada Waste to Energy Market Trends and Growth Dynamics

Discover the booming Canadian waste-to-energy market. This comprehensive analysis reveals key trends, technologies (incineration, gasification, pyrolysis), regional growth projections (Eastern, Western, Central Canada), and top companies driving innovation from 2025-2033. Learn about the market size, CAGR, and investment opportunities.

August 2025
Base Year: 2024
No Of Pages: 197
Price: $3800

Electricity Market in Spain Growth Opportunities and Market Forecast 2025-2033: A Strategic Analysis

Discover the booming Spanish electricity market! This in-depth analysis reveals a CAGR of 12.89%, driven by renewable energy adoption and surging demand. Learn about key players, market segments, and future growth projections to 2033. Explore the opportunities and challenges facing this dynamic sector.

August 2025
Base Year: 2024
No Of Pages: 197
Price: $3800

Europe Low Voltage Switchgear Market Charting Growth Trajectories: Analysis and Forecasts 2025-2033

The European low-voltage switchgear market is booming, driven by smart grid modernization, renewable energy integration, and industrial automation. Discover key market trends, growth projections (CAGR >6%), major players (ABB, Siemens, Schneider Electric), and regional insights in our comprehensive analysis.

August 2025
Base Year: 2024
No Of Pages: 234
Price: $4750

North America Gas Insulated Switchgear Market Report: Trends and Forecasts 2025-2033

The North American Gas Insulated Switchgear (GIS) market is booming, with a CAGR exceeding 6%! This comprehensive analysis explores market size, key drivers (renewable energy, smart grids), trends, restraints, and leading companies like Siemens, Schneider Electric, and GE. Discover growth projections to 2033 and regional breakdowns.

August 2025
Base Year: 2024
No Of Pages: 197
Price: $3800

Europe Solar PV Inverters Market Unlocking Growth Potential: Analysis and Forecasts 2025-2033

The European solar PV inverter market is booming, with a CAGR exceeding 6%! Discover key trends, growth drivers, leading companies, and regional insights in this comprehensive market analysis covering residential, commercial, and utility-scale applications. Learn about the rise of microinverters and the future of solar energy in Europe.

August 2025
Base Year: 2024
No Of Pages: 234
Price: $4750

China Bunker Fuel Market Market Demand Dynamics: Insights 2025-2033

Discover the booming China bunker fuel market forecast to 2033! This comprehensive analysis reveals market size, CAGR, key drivers (maritime trade, environmental regulations), restraints (oil price volatility, economic fluctuations), and leading companies. Explore market segmentation by fuel type (HSFO, VLSFO, MGO) and vessel type.

August 2025
Base Year: 2024
No Of Pages: 197
Price: $3800

United Kingdom Midstream Oil and Gas Software Industry XX CAGR Growth to Drive Market Size to XXX Million by 2033

Discover the booming UK midstream oil & gas software market! Our analysis reveals a projected £500 million market by 2033, driven by digitalization and regulatory compliance. Learn about market size, growth trends, and key drivers shaping this dynamic sector.

August 2025
Base Year: 2024
No Of Pages: 197
Price: $3800

China Electric Vehicle Battery Materials Market Future Forecasts: Insights and Trends to 2033

China's electric vehicle battery materials market is booming, projected to reach $37.85 billion by 2033, driven by soaring EV sales and government support. Learn about key market trends, leading companies like CATL and BYD, and the challenges facing this rapidly expanding sector.

August 2025
Base Year: 2024
No Of Pages: 197
Price: $3800

MEA Combined Heat & Power Industry Comprehensive Market Study: Trends and Predictions 2025-2033

The MEA Combined Heat & Power (CHP) market is booming, projected to exceed a 5.10% CAGR through 2033. Driven by industrialization, government policies, and rising energy costs, this market offers significant opportunities across the UAE, Saudi Arabia, and South Africa. Discover key trends, regional breakdowns, and leading companies shaping this dynamic sector.

August 2025
Base Year: 2024
No Of Pages: 234
Price: $4750

Market Deep Dive: Exploring North America Drilling Market Trends 2025-2033

Discover the booming North American microgrid market! This in-depth analysis reveals key trends, drivers, and restraints impacting the growth of custom microgrids, remote power systems, and more, with a focus on institutional, commercial, and off-grid applications. Explore market size projections, leading companies, and regional insights through 2033.

August 2025
Base Year: 2024
No Of Pages: 234
Price: $4750

Malaysia Refined Petroleum Products Market 2025-2033 Analysis: Trends, Competitor Dynamics, and Growth Opportunities

Discover the booming Malaysia Refined Petroleum Products Market, projected to reach \$24 billion by 2033 with a 5.9% CAGR. This in-depth analysis covers market drivers, trends, restraints, key players (Petronas, Shell, Chevron), and regional insights. Learn how transportation, industrial, and power generation fuel demand shapes this dynamic market.

August 2025
Base Year: 2024
No Of Pages: 197
Price: $3800

North America Industrial Centrifuge Market Unlocking Growth Potential: Analysis and Forecasts 2025-2033

Discover the booming North America industrial centrifuge market! This comprehensive analysis reveals key trends, growth drivers (food & beverage, pharma, wastewater), leading companies (GEA, Alfa Laval, Flottweg), and projected market size to 2033. Learn about segmentation by operation mode, industry, and design.

August 2025
Base Year: 2024
No Of Pages: 234
Price: $4750

US Natural Gas Market Soars to XXX Million, witnessing a CAGR of XX during the forecast period 2025-2033

The US natural gas market is booming, projected to exceed a CAGR of 5% through 2033. This comprehensive analysis explores market drivers, trends, restraints, key players (Occidental Petroleum, Shell, ExxonMobil, etc.), and regional breakdowns (Northeast, Southeast, etc.), providing insights for investors and industry professionals. Discover future growth projections and understand the evolving landscape of this vital energy sector.

August 2025
Base Year: 2024
No Of Pages: 197
Price: $3800

Strategic Growth Drivers for Europe Advanced Biofuel Market Market

Discover the booming Europe advanced biofuel market! This in-depth analysis reveals key trends, drivers, and restraints shaping this dynamic sector, including leading companies, regional growth forecasts, and market size projections through 2033. Learn about the impact of sustainable transportation policies and technological advancements on the future of biofuels in Europe.

August 2025
Base Year: 2024
No Of Pages: 234
Price: $4750

Exploring Key Trends in Top Drive Drilling Industry Market

The Top Drive Drilling market is booming, with a CAGR exceeding 4.5%! This comprehensive analysis explores market size, key players (Aker Solutions, CNPC, Nabors Industries), regional trends (North America, Asia Pacific), and future growth projections for electric and hydraulic top drives in onshore and offshore drilling. Discover the latest insights and forecasts for 2025-2033.

August 2025
Base Year: 2024
No Of Pages: 234
Price: $4750

Power Plant Control System Market Market’s Consumer Insights and Trends

The Power Plant Control System market is booming, projected to reach $XX million by 2033, driven by renewable energy adoption, aging infrastructure upgrades, and smart grid integration. Learn about key market trends, leading companies (Rockwell Automation, Honeywell, ABB), and regional growth forecasts in this comprehensive analysis.

August 2025
Base Year: 2024
No Of Pages: 234
Price: $4750

Unlocking the Future of Lithium-Air Battery Industry: Growth and Trends 2025-2033

Discover the booming lithium-air battery market! This in-depth analysis reveals a CAGR exceeding 5.50%, driven by EV adoption and consumer electronics. Explore market size, trends, key players (Tesla, Lithium Air Industries), and regional insights for 2025-2033. Invest wisely in this high-growth sector.

August 2025
Base Year: 2024
No Of Pages: 234
Price: $4750

North America Battery Manufacturing Equipment Market Decoded: Comprehensive Analysis and Forecasts 2025-2033

The North American battery manufacturing equipment market is booming, projected to reach $2.15 billion by 2033 with a 20% CAGR. Driven by EV adoption and government incentives, this report analyzes market size, key players (Dürr AG, Hitachi Ltd., etc.), and segment trends for coating, calendaring, and more. Learn more!

August 2025
Base Year: 2024
No Of Pages: 180
Price: $4750

South America Oil And Gas Hoses And Coupling Market 2025-2033 Overview: Trends, Competitor Dynamics, and Opportunities

Discover the booming South American oil and gas hoses and couplings market. Learn about its impressive CAGR, key drivers, major players (Trelleborg, Parker Hannifin, etc.), and regional insights (Brazil, Argentina). Explore market forecasts and trends until 2033.

August 2025
Base Year: 2024
No Of Pages: 180
Price: $4750
  • Home
  • About Us
  • Industries
    • Aerospace & Defense
    • Agriculture
    • Animal Nutrition & Wellness
    • Automotive
    • Chemicals & Materials
    • Consumer Goods and Services
    • Energy & Power
    • Financial Services and Investment Intelligence
    • Food & Beverage
    • Home and Property Improvement
    • Hospitality and Tourism
    • Logistics
    • Manufacturing Products and Services
    • Packaging
    • Professional and Commercial Services
    • Real Estate and Construction
    • Retail
    • Technology, Media and Telecom
    • Healthcare
  • Services
  • Contact
Main Logo
  • Home
  • About Us
  • Industries
    • Aerospace & Defense
    • Agriculture
    • Animal Nutrition & Wellness
    • Automotive
    • Chemicals & Materials
    • Consumer Goods and Services
    • Energy & Power
    • Financial Services and Investment Intelligence
    • Food & Beverage
    • Home and Property Improvement
    • Hospitality and Tourism
    • Logistics
    • Manufacturing Products and Services
    • Packaging
    • Professional and Commercial Services
    • Real Estate and Construction
    • Retail
    • Technology, Media and Telecom
    • Healthcare
  • Services
  • Contact
+17162654855
[email protected]

+17162654855

[email protected]

Business Address

Head Office

Ansec House 3 rd floor Tank Road, Yerwada, Pune, Maharashtra 411014

Contact Information

Craig Francis

Business Development Head

+17162654855

[email protected]

Secure Payment Partners

payment image
RetailLogisticsPackagingAutomotiveHealthcareAgricultureEnergy & PowerFood & BeverageAerospace & DefenseChemicals & MaterialsHospitality and TourismAnimal Nutrition & WellnessConsumer Goods and ServicesReal Estate and ConstructionHome and Property ImprovementTechnology, Media and TelecomManufacturing Products and ServicesFinancial Services and Investment Intelligence

© 2025 PRDUA Research & Media Private Limited, All rights reserved

Privacy Policy
Terms and Conditions
FAQ