
Key Insights
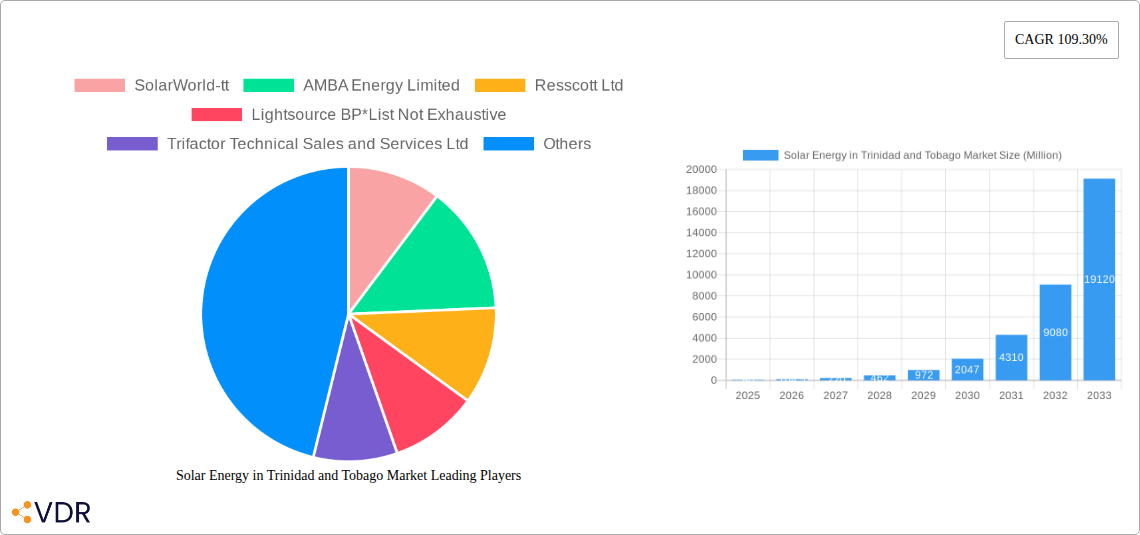
The Trinidad and Tobago solar energy market, while currently relatively small, is poised for significant growth, driven by increasing electricity costs, government incentives promoting renewable energy adoption, and a commitment to reducing carbon emissions. The market's Compound Annual Growth Rate (CAGR) of 109.30% from 2019-2024 suggests a rapidly expanding sector, primarily fueled by the deployment of solar photovoltaic (PV) systems. While the exact market size for 2025 is unavailable, extrapolating from the high CAGR and considering typical market penetration rates for developing nations, a reasonable estimation places the market value at approximately $50 million USD. This value is further supported by the presence of established players like SolarWorld-tt and AMBA Energy Limited indicating a functioning market with existing infrastructure. The utility-scale PV segment is expected to dominate initially due to larger project sizes and potential for government funding, however, the non-utility segment (residential and commercial) is anticipated to experience rapid growth, driven by decreasing solar panel costs and increased consumer awareness of environmental sustainability. Constraints could include limited access to financing for smaller projects, intermittent sunshine, and a need for improved grid infrastructure to effectively integrate renewable energy sources. The forecast period of 2025-2033 predicts continued expansion, with a potential market size exceeding $500 million USD by 2033, assuming sustained government support and ongoing technological advancements. This growth will likely be influenced by expanding solar energy awareness campaigns and increased investment in the renewable energy sector within the country.
The market segmentation reveals a strong focus on solar photovoltaic (PV) technology, indicating a preference for cost-effective and readily deployable solutions. Concentrated Solar Power (CSP) may hold future potential, but currently represents a smaller segment. Further expansion will be fueled by continued government support and incentives, coupled with improving energy storage solutions to address the intermittency of solar power. The entry of international players like Lightsource BP underscores the growing attractiveness of the Trinidad and Tobago market to foreign investment. Over the forecast period, effective policies to streamline project approvals, improve grid connection processes, and enhance financing options will be crucial in accelerating the growth of this promising sector.
Solar Energy in Trinidad and Tobago Market: A Comprehensive Report (2019-2033)
This in-depth report provides a comprehensive analysis of the solar energy market in Trinidad and Tobago, covering market dynamics, growth trends, key players, and future outlook. The study period spans from 2019 to 2033, with 2025 as the base and estimated year. This report is essential for industry professionals, investors, and policymakers seeking to understand and capitalize on the burgeoning solar energy sector in Trinidad and Tobago.
Keywords: Trinidad and Tobago solar energy market, solar PV Trinidad and Tobago, utility-scale solar Trinidad, solar energy investment Trinidad, renewable energy Trinidad, solar power Trinidad, Concentrated Solar Power (CSP) Trinidad and Tobago, Solar Photovoltaic (PV) Trinidad and Tobago, AMBA Energy Limited, Resscott Ltd, Lightsource BP, SolarWorld-tt, Trifactor Technical Sales and Services Ltd, AIMS Power, Brechin Castle solar project.
Solar Energy in Trinidad and Tobago Market Dynamics & Structure
The Trinidad and Tobago solar energy market is characterized by increasing market concentration, driven by large-scale projects and the entrance of international players. Technological innovation is accelerating, particularly in PV technology, spurred by government incentives and declining costs. The regulatory framework is evolving to support renewable energy integration, though challenges remain in grid infrastructure and permitting. Competitive substitutes include fossil fuels, but the rising cost of these fuels and environmental concerns are favoring solar. End-user demographics are diverse, encompassing residential, commercial, industrial, and utility-scale sectors. M&A activity is expected to increase as larger companies seek to consolidate their market share.
- Market Concentration: Moderately concentrated, with a few large players and numerous smaller installers. xx% market share held by top 3 players in 2024.
- Technological Innovation: Focus on improving PV efficiency and reducing costs. CSP technology adoption remains limited.
- Regulatory Framework: Government initiatives promoting renewable energy adoption; however, bureaucratic processes and grid integration challenges exist.
- Competitive Substitutes: Fossil fuels (natural gas) are the primary competitor. The cost competitiveness of solar is increasing.
- End-User Demographics: Residential, commercial, industrial, and utility-scale segments contribute to market demand.
- M&A Trends: Consolidation is anticipated, particularly among smaller players, driven by economies of scale. xx M&A deals were recorded between 2019 and 2024.
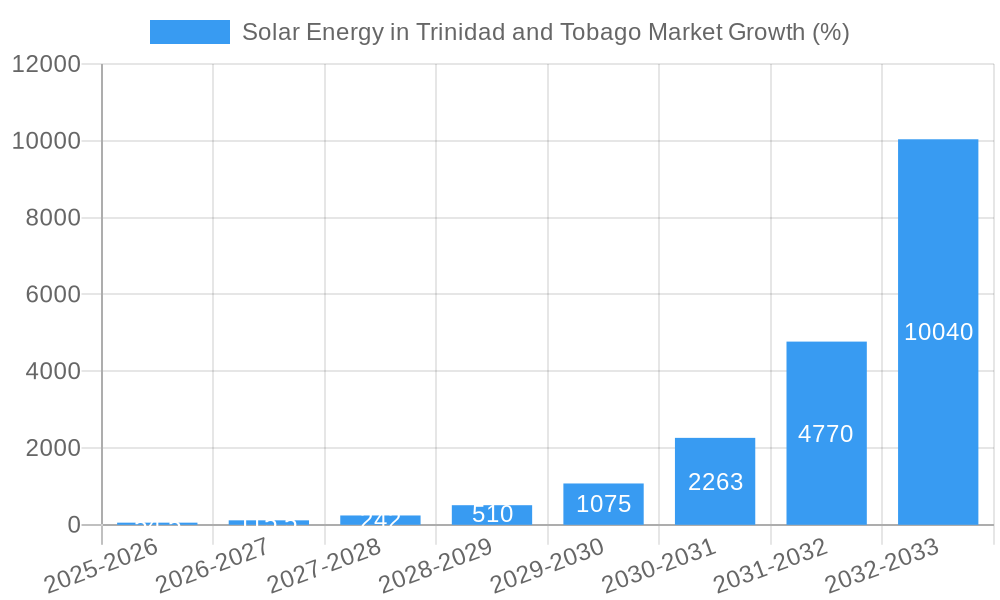
Solar Energy in Trinidad and Tobago Market Growth Trends & Insights
The Trinidad and Tobago solar energy market is experiencing significant growth, driven by increasing electricity demand, rising fossil fuel costs, and government support for renewable energy. The market size has witnessed a Compound Annual Growth Rate (CAGR) of xx% during the historical period (2019-2024) and is projected to maintain a CAGR of xx% during the forecast period (2025-2033). This growth is primarily fueled by the increasing adoption of solar PV systems, particularly in the utility-scale segment. Technological advancements, such as improved panel efficiency and battery storage solutions, are further accelerating market penetration. Shifting consumer preferences towards sustainable energy solutions are also contributing factors. The market penetration rate is projected to reach xx% by 2033. This growth is also influenced by government policies aiming to diversify the energy mix and reduce carbon emissions.
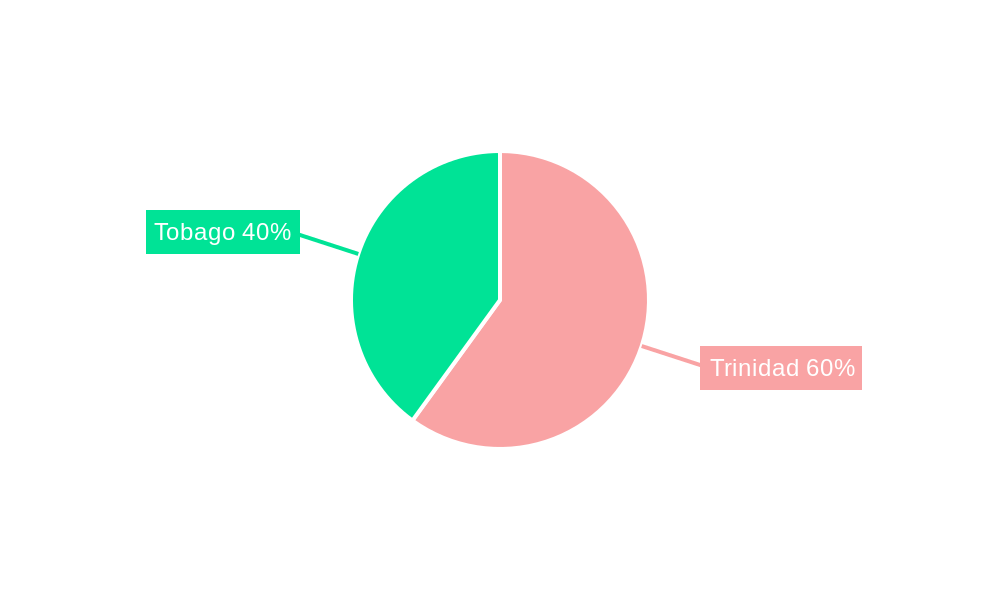
Dominant Regions, Countries, or Segments in Solar Energy in Trinidad and Tobago Market
The utility-scale segment is the dominant driver of market growth in Trinidad and Tobago, propelled by large-scale projects like the Brechin Castle solar plant. While the non-utility segment, encompassing residential and commercial installations, is also growing, the scale of utility-scale projects significantly influences the overall market size. Solar Photovoltaic (PV) technology constitutes the overwhelming majority of installations, with Concentrated Solar Power (CSP) currently holding a negligible market share.
- Key Drivers for Utility-Scale Growth:
- Government support for large-scale renewable energy projects.
- Attractive feed-in tariffs and power purchase agreements.
- Decreasing costs of solar PV technology.
- Need for energy diversification and decarbonization.
- Key Drivers for Non-Utility Growth:
- Increasing awareness of environmental benefits.
- Government incentives for residential and commercial installations.
- Falling installation costs.
- Market Share: Utility-scale segment accounts for xx% of market share in 2024, with non-utility accounting for xx%. PV dominates the technology landscape with xx% market share.
Solar Energy in Trinidad and Tobago Market Product Landscape
The Trinidad and Tobago solar energy market is largely dominated by solar PV technology, with a focus on high-efficiency panels and increasingly sophisticated inverters. Recent innovations include the integration of battery storage solutions for improved grid stability and energy independence. Product differentiation often focuses on price competitiveness, efficiency, warranty duration, and ease of installation. These solutions are primarily deployed on rooftops or in dedicated solar parks.
Key Drivers, Barriers & Challenges in Solar Energy in Trinidad and Tobago Market
Key Drivers: Government incentives, decreasing solar energy costs, increasing electricity demand, and environmental concerns are the primary drivers. The recent Brechin Castle project showcases the potential for large-scale deployment.
Key Challenges: Grid integration challenges, high upfront capital costs for large-scale projects, and reliance on imported components pose significant barriers. Regulatory complexities and land acquisition issues also contribute to project delays and increased costs. The impact of these challenges is estimated to cause a xx% reduction in projected market growth if not appropriately addressed.
Emerging Opportunities in Solar Energy in Trinidad and Tobago Market
The integration of solar energy with energy storage solutions presents a significant opportunity. Furthermore, exploring innovative applications like agrivoltaics and floating solar farms can expand market potential. Expanding the market to underserved rural areas also holds promise. Finally, focusing on the development of a robust local manufacturing and supply chain will enhance sustainability and reduce dependence on imports.
Growth Accelerators in the Solar Energy in Trinidad and Tobago Market Industry
Technological breakthroughs in solar panel efficiency and battery storage will continue to drive market growth. Strategic partnerships between international players and local companies can accelerate project development and technology transfer. Continued government support and investment in grid infrastructure will enhance market scalability. Market expansion into previously untapped areas through innovative financing models will further fuel this rapid expansion.
Key Players Shaping the Solar Energy in Trinidad and Tobago Market Market
- SolarWorld-tt
- AMBA Energy Limited
- Resscott Ltd
- Lightsource BP
- Trifactor Technical Sales and Services Ltd
- AIMS Power
Notable Milestones in Solar Energy in Trinidad and Tobago Market Sector
- December 2022: The GoRTT and consortium partners (Lightsource, bp, Shell, and BP) received approval for the 112 MWac/148 MWp Brechin Castle solar project.
- April 2023: Groundbreaking ceremony for the Brechin Castle solar project, a significant milestone marking the beginning of large-scale solar deployment in Trinidad and Tobago.
In-Depth Solar Energy in Trinidad and Tobago Market Market Outlook
The future of the solar energy market in Trinidad and Tobago is bright. Continued government support, decreasing costs, and technological advancements will propel significant growth over the forecast period. Strategic partnerships, focus on grid infrastructure improvements, and exploitation of emerging opportunities such as energy storage and innovative project financing will be key to unlocking the full potential of the solar energy sector in the country. The market is projected to reach a value of xx Million by 2033.
Solar Energy in Trinidad and Tobago Market Segmentation
- 1. Production Analysis
- 2. Consumption Analysis
- 3. Import Market Analysis (Value & Volume)
- 4. Export Market Analysis (Value & Volume)
- 5. Price Trend Analysis
Solar Energy in Trinidad and Tobago Market Segmentation By Geography
-
1. North America
- 1.1. United States
- 1.2. Canada
- 1.3. Mexico
-
2. South America
- 2.1. Brazil
- 2.2. Argentina
- 2.3. Rest of South America
-
3. Europe
- 3.1. United Kingdom
- 3.2. Germany
- 3.3. France
- 3.4. Italy
- 3.5. Spain
- 3.6. Russia
- 3.7. Benelux
- 3.8. Nordics
- 3.9. Rest of Europe
-
4. Middle East & Africa
- 4.1. Turkey
- 4.2. Israel
- 4.3. GCC
- 4.4. North Africa
- 4.5. South Africa
- 4.6. Rest of Middle East & Africa
-
5. Asia Pacific
- 5.1. China
- 5.2. India
- 5.3. Japan
- 5.4. South Korea
- 5.5. ASEAN
- 5.6. Oceania
- 5.7. Rest of Asia Pacific
Solar Energy in Trinidad and Tobago Market REPORT HIGHLIGHTS
| Aspects | Details |
|---|---|
| Study Period | 2019-2033 |
| Base Year | 2024 |
| Estimated Year | 2025 |
| Forecast Period | 2025-2033 |
| Historical Period | 2019-2024 |
| Growth Rate | CAGR of 109.30% from 2019-2033 |
| Segmentation |
|
Table of Contents
- 1. Introduction
- 1.1. Research Scope
- 1.2. Market Segmentation
- 1.3. Research Methodology
- 1.4. Definitions and Assumptions
- 2. Executive Summary
- 2.1. Introduction
- 3. Market Dynamics
- 3.1. Introduction
- 3.2. Market Drivers
- 3.2.1. Rising Environmental Concerns and Energy Security in the Country; Increasing Focus on Renewable Energy
- 3.3. Market Restrains
- 3.3.1. Availability of Abundance Natural Fossil Fuel Reserves
- 3.4. Market Trends
- 3.4.1. Increasing Demand for Clean Electricity Generation Expected to Drive the Market
- 4. Market Factor Analysis
- 4.1. Porters Five Forces
- 4.2. Supply/Value Chain
- 4.3. PESTEL analysis
- 4.4. Market Entropy
- 4.5. Patent/Trademark Analysis
- 5. Global Solar Energy in Trinidad and Tobago Market Analysis, Insights and Forecast, 2019-2031
- 5.1. Market Analysis, Insights and Forecast - by Production Analysis
- 5.2. Market Analysis, Insights and Forecast - by Consumption Analysis
- 5.3. Market Analysis, Insights and Forecast - by Import Market Analysis (Value & Volume)
- 5.4. Market Analysis, Insights and Forecast - by Export Market Analysis (Value & Volume)
- 5.5. Market Analysis, Insights and Forecast - by Price Trend Analysis
- 5.6. Market Analysis, Insights and Forecast - by Region
- 5.6.1. North America
- 5.6.2. South America
- 5.6.3. Europe
- 5.6.4. Middle East & Africa
- 5.6.5. Asia Pacific
- 5.1. Market Analysis, Insights and Forecast - by Production Analysis
- 6. North America Solar Energy in Trinidad and Tobago Market Analysis, Insights and Forecast, 2019-2031
- 6.1. Market Analysis, Insights and Forecast - by Production Analysis
- 6.2. Market Analysis, Insights and Forecast - by Consumption Analysis
- 6.3. Market Analysis, Insights and Forecast - by Import Market Analysis (Value & Volume)
- 6.4. Market Analysis, Insights and Forecast - by Export Market Analysis (Value & Volume)
- 6.5. Market Analysis, Insights and Forecast - by Price Trend Analysis
- 6.1. Market Analysis, Insights and Forecast - by Production Analysis
- 7. South America Solar Energy in Trinidad and Tobago Market Analysis, Insights and Forecast, 2019-2031
- 7.1. Market Analysis, Insights and Forecast - by Production Analysis
- 7.2. Market Analysis, Insights and Forecast - by Consumption Analysis
- 7.3. Market Analysis, Insights and Forecast - by Import Market Analysis (Value & Volume)
- 7.4. Market Analysis, Insights and Forecast - by Export Market Analysis (Value & Volume)
- 7.5. Market Analysis, Insights and Forecast - by Price Trend Analysis
- 7.1. Market Analysis, Insights and Forecast - by Production Analysis
- 8. Europe Solar Energy in Trinidad and Tobago Market Analysis, Insights and Forecast, 2019-2031
- 8.1. Market Analysis, Insights and Forecast - by Production Analysis
- 8.2. Market Analysis, Insights and Forecast - by Consumption Analysis
- 8.3. Market Analysis, Insights and Forecast - by Import Market Analysis (Value & Volume)
- 8.4. Market Analysis, Insights and Forecast - by Export Market Analysis (Value & Volume)
- 8.5. Market Analysis, Insights and Forecast - by Price Trend Analysis
- 8.1. Market Analysis, Insights and Forecast - by Production Analysis
- 9. Middle East & Africa Solar Energy in Trinidad and Tobago Market Analysis, Insights and Forecast, 2019-2031
- 9.1. Market Analysis, Insights and Forecast - by Production Analysis
- 9.2. Market Analysis, Insights and Forecast - by Consumption Analysis
- 9.3. Market Analysis, Insights and Forecast - by Import Market Analysis (Value & Volume)
- 9.4. Market Analysis, Insights and Forecast - by Export Market Analysis (Value & Volume)
- 9.5. Market Analysis, Insights and Forecast - by Price Trend Analysis
- 9.1. Market Analysis, Insights and Forecast - by Production Analysis
- 10. Asia Pacific Solar Energy in Trinidad and Tobago Market Analysis, Insights and Forecast, 2019-2031
- 10.1. Market Analysis, Insights and Forecast - by Production Analysis
- 10.2. Market Analysis, Insights and Forecast - by Consumption Analysis
- 10.3. Market Analysis, Insights and Forecast - by Import Market Analysis (Value & Volume)
- 10.4. Market Analysis, Insights and Forecast - by Export Market Analysis (Value & Volume)
- 10.5. Market Analysis, Insights and Forecast - by Price Trend Analysis
- 10.1. Market Analysis, Insights and Forecast - by Production Analysis
- 11. Competitive Analysis
- 11.1. Global Market Share Analysis 2024
- 11.2. Company Profiles
- 11.2.1 SolarWorld-tt
- 11.2.1.1. Overview
- 11.2.1.2. Products
- 11.2.1.3. SWOT Analysis
- 11.2.1.4. Recent Developments
- 11.2.1.5. Financials (Based on Availability)
- 11.2.2 AMBA Energy Limited
- 11.2.2.1. Overview
- 11.2.2.2. Products
- 11.2.2.3. SWOT Analysis
- 11.2.2.4. Recent Developments
- 11.2.2.5. Financials (Based on Availability)
- 11.2.3 Resscott Ltd
- 11.2.3.1. Overview
- 11.2.3.2. Products
- 11.2.3.3. SWOT Analysis
- 11.2.3.4. Recent Developments
- 11.2.3.5. Financials (Based on Availability)
- 11.2.4 Lightsource BP*List Not Exhaustive
- 11.2.4.1. Overview
- 11.2.4.2. Products
- 11.2.4.3. SWOT Analysis
- 11.2.4.4. Recent Developments
- 11.2.4.5. Financials (Based on Availability)
- 11.2.5 Trifactor Technical Sales and Services Ltd
- 11.2.5.1. Overview
- 11.2.5.2. Products
- 11.2.5.3. SWOT Analysis
- 11.2.5.4. Recent Developments
- 11.2.5.5. Financials (Based on Availability)
- 11.2.6 AIMS Power
- 11.2.6.1. Overview
- 11.2.6.2. Products
- 11.2.6.3. SWOT Analysis
- 11.2.6.4. Recent Developments
- 11.2.6.5. Financials (Based on Availability)
- 11.2.1 SolarWorld-tt
List of Figures
- Figure 1: Global Solar Energy in Trinidad and Tobago Market Revenue Breakdown (Million, %) by Region 2024 & 2032
- Figure 2: Global Solar Energy in Trinidad and Tobago Market Volume Breakdown (megawatt, %) by Region 2024 & 2032
- Figure 3: Trinidad and Tobago Solar Energy in Trinidad and Tobago Market Revenue (Million), by Country 2024 & 2032
- Figure 4: Trinidad and Tobago Solar Energy in Trinidad and Tobago Market Volume (megawatt), by Country 2024 & 2032
- Figure 5: Trinidad and Tobago Solar Energy in Trinidad and Tobago Market Revenue Share (%), by Country 2024 & 2032
- Figure 6: Trinidad and Tobago Solar Energy in Trinidad and Tobago Market Volume Share (%), by Country 2024 & 2032
- Figure 7: North America Solar Energy in Trinidad and Tobago Market Revenue (Million), by Production Analysis 2024 & 2032
- Figure 8: North America Solar Energy in Trinidad and Tobago Market Volume (megawatt), by Production Analysis 2024 & 2032
- Figure 9: North America Solar Energy in Trinidad and Tobago Market Revenue Share (%), by Production Analysis 2024 & 2032
- Figure 10: North America Solar Energy in Trinidad and Tobago Market Volume Share (%), by Production Analysis 2024 & 2032
- Figure 11: North America Solar Energy in Trinidad and Tobago Market Revenue (Million), by Consumption Analysis 2024 & 2032
- Figure 12: North America Solar Energy in Trinidad and Tobago Market Volume (megawatt), by Consumption Analysis 2024 & 2032
- Figure 13: North America Solar Energy in Trinidad and Tobago Market Revenue Share (%), by Consumption Analysis 2024 & 2032
- Figure 14: North America Solar Energy in Trinidad and Tobago Market Volume Share (%), by Consumption Analysis 2024 & 2032
- Figure 15: North America Solar Energy in Trinidad and Tobago Market Revenue (Million), by Import Market Analysis (Value & Volume) 2024 & 2032
- Figure 16: North America Solar Energy in Trinidad and Tobago Market Volume (megawatt), by Import Market Analysis (Value & Volume) 2024 & 2032
- Figure 17: North America Solar Energy in Trinidad and Tobago Market Revenue Share (%), by Import Market Analysis (Value & Volume) 2024 & 2032
- Figure 18: North America Solar Energy in Trinidad and Tobago Market Volume Share (%), by Import Market Analysis (Value & Volume) 2024 & 2032
- Figure 19: North America Solar Energy in Trinidad and Tobago Market Revenue (Million), by Export Market Analysis (Value & Volume) 2024 & 2032
- Figure 20: North America Solar Energy in Trinidad and Tobago Market Volume (megawatt), by Export Market Analysis (Value & Volume) 2024 & 2032
- Figure 21: North America Solar Energy in Trinidad and Tobago Market Revenue Share (%), by Export Market Analysis (Value & Volume) 2024 & 2032
- Figure 22: North America Solar Energy in Trinidad and Tobago Market Volume Share (%), by Export Market Analysis (Value & Volume) 2024 & 2032
- Figure 23: North America Solar Energy in Trinidad and Tobago Market Revenue (Million), by Price Trend Analysis 2024 & 2032
- Figure 24: North America Solar Energy in Trinidad and Tobago Market Volume (megawatt), by Price Trend Analysis 2024 & 2032
- Figure 25: North America Solar Energy in Trinidad and Tobago Market Revenue Share (%), by Price Trend Analysis 2024 & 2032
- Figure 26: North America Solar Energy in Trinidad and Tobago Market Volume Share (%), by Price Trend Analysis 2024 & 2032
- Figure 27: North America Solar Energy in Trinidad and Tobago Market Revenue (Million), by Country 2024 & 2032
- Figure 28: North America Solar Energy in Trinidad and Tobago Market Volume (megawatt), by Country 2024 & 2032
- Figure 29: North America Solar Energy in Trinidad and Tobago Market Revenue Share (%), by Country 2024 & 2032
- Figure 30: North America Solar Energy in Trinidad and Tobago Market Volume Share (%), by Country 2024 & 2032
- Figure 31: South America Solar Energy in Trinidad and Tobago Market Revenue (Million), by Production Analysis 2024 & 2032
- Figure 32: South America Solar Energy in Trinidad and Tobago Market Volume (megawatt), by Production Analysis 2024 & 2032
- Figure 33: South America Solar Energy in Trinidad and Tobago Market Revenue Share (%), by Production Analysis 2024 & 2032
- Figure 34: South America Solar Energy in Trinidad and Tobago Market Volume Share (%), by Production Analysis 2024 & 2032
- Figure 35: South America Solar Energy in Trinidad and Tobago Market Revenue (Million), by Consumption Analysis 2024 & 2032
- Figure 36: South America Solar Energy in Trinidad and Tobago Market Volume (megawatt), by Consumption Analysis 2024 & 2032
- Figure 37: South America Solar Energy in Trinidad and Tobago Market Revenue Share (%), by Consumption Analysis 2024 & 2032
- Figure 38: South America Solar Energy in Trinidad and Tobago Market Volume Share (%), by Consumption Analysis 2024 & 2032
- Figure 39: South America Solar Energy in Trinidad and Tobago Market Revenue (Million), by Import Market Analysis (Value & Volume) 2024 & 2032
- Figure 40: South America Solar Energy in Trinidad and Tobago Market Volume (megawatt), by Import Market Analysis (Value & Volume) 2024 & 2032
- Figure 41: South America Solar Energy in Trinidad and Tobago Market Revenue Share (%), by Import Market Analysis (Value & Volume) 2024 & 2032
- Figure 42: South America Solar Energy in Trinidad and Tobago Market Volume Share (%), by Import Market Analysis (Value & Volume) 2024 & 2032
- Figure 43: South America Solar Energy in Trinidad and Tobago Market Revenue (Million), by Export Market Analysis (Value & Volume) 2024 & 2032
- Figure 44: South America Solar Energy in Trinidad and Tobago Market Volume (megawatt), by Export Market Analysis (Value & Volume) 2024 & 2032
- Figure 45: South America Solar Energy in Trinidad and Tobago Market Revenue Share (%), by Export Market Analysis (Value & Volume) 2024 & 2032
- Figure 46: South America Solar Energy in Trinidad and Tobago Market Volume Share (%), by Export Market Analysis (Value & Volume) 2024 & 2032
- Figure 47: South America Solar Energy in Trinidad and Tobago Market Revenue (Million), by Price Trend Analysis 2024 & 2032
- Figure 48: South America Solar Energy in Trinidad and Tobago Market Volume (megawatt), by Price Trend Analysis 2024 & 2032
- Figure 49: South America Solar Energy in Trinidad and Tobago Market Revenue Share (%), by Price Trend Analysis 2024 & 2032
- Figure 50: South America Solar Energy in Trinidad and Tobago Market Volume Share (%), by Price Trend Analysis 2024 & 2032
- Figure 51: South America Solar Energy in Trinidad and Tobago Market Revenue (Million), by Country 2024 & 2032
- Figure 52: South America Solar Energy in Trinidad and Tobago Market Volume (megawatt), by Country 2024 & 2032
- Figure 53: South America Solar Energy in Trinidad and Tobago Market Revenue Share (%), by Country 2024 & 2032
- Figure 54: South America Solar Energy in Trinidad and Tobago Market Volume Share (%), by Country 2024 & 2032
- Figure 55: Europe Solar Energy in Trinidad and Tobago Market Revenue (Million), by Production Analysis 2024 & 2032
- Figure 56: Europe Solar Energy in Trinidad and Tobago Market Volume (megawatt), by Production Analysis 2024 & 2032
- Figure 57: Europe Solar Energy in Trinidad and Tobago Market Revenue Share (%), by Production Analysis 2024 & 2032
- Figure 58: Europe Solar Energy in Trinidad and Tobago Market Volume Share (%), by Production Analysis 2024 & 2032
- Figure 59: Europe Solar Energy in Trinidad and Tobago Market Revenue (Million), by Consumption Analysis 2024 & 2032
- Figure 60: Europe Solar Energy in Trinidad and Tobago Market Volume (megawatt), by Consumption Analysis 2024 & 2032
- Figure 61: Europe Solar Energy in Trinidad and Tobago Market Revenue Share (%), by Consumption Analysis 2024 & 2032
- Figure 62: Europe Solar Energy in Trinidad and Tobago Market Volume Share (%), by Consumption Analysis 2024 & 2032
- Figure 63: Europe Solar Energy in Trinidad and Tobago Market Revenue (Million), by Import Market Analysis (Value & Volume) 2024 & 2032
- Figure 64: Europe Solar Energy in Trinidad and Tobago Market Volume (megawatt), by Import Market Analysis (Value & Volume) 2024 & 2032
- Figure 65: Europe Solar Energy in Trinidad and Tobago Market Revenue Share (%), by Import Market Analysis (Value & Volume) 2024 & 2032
- Figure 66: Europe Solar Energy in Trinidad and Tobago Market Volume Share (%), by Import Market Analysis (Value & Volume) 2024 & 2032
- Figure 67: Europe Solar Energy in Trinidad and Tobago Market Revenue (Million), by Export Market Analysis (Value & Volume) 2024 & 2032
- Figure 68: Europe Solar Energy in Trinidad and Tobago Market Volume (megawatt), by Export Market Analysis (Value & Volume) 2024 & 2032
- Figure 69: Europe Solar Energy in Trinidad and Tobago Market Revenue Share (%), by Export Market Analysis (Value & Volume) 2024 & 2032
- Figure 70: Europe Solar Energy in Trinidad and Tobago Market Volume Share (%), by Export Market Analysis (Value & Volume) 2024 & 2032
- Figure 71: Europe Solar Energy in Trinidad and Tobago Market Revenue (Million), by Price Trend Analysis 2024 & 2032
- Figure 72: Europe Solar Energy in Trinidad and Tobago Market Volume (megawatt), by Price Trend Analysis 2024 & 2032
- Figure 73: Europe Solar Energy in Trinidad and Tobago Market Revenue Share (%), by Price Trend Analysis 2024 & 2032
- Figure 74: Europe Solar Energy in Trinidad and Tobago Market Volume Share (%), by Price Trend Analysis 2024 & 2032
- Figure 75: Europe Solar Energy in Trinidad and Tobago Market Revenue (Million), by Country 2024 & 2032
- Figure 76: Europe Solar Energy in Trinidad and Tobago Market Volume (megawatt), by Country 2024 & 2032
- Figure 77: Europe Solar Energy in Trinidad and Tobago Market Revenue Share (%), by Country 2024 & 2032
- Figure 78: Europe Solar Energy in Trinidad and Tobago Market Volume Share (%), by Country 2024 & 2032
- Figure 79: Middle East & Africa Solar Energy in Trinidad and Tobago Market Revenue (Million), by Production Analysis 2024 & 2032
- Figure 80: Middle East & Africa Solar Energy in Trinidad and Tobago Market Volume (megawatt), by Production Analysis 2024 & 2032
- Figure 81: Middle East & Africa Solar Energy in Trinidad and Tobago Market Revenue Share (%), by Production Analysis 2024 & 2032
- Figure 82: Middle East & Africa Solar Energy in Trinidad and Tobago Market Volume Share (%), by Production Analysis 2024 & 2032
- Figure 83: Middle East & Africa Solar Energy in Trinidad and Tobago Market Revenue (Million), by Consumption Analysis 2024 & 2032
- Figure 84: Middle East & Africa Solar Energy in Trinidad and Tobago Market Volume (megawatt), by Consumption Analysis 2024 & 2032
- Figure 85: Middle East & Africa Solar Energy in Trinidad and Tobago Market Revenue Share (%), by Consumption Analysis 2024 & 2032
- Figure 86: Middle East & Africa Solar Energy in Trinidad and Tobago Market Volume Share (%), by Consumption Analysis 2024 & 2032
- Figure 87: Middle East & Africa Solar Energy in Trinidad and Tobago Market Revenue (Million), by Import Market Analysis (Value & Volume) 2024 & 2032
- Figure 88: Middle East & Africa Solar Energy in Trinidad and Tobago Market Volume (megawatt), by Import Market Analysis (Value & Volume) 2024 & 2032
- Figure 89: Middle East & Africa Solar Energy in Trinidad and Tobago Market Revenue Share (%), by Import Market Analysis (Value & Volume) 2024 & 2032
- Figure 90: Middle East & Africa Solar Energy in Trinidad and Tobago Market Volume Share (%), by Import Market Analysis (Value & Volume) 2024 & 2032
- Figure 91: Middle East & Africa Solar Energy in Trinidad and Tobago Market Revenue (Million), by Export Market Analysis (Value & Volume) 2024 & 2032
- Figure 92: Middle East & Africa Solar Energy in Trinidad and Tobago Market Volume (megawatt), by Export Market Analysis (Value & Volume) 2024 & 2032
- Figure 93: Middle East & Africa Solar Energy in Trinidad and Tobago Market Revenue Share (%), by Export Market Analysis (Value & Volume) 2024 & 2032
- Figure 94: Middle East & Africa Solar Energy in Trinidad and Tobago Market Volume Share (%), by Export Market Analysis (Value & Volume) 2024 & 2032
- Figure 95: Middle East & Africa Solar Energy in Trinidad and Tobago Market Revenue (Million), by Price Trend Analysis 2024 & 2032
- Figure 96: Middle East & Africa Solar Energy in Trinidad and Tobago Market Volume (megawatt), by Price Trend Analysis 2024 & 2032
- Figure 97: Middle East & Africa Solar Energy in Trinidad and Tobago Market Revenue Share (%), by Price Trend Analysis 2024 & 2032
- Figure 98: Middle East & Africa Solar Energy in Trinidad and Tobago Market Volume Share (%), by Price Trend Analysis 2024 & 2032
- Figure 99: Middle East & Africa Solar Energy in Trinidad and Tobago Market Revenue (Million), by Country 2024 & 2032
- Figure 100: Middle East & Africa Solar Energy in Trinidad and Tobago Market Volume (megawatt), by Country 2024 & 2032
- Figure 101: Middle East & Africa Solar Energy in Trinidad and Tobago Market Revenue Share (%), by Country 2024 & 2032
- Figure 102: Middle East & Africa Solar Energy in Trinidad and Tobago Market Volume Share (%), by Country 2024 & 2032
- Figure 103: Asia Pacific Solar Energy in Trinidad and Tobago Market Revenue (Million), by Production Analysis 2024 & 2032
- Figure 104: Asia Pacific Solar Energy in Trinidad and Tobago Market Volume (megawatt), by Production Analysis 2024 & 2032
- Figure 105: Asia Pacific Solar Energy in Trinidad and Tobago Market Revenue Share (%), by Production Analysis 2024 & 2032
- Figure 106: Asia Pacific Solar Energy in Trinidad and Tobago Market Volume Share (%), by Production Analysis 2024 & 2032
- Figure 107: Asia Pacific Solar Energy in Trinidad and Tobago Market Revenue (Million), by Consumption Analysis 2024 & 2032
- Figure 108: Asia Pacific Solar Energy in Trinidad and Tobago Market Volume (megawatt), by Consumption Analysis 2024 & 2032
- Figure 109: Asia Pacific Solar Energy in Trinidad and Tobago Market Revenue Share (%), by Consumption Analysis 2024 & 2032
- Figure 110: Asia Pacific Solar Energy in Trinidad and Tobago Market Volume Share (%), by Consumption Analysis 2024 & 2032
- Figure 111: Asia Pacific Solar Energy in Trinidad and Tobago Market Revenue (Million), by Import Market Analysis (Value & Volume) 2024 & 2032
- Figure 112: Asia Pacific Solar Energy in Trinidad and Tobago Market Volume (megawatt), by Import Market Analysis (Value & Volume) 2024 & 2032
- Figure 113: Asia Pacific Solar Energy in Trinidad and Tobago Market Revenue Share (%), by Import Market Analysis (Value & Volume) 2024 & 2032
- Figure 114: Asia Pacific Solar Energy in Trinidad and Tobago Market Volume Share (%), by Import Market Analysis (Value & Volume) 2024 & 2032
- Figure 115: Asia Pacific Solar Energy in Trinidad and Tobago Market Revenue (Million), by Export Market Analysis (Value & Volume) 2024 & 2032
- Figure 116: Asia Pacific Solar Energy in Trinidad and Tobago Market Volume (megawatt), by Export Market Analysis (Value & Volume) 2024 & 2032
- Figure 117: Asia Pacific Solar Energy in Trinidad and Tobago Market Revenue Share (%), by Export Market Analysis (Value & Volume) 2024 & 2032
- Figure 118: Asia Pacific Solar Energy in Trinidad and Tobago Market Volume Share (%), by Export Market Analysis (Value & Volume) 2024 & 2032
- Figure 119: Asia Pacific Solar Energy in Trinidad and Tobago Market Revenue (Million), by Price Trend Analysis 2024 & 2032
- Figure 120: Asia Pacific Solar Energy in Trinidad and Tobago Market Volume (megawatt), by Price Trend Analysis 2024 & 2032
- Figure 121: Asia Pacific Solar Energy in Trinidad and Tobago Market Revenue Share (%), by Price Trend Analysis 2024 & 2032
- Figure 122: Asia Pacific Solar Energy in Trinidad and Tobago Market Volume Share (%), by Price Trend Analysis 2024 & 2032
- Figure 123: Asia Pacific Solar Energy in Trinidad and Tobago Market Revenue (Million), by Country 2024 & 2032
- Figure 124: Asia Pacific Solar Energy in Trinidad and Tobago Market Volume (megawatt), by Country 2024 & 2032
- Figure 125: Asia Pacific Solar Energy in Trinidad and Tobago Market Revenue Share (%), by Country 2024 & 2032
- Figure 126: Asia Pacific Solar Energy in Trinidad and Tobago Market Volume Share (%), by Country 2024 & 2032
List of Tables
- Table 1: Global Solar Energy in Trinidad and Tobago Market Revenue Million Forecast, by Region 2019 & 2032
- Table 2: Global Solar Energy in Trinidad and Tobago Market Volume megawatt Forecast, by Region 2019 & 2032
- Table 3: Global Solar Energy in Trinidad and Tobago Market Revenue Million Forecast, by Production Analysis 2019 & 2032
- Table 4: Global Solar Energy in Trinidad and Tobago Market Volume megawatt Forecast, by Production Analysis 2019 & 2032
- Table 5: Global Solar Energy in Trinidad and Tobago Market Revenue Million Forecast, by Consumption Analysis 2019 & 2032
- Table 6: Global Solar Energy in Trinidad and Tobago Market Volume megawatt Forecast, by Consumption Analysis 2019 & 2032
- Table 7: Global Solar Energy in Trinidad and Tobago Market Revenue Million Forecast, by Import Market Analysis (Value & Volume) 2019 & 2032
- Table 8: Global Solar Energy in Trinidad and Tobago Market Volume megawatt Forecast, by Import Market Analysis (Value & Volume) 2019 & 2032
- Table 9: Global Solar Energy in Trinidad and Tobago Market Revenue Million Forecast, by Export Market Analysis (Value & Volume) 2019 & 2032
- Table 10: Global Solar Energy in Trinidad and Tobago Market Volume megawatt Forecast, by Export Market Analysis (Value & Volume) 2019 & 2032
- Table 11: Global Solar Energy in Trinidad and Tobago Market Revenue Million Forecast, by Price Trend Analysis 2019 & 2032
- Table 12: Global Solar Energy in Trinidad and Tobago Market Volume megawatt Forecast, by Price Trend Analysis 2019 & 2032
- Table 13: Global Solar Energy in Trinidad and Tobago Market Revenue Million Forecast, by Region 2019 & 2032
- Table 14: Global Solar Energy in Trinidad and Tobago Market Volume megawatt Forecast, by Region 2019 & 2032
- Table 15: Global Solar Energy in Trinidad and Tobago Market Revenue Million Forecast, by Country 2019 & 2032
- Table 16: Global Solar Energy in Trinidad and Tobago Market Volume megawatt Forecast, by Country 2019 & 2032
- Table 17: Global Solar Energy in Trinidad and Tobago Market Revenue Million Forecast, by Production Analysis 2019 & 2032
- Table 18: Global Solar Energy in Trinidad and Tobago Market Volume megawatt Forecast, by Production Analysis 2019 & 2032
- Table 19: Global Solar Energy in Trinidad and Tobago Market Revenue Million Forecast, by Consumption Analysis 2019 & 2032
- Table 20: Global Solar Energy in Trinidad and Tobago Market Volume megawatt Forecast, by Consumption Analysis 2019 & 2032
- Table 21: Global Solar Energy in Trinidad and Tobago Market Revenue Million Forecast, by Import Market Analysis (Value & Volume) 2019 & 2032
- Table 22: Global Solar Energy in Trinidad and Tobago Market Volume megawatt Forecast, by Import Market Analysis (Value & Volume) 2019 & 2032
- Table 23: Global Solar Energy in Trinidad and Tobago Market Revenue Million Forecast, by Export Market Analysis (Value & Volume) 2019 & 2032
- Table 24: Global Solar Energy in Trinidad and Tobago Market Volume megawatt Forecast, by Export Market Analysis (Value & Volume) 2019 & 2032
- Table 25: Global Solar Energy in Trinidad and Tobago Market Revenue Million Forecast, by Price Trend Analysis 2019 & 2032
- Table 26: Global Solar Energy in Trinidad and Tobago Market Volume megawatt Forecast, by Price Trend Analysis 2019 & 2032
- Table 27: Global Solar Energy in Trinidad and Tobago Market Revenue Million Forecast, by Country 2019 & 2032
- Table 28: Global Solar Energy in Trinidad and Tobago Market Volume megawatt Forecast, by Country 2019 & 2032
- Table 29: United States Solar Energy in Trinidad and Tobago Market Revenue (Million) Forecast, by Application 2019 & 2032
- Table 30: United States Solar Energy in Trinidad and Tobago Market Volume (megawatt) Forecast, by Application 2019 & 2032
- Table 31: Canada Solar Energy in Trinidad and Tobago Market Revenue (Million) Forecast, by Application 2019 & 2032
- Table 32: Canada Solar Energy in Trinidad and Tobago Market Volume (megawatt) Forecast, by Application 2019 & 2032
- Table 33: Mexico Solar Energy in Trinidad and Tobago Market Revenue (Million) Forecast, by Application 2019 & 2032
- Table 34: Mexico Solar Energy in Trinidad and Tobago Market Volume (megawatt) Forecast, by Application 2019 & 2032
- Table 35: Global Solar Energy in Trinidad and Tobago Market Revenue Million Forecast, by Production Analysis 2019 & 2032
- Table 36: Global Solar Energy in Trinidad and Tobago Market Volume megawatt Forecast, by Production Analysis 2019 & 2032
- Table 37: Global Solar Energy in Trinidad and Tobago Market Revenue Million Forecast, by Consumption Analysis 2019 & 2032
- Table 38: Global Solar Energy in Trinidad and Tobago Market Volume megawatt Forecast, by Consumption Analysis 2019 & 2032
- Table 39: Global Solar Energy in Trinidad and Tobago Market Revenue Million Forecast, by Import Market Analysis (Value & Volume) 2019 & 2032
- Table 40: Global Solar Energy in Trinidad and Tobago Market Volume megawatt Forecast, by Import Market Analysis (Value & Volume) 2019 & 2032
- Table 41: Global Solar Energy in Trinidad and Tobago Market Revenue Million Forecast, by Export Market Analysis (Value & Volume) 2019 & 2032
- Table 42: Global Solar Energy in Trinidad and Tobago Market Volume megawatt Forecast, by Export Market Analysis (Value & Volume) 2019 & 2032
- Table 43: Global Solar Energy in Trinidad and Tobago Market Revenue Million Forecast, by Price Trend Analysis 2019 & 2032
- Table 44: Global Solar Energy in Trinidad and Tobago Market Volume megawatt Forecast, by Price Trend Analysis 2019 & 2032
- Table 45: Global Solar Energy in Trinidad and Tobago Market Revenue Million Forecast, by Country 2019 & 2032
- Table 46: Global Solar Energy in Trinidad and Tobago Market Volume megawatt Forecast, by Country 2019 & 2032
- Table 47: Brazil Solar Energy in Trinidad and Tobago Market Revenue (Million) Forecast, by Application 2019 & 2032
- Table 48: Brazil Solar Energy in Trinidad and Tobago Market Volume (megawatt) Forecast, by Application 2019 & 2032
- Table 49: Argentina Solar Energy in Trinidad and Tobago Market Revenue (Million) Forecast, by Application 2019 & 2032
- Table 50: Argentina Solar Energy in Trinidad and Tobago Market Volume (megawatt) Forecast, by Application 2019 & 2032
- Table 51: Rest of South America Solar Energy in Trinidad and Tobago Market Revenue (Million) Forecast, by Application 2019 & 2032
- Table 52: Rest of South America Solar Energy in Trinidad and Tobago Market Volume (megawatt) Forecast, by Application 2019 & 2032
- Table 53: Global Solar Energy in Trinidad and Tobago Market Revenue Million Forecast, by Production Analysis 2019 & 2032
- Table 54: Global Solar Energy in Trinidad and Tobago Market Volume megawatt Forecast, by Production Analysis 2019 & 2032
- Table 55: Global Solar Energy in Trinidad and Tobago Market Revenue Million Forecast, by Consumption Analysis 2019 & 2032
- Table 56: Global Solar Energy in Trinidad and Tobago Market Volume megawatt Forecast, by Consumption Analysis 2019 & 2032
- Table 57: Global Solar Energy in Trinidad and Tobago Market Revenue Million Forecast, by Import Market Analysis (Value & Volume) 2019 & 2032
- Table 58: Global Solar Energy in Trinidad and Tobago Market Volume megawatt Forecast, by Import Market Analysis (Value & Volume) 2019 & 2032
- Table 59: Global Solar Energy in Trinidad and Tobago Market Revenue Million Forecast, by Export Market Analysis (Value & Volume) 2019 & 2032
- Table 60: Global Solar Energy in Trinidad and Tobago Market Volume megawatt Forecast, by Export Market Analysis (Value & Volume) 2019 & 2032
- Table 61: Global Solar Energy in Trinidad and Tobago Market Revenue Million Forecast, by Price Trend Analysis 2019 & 2032
- Table 62: Global Solar Energy in Trinidad and Tobago Market Volume megawatt Forecast, by Price Trend Analysis 2019 & 2032
- Table 63: Global Solar Energy in Trinidad and Tobago Market Revenue Million Forecast, by Country 2019 & 2032
- Table 64: Global Solar Energy in Trinidad and Tobago Market Volume megawatt Forecast, by Country 2019 & 2032
- Table 65: United Kingdom Solar Energy in Trinidad and Tobago Market Revenue (Million) Forecast, by Application 2019 & 2032
- Table 66: United Kingdom Solar Energy in Trinidad and Tobago Market Volume (megawatt) Forecast, by Application 2019 & 2032
- Table 67: Germany Solar Energy in Trinidad and Tobago Market Revenue (Million) Forecast, by Application 2019 & 2032
- Table 68: Germany Solar Energy in Trinidad and Tobago Market Volume (megawatt) Forecast, by Application 2019 & 2032
- Table 69: France Solar Energy in Trinidad and Tobago Market Revenue (Million) Forecast, by Application 2019 & 2032
- Table 70: France Solar Energy in Trinidad and Tobago Market Volume (megawatt) Forecast, by Application 2019 & 2032
- Table 71: Italy Solar Energy in Trinidad and Tobago Market Revenue (Million) Forecast, by Application 2019 & 2032
- Table 72: Italy Solar Energy in Trinidad and Tobago Market Volume (megawatt) Forecast, by Application 2019 & 2032
- Table 73: Spain Solar Energy in Trinidad and Tobago Market Revenue (Million) Forecast, by Application 2019 & 2032
- Table 74: Spain Solar Energy in Trinidad and Tobago Market Volume (megawatt) Forecast, by Application 2019 & 2032
- Table 75: Russia Solar Energy in Trinidad and Tobago Market Revenue (Million) Forecast, by Application 2019 & 2032
- Table 76: Russia Solar Energy in Trinidad and Tobago Market Volume (megawatt) Forecast, by Application 2019 & 2032
- Table 77: Benelux Solar Energy in Trinidad and Tobago Market Revenue (Million) Forecast, by Application 2019 & 2032
- Table 78: Benelux Solar Energy in Trinidad and Tobago Market Volume (megawatt) Forecast, by Application 2019 & 2032
- Table 79: Nordics Solar Energy in Trinidad and Tobago Market Revenue (Million) Forecast, by Application 2019 & 2032
- Table 80: Nordics Solar Energy in Trinidad and Tobago Market Volume (megawatt) Forecast, by Application 2019 & 2032
- Table 81: Rest of Europe Solar Energy in Trinidad and Tobago Market Revenue (Million) Forecast, by Application 2019 & 2032
- Table 82: Rest of Europe Solar Energy in Trinidad and Tobago Market Volume (megawatt) Forecast, by Application 2019 & 2032
- Table 83: Global Solar Energy in Trinidad and Tobago Market Revenue Million Forecast, by Production Analysis 2019 & 2032
- Table 84: Global Solar Energy in Trinidad and Tobago Market Volume megawatt Forecast, by Production Analysis 2019 & 2032
- Table 85: Global Solar Energy in Trinidad and Tobago Market Revenue Million Forecast, by Consumption Analysis 2019 & 2032
- Table 86: Global Solar Energy in Trinidad and Tobago Market Volume megawatt Forecast, by Consumption Analysis 2019 & 2032
- Table 87: Global Solar Energy in Trinidad and Tobago Market Revenue Million Forecast, by Import Market Analysis (Value & Volume) 2019 & 2032
- Table 88: Global Solar Energy in Trinidad and Tobago Market Volume megawatt Forecast, by Import Market Analysis (Value & Volume) 2019 & 2032
- Table 89: Global Solar Energy in Trinidad and Tobago Market Revenue Million Forecast, by Export Market Analysis (Value & Volume) 2019 & 2032
- Table 90: Global Solar Energy in Trinidad and Tobago Market Volume megawatt Forecast, by Export Market Analysis (Value & Volume) 2019 & 2032
- Table 91: Global Solar Energy in Trinidad and Tobago Market Revenue Million Forecast, by Price Trend Analysis 2019 & 2032
- Table 92: Global Solar Energy in Trinidad and Tobago Market Volume megawatt Forecast, by Price Trend Analysis 2019 & 2032
- Table 93: Global Solar Energy in Trinidad and Tobago Market Revenue Million Forecast, by Country 2019 & 2032
- Table 94: Global Solar Energy in Trinidad and Tobago Market Volume megawatt Forecast, by Country 2019 & 2032
- Table 95: Turkey Solar Energy in Trinidad and Tobago Market Revenue (Million) Forecast, by Application 2019 & 2032
- Table 96: Turkey Solar Energy in Trinidad and Tobago Market Volume (megawatt) Forecast, by Application 2019 & 2032
- Table 97: Israel Solar Energy in Trinidad and Tobago Market Revenue (Million) Forecast, by Application 2019 & 2032
- Table 98: Israel Solar Energy in Trinidad and Tobago Market Volume (megawatt) Forecast, by Application 2019 & 2032
- Table 99: GCC Solar Energy in Trinidad and Tobago Market Revenue (Million) Forecast, by Application 2019 & 2032
- Table 100: GCC Solar Energy in Trinidad and Tobago Market Volume (megawatt) Forecast, by Application 2019 & 2032
- Table 101: North Africa Solar Energy in Trinidad and Tobago Market Revenue (Million) Forecast, by Application 2019 & 2032
- Table 102: North Africa Solar Energy in Trinidad and Tobago Market Volume (megawatt) Forecast, by Application 2019 & 2032
- Table 103: South Africa Solar Energy in Trinidad and Tobago Market Revenue (Million) Forecast, by Application 2019 & 2032
- Table 104: South Africa Solar Energy in Trinidad and Tobago Market Volume (megawatt) Forecast, by Application 2019 & 2032
- Table 105: Rest of Middle East & Africa Solar Energy in Trinidad and Tobago Market Revenue (Million) Forecast, by Application 2019 & 2032
- Table 106: Rest of Middle East & Africa Solar Energy in Trinidad and Tobago Market Volume (megawatt) Forecast, by Application 2019 & 2032
- Table 107: Global Solar Energy in Trinidad and Tobago Market Revenue Million Forecast, by Production Analysis 2019 & 2032
- Table 108: Global Solar Energy in Trinidad and Tobago Market Volume megawatt Forecast, by Production Analysis 2019 & 2032
- Table 109: Global Solar Energy in Trinidad and Tobago Market Revenue Million Forecast, by Consumption Analysis 2019 & 2032
- Table 110: Global Solar Energy in Trinidad and Tobago Market Volume megawatt Forecast, by Consumption Analysis 2019 & 2032
- Table 111: Global Solar Energy in Trinidad and Tobago Market Revenue Million Forecast, by Import Market Analysis (Value & Volume) 2019 & 2032
- Table 112: Global Solar Energy in Trinidad and Tobago Market Volume megawatt Forecast, by Import Market Analysis (Value & Volume) 2019 & 2032
- Table 113: Global Solar Energy in Trinidad and Tobago Market Revenue Million Forecast, by Export Market Analysis (Value & Volume) 2019 & 2032
- Table 114: Global Solar Energy in Trinidad and Tobago Market Volume megawatt Forecast, by Export Market Analysis (Value & Volume) 2019 & 2032
- Table 115: Global Solar Energy in Trinidad and Tobago Market Revenue Million Forecast, by Price Trend Analysis 2019 & 2032
- Table 116: Global Solar Energy in Trinidad and Tobago Market Volume megawatt Forecast, by Price Trend Analysis 2019 & 2032
- Table 117: Global Solar Energy in Trinidad and Tobago Market Revenue Million Forecast, by Country 2019 & 2032
- Table 118: Global Solar Energy in Trinidad and Tobago Market Volume megawatt Forecast, by Country 2019 & 2032
- Table 119: China Solar Energy in Trinidad and Tobago Market Revenue (Million) Forecast, by Application 2019 & 2032
- Table 120: China Solar Energy in Trinidad and Tobago Market Volume (megawatt) Forecast, by Application 2019 & 2032
- Table 121: India Solar Energy in Trinidad and Tobago Market Revenue (Million) Forecast, by Application 2019 & 2032
- Table 122: India Solar Energy in Trinidad and Tobago Market Volume (megawatt) Forecast, by Application 2019 & 2032
- Table 123: Japan Solar Energy in Trinidad and Tobago Market Revenue (Million) Forecast, by Application 2019 & 2032
- Table 124: Japan Solar Energy in Trinidad and Tobago Market Volume (megawatt) Forecast, by Application 2019 & 2032
- Table 125: South Korea Solar Energy in Trinidad and Tobago Market Revenue (Million) Forecast, by Application 2019 & 2032
- Table 126: South Korea Solar Energy in Trinidad and Tobago Market Volume (megawatt) Forecast, by Application 2019 & 2032
- Table 127: ASEAN Solar Energy in Trinidad and Tobago Market Revenue (Million) Forecast, by Application 2019 & 2032
- Table 128: ASEAN Solar Energy in Trinidad and Tobago Market Volume (megawatt) Forecast, by Application 2019 & 2032
- Table 129: Oceania Solar Energy in Trinidad and Tobago Market Revenue (Million) Forecast, by Application 2019 & 2032
- Table 130: Oceania Solar Energy in Trinidad and Tobago Market Volume (megawatt) Forecast, by Application 2019 & 2032
- Table 131: Rest of Asia Pacific Solar Energy in Trinidad and Tobago Market Revenue (Million) Forecast, by Application 2019 & 2032
- Table 132: Rest of Asia Pacific Solar Energy in Trinidad and Tobago Market Volume (megawatt) Forecast, by Application 2019 & 2032
Frequently Asked Questions
1. What is the projected Compound Annual Growth Rate (CAGR) of the Solar Energy in Trinidad and Tobago Market?
The projected CAGR is approximately 109.30%.
2. Which companies are prominent players in the Solar Energy in Trinidad and Tobago Market?
Key companies in the market include SolarWorld-tt, AMBA Energy Limited, Resscott Ltd, Lightsource BP*List Not Exhaustive, Trifactor Technical Sales and Services Ltd, AIMS Power.
3. What are the main segments of the Solar Energy in Trinidad and Tobago Market?
The market segments include Production Analysis, Consumption Analysis, Import Market Analysis (Value & Volume), Export Market Analysis (Value & Volume), Price Trend Analysis.
4. Can you provide details about the market size?
The market size is estimated to be USD XX Million as of 2022.
5. What are some drivers contributing to market growth?
Rising Environmental Concerns and Energy Security in the Country; Increasing Focus on Renewable Energy.
6. What are the notable trends driving market growth?
Increasing Demand for Clean Electricity Generation Expected to Drive the Market.
7. Are there any restraints impacting market growth?
Availability of Abundance Natural Fossil Fuel Reserves.
8. Can you provide examples of recent developments in the market?
April 2023: BP and Shell broke ground on Trinidad and Tobago's first utility-scale solar project at Brechin Castle. The 112MWac solar project comprised two sites, Orange Grove and Brechin Castle. The project is estimated to generate around 300,000 MWh of clean electricity per year, sufficient to power the equivalent of 42,500 homes and help to reduce carbon emissions.
9. What pricing options are available for accessing the report?
Pricing options include single-user, multi-user, and enterprise licenses priced at USD 3800, USD 4500, and USD 5800 respectively.
10. Is the market size provided in terms of value or volume?
The market size is provided in terms of value, measured in Million and volume, measured in megawatt.
11. Are there any specific market keywords associated with the report?
Yes, the market keyword associated with the report is "Solar Energy in Trinidad and Tobago Market," which aids in identifying and referencing the specific market segment covered.
12. How do I determine which pricing option suits my needs best?
The pricing options vary based on user requirements and access needs. Individual users may opt for single-user licenses, while businesses requiring broader access may choose multi-user or enterprise licenses for cost-effective access to the report.
13. Are there any additional resources or data provided in the Solar Energy in Trinidad and Tobago Market report?
While the report offers comprehensive insights, it's advisable to review the specific contents or supplementary materials provided to ascertain if additional resources or data are available.
14. How can I stay updated on further developments or reports in the Solar Energy in Trinidad and Tobago Market?
To stay informed about further developments, trends, and reports in the Solar Energy in Trinidad and Tobago Market, consider subscribing to industry newsletters, following relevant companies and organizations, or regularly checking reputable industry news sources and publications.
Methodology
Step 1 - Identification of Relevant Samples Size from Population Database


Step 2 - Approaches for Defining Global Market Size (Value, Volume* & Price*)

Note*: In applicable scenarios
Step 3 - Data Sources
Primary Research
- Web Analytics
- Survey Reports
- Research Institute
- Latest Research Reports
- Opinion Leaders
Secondary Research
- Annual Reports
- White Paper
- Latest Press Release
- Industry Association
- Paid Database
- Investor Presentations

Step 4 - Data Triangulation
Involves using different sources of information in order to increase the validity of a study
These sources are likely to be stakeholders in a program - participants, other researchers, program staff, other community members, and so on.
Then we put all data in single framework & apply various statistical tools to find out the dynamic on the market.
During the analysis stage, feedback from the stakeholder groups would be compared to determine areas of agreement as well as areas of divergence


