
Key Insights
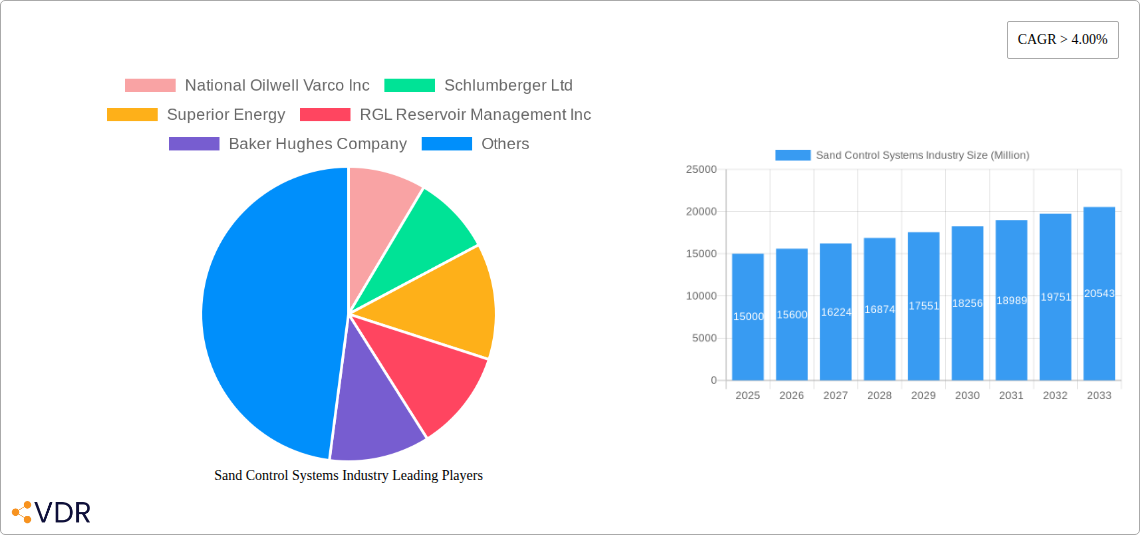
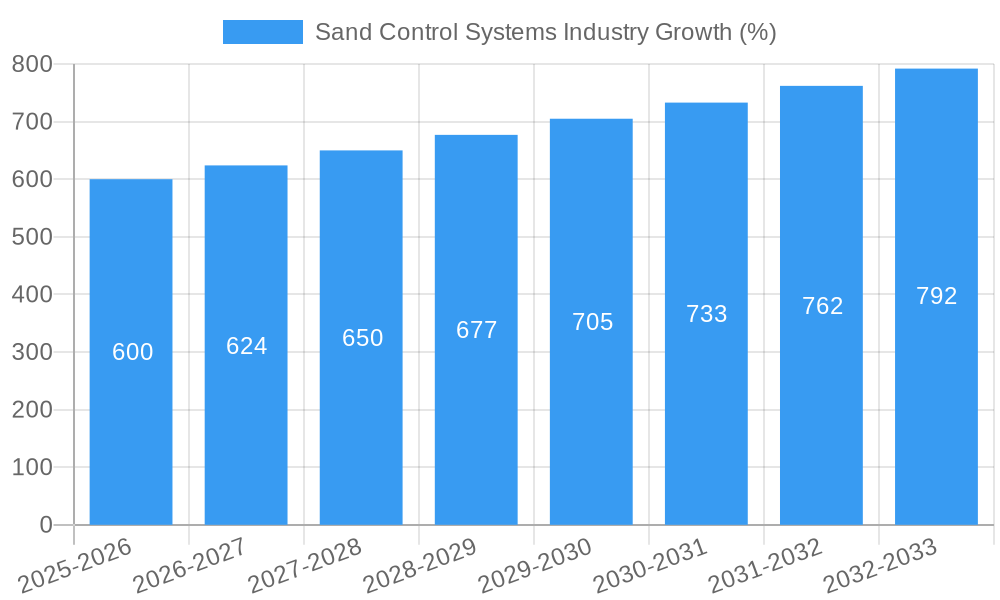
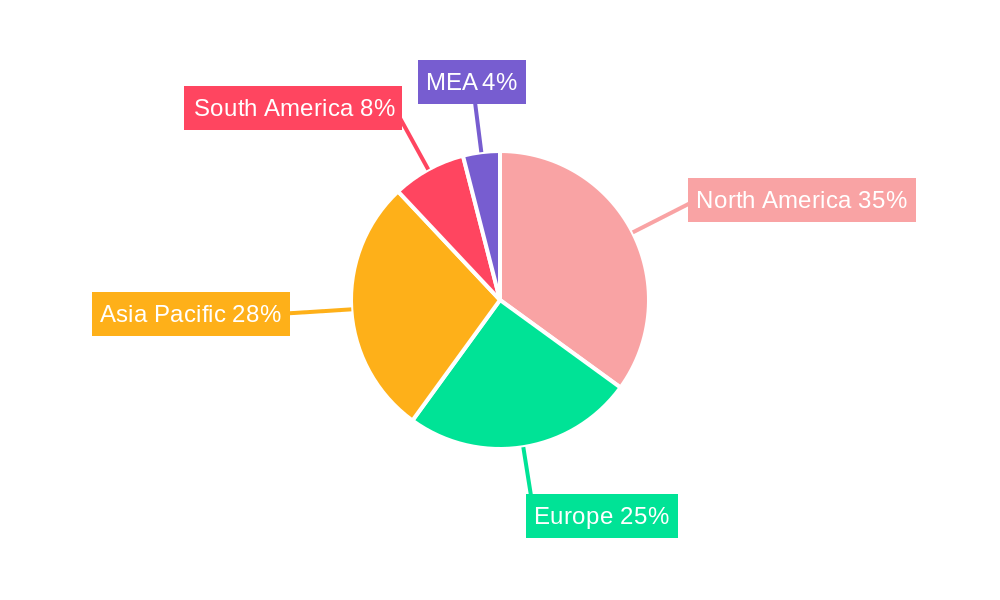
The global sand control systems market is experiencing robust growth, driven by the increasing demand for enhanced oil recovery (EOR) techniques and the exploration of challenging reservoir formations. The market's Compound Annual Growth Rate (CAGR) exceeding 4% indicates a consistent upward trajectory projected through 2033. This expansion is fueled by several key factors: the rising global energy demand necessitating efficient oil and gas production; the increasing adoption of advanced sand control methods, particularly active sand control, which offers superior performance compared to passive methods; and significant investments in offshore oil and gas exploration, where sand control is crucial. The market is segmented by well type (open hole and cased hole), location (onshore and offshore), and sand control method (passive and active). While the North American market currently holds a significant share, the Asia-Pacific region is projected to witness substantial growth due to the increasing number of oil and gas exploration projects in this area. Major players like Schlumberger, Halliburton, and Baker Hughes are leveraging technological advancements and strategic partnerships to maintain their market leadership.
The competitive landscape is characterized by both established players and emerging companies offering specialized solutions. The market's growth is, however, subject to certain restraints. Fluctuations in oil and gas prices significantly impact investment decisions within the industry. Additionally, the high initial investment costs associated with advanced sand control technologies can pose a barrier to entry for smaller companies. Furthermore, environmental regulations and safety concerns related to offshore operations influence the deployment of sand control systems. Despite these challenges, the long-term outlook for the sand control systems market remains positive, fueled by ongoing technological innovation and the persistent need for efficient and reliable oil and gas production globally. The projected market size of 2033 indicates strong potential for sustained growth and investment in this sector.
Sand Control Systems Industry Market Report: 2019-2033
This comprehensive report provides an in-depth analysis of the global Sand Control Systems market, encompassing historical data (2019-2024), current estimates (2025), and future forecasts (2025-2033). It segments the market by well type (open hole, cased hole), location of deployment (onshore, offshore), and sand control method (passive, active), offering a granular view of this critical sector within the oil and gas industry. Key players like National Oilwell Varco Inc, Schlumberger Ltd, Superior Energy, RGL Reservoir Management Inc, Baker Hughes Company, Halliburton Company, Welltec A/S, and Weatherford International Ltd are analyzed, providing insights into market dynamics and competitive landscapes. The report is a valuable resource for industry professionals, investors, and anyone seeking to understand the evolving landscape of sand control technologies. The total market value in 2025 is estimated at xx Million.
Sand Control Systems Industry Market Dynamics & Structure
The Sand Control Systems market is characterized by a moderately consolidated structure, with major players holding significant market share. Technological innovation, driven by the need for enhanced efficiency and reduced environmental impact, is a key growth driver. Stringent regulatory frameworks governing well integrity and environmental protection influence market dynamics. Competitive pressure from substitute technologies and the increasing adoption of advanced materials are also noteworthy. The market demonstrates considerable M&A activity, reflecting the pursuit of economies of scale and technological capabilities.
- Market Concentration: The top 5 players hold approximately xx% of the market share in 2025.
- Technological Innovation: Advancements in materials science, downhole tools, and data analytics are driving innovation.
- Regulatory Landscape: Stringent environmental regulations and safety standards significantly influence product development and deployment strategies.
- Competitive Substitutes: Alternative sand control techniques and emerging technologies present competitive challenges.
- M&A Activity: The number of M&A deals in the sector averaged xx per year during the historical period (2019-2024).
- End-user Demographics: The market is primarily driven by the needs of upstream oil and gas operators.
Sand Control Systems Industry Growth Trends & Insights
The global Sand Control Systems market experienced a Compound Annual Growth Rate (CAGR) of xx% during the historical period (2019-2024). This growth is attributed to increasing oil and gas exploration and production activities, particularly in offshore and unconventional resources. Technological advancements, leading to improved efficiency and reduced operational costs, are further propelling market expansion. The adoption of advanced sand control techniques is increasing as operators seek to optimize well productivity and extend well life. The market penetration rate for advanced sand control methods is estimated at xx% in 2025, projected to reach xx% by 2033. Shifts in consumer behavior, such as a preference for sustainable and environmentally friendly solutions, are influencing market trends. The market size is projected to reach xx Million by 2033.
Dominant Regions, Countries, or Segments in Sand Control Systems Industry
The North American region currently holds the largest market share, driven by extensive oil and gas exploration and production activities, robust infrastructure, and supportive regulatory environment. However, the Asia-Pacific region is anticipated to demonstrate the fastest growth rate due to rising energy demands and increasing investments in oil and gas infrastructure. Within the segments, the cased hole segment dominates in terms of market share, while the offshore deployment location showcases higher growth potential. Active sand control methods are gaining traction due to their superior performance compared to passive measures.
- Key Drivers (North America): Strong upstream oil and gas activities, well-developed infrastructure.
- Key Drivers (Asia-Pacific): Rising energy demand, increasing investments in oil and gas infrastructure.
- Segment Dominance: Cased hole segment holds the largest market share due to widespread adoption in conventional and unconventional wells.
- Growth Potential: Offshore deployment location exhibits high growth potential owing to exploration and production in deepwater environments.
Sand Control Systems Industry Product Landscape
The Sand Control Systems market offers a diverse range of products, including gravel packs, resin-coated proppants, and various advanced technologies like expandable screens and inflatable packers. These systems are designed to prevent sand production from oil and gas wells, enhancing well productivity and extending operational life. Recent innovations focus on improving the efficiency and longevity of sand control systems. Unique selling propositions include enhanced sand retention capabilities, reduced installation times, and improved compatibility with different wellbore conditions. Key advancements include the development of high-strength, durable materials and the integration of smart sensors for real-time monitoring.
Key Drivers, Barriers & Challenges in Sand Control Systems Industry
Key Drivers: Increased oil and gas exploration and production, particularly in unconventional resources, rising demand for enhanced oil recovery techniques, technological advancements leading to improved efficiency and cost reduction.
Key Challenges: High upfront capital investment, complex installation procedures, potential environmental concerns associated with certain sand control methods, intense competition among industry players. Supply chain disruptions can impact availability and pricing, and regulatory changes may necessitate costly product modifications. The market faces approximately xx million in potential losses annually due to supply chain challenges.
Emerging Opportunities in Sand Control Systems Industry
Emerging opportunities include the development of environmentally friendly sand control technologies, the expansion into unconventional resource plays, and the integration of advanced digital technologies for real-time monitoring and optimization. Untapped markets in developing countries and the growing adoption of enhanced oil recovery techniques are creating new avenues for growth. The focus on sustainability is driving demand for solutions with minimized environmental impact.
Growth Accelerators in the Sand Control Systems Industry Industry
Technological breakthroughs in materials science and data analytics are key catalysts for market growth. Strategic partnerships and collaborations among industry players are fostering innovation and accelerating the development of next-generation sand control systems. Market expansion strategies, such as penetrating new geographical regions and targeting emerging applications, are crucial for sustaining long-term growth.
Key Players Shaping the Sand Control Systems Industry Market
- National Oilwell Varco Inc
- Schlumberger Ltd
- Superior Energy
- RGL Reservoir Management Inc
- Baker Hughes Company
- Halliburton Company
- Welltec A/S
- Weatherford International Ltd
Notable Milestones in Sand Control Systems Industry Sector
- 2020: Introduction of a new generation of resin-coated proppants with enhanced sand retention capabilities.
- 2022: Successful field trial of an innovative expandable screen technology in a deepwater environment.
- 2023: Merger between two key players, leading to increased market consolidation. (Specific details require further investigation and are unavailable at this time).
In-Depth Sand Control Systems Industry Market Outlook
The Sand Control Systems market is poised for robust growth over the forecast period (2025-2033), driven by ongoing technological advancements and increasing demand for efficient and sustainable solutions. Strategic partnerships and investments in research and development will continue to fuel innovation. Opportunities exist in expanding into emerging markets, developing environmentally friendly technologies, and leveraging the potential of digitalization. The market is well positioned for significant growth, offering attractive prospects for both established players and new entrants.
Sand Control Systems Industry Segmentation
-
1. Well Type
- 1.1. Open Hole
- 1.2. Cased Hole
-
2. Location of Deployment
- 2.1. Onshore
- 2.2. Offshore
-
3. Sand Control Method
- 3.1. Passive Sand Control (Non-intrusive Measures)
-
3.2. Active Sand Control (Intrusive Measures)
- 3.2.1. Resin Injection
- 3.2.2. Gravel Pack
- 3.2.3. Slotted Liners
- 3.2.4. Frack Pack
- 3.2.5. Other Methods
Sand Control Systems Industry Segmentation By Geography
- 1. North America
- 2. Europe
- 3. Asia Pacific
- 4. South America
- 5. Middle East and Africa
Sand Control Systems Industry REPORT HIGHLIGHTS
| Aspects | Details |
|---|---|
| Study Period | 2019-2033 |
| Base Year | 2024 |
| Estimated Year | 2025 |
| Forecast Period | 2025-2033 |
| Historical Period | 2019-2024 |
| Growth Rate | CAGR of > 4.00% from 2019-2033 |
| Segmentation |
|
Table of Contents
- 1. Introduction
- 1.1. Research Scope
- 1.2. Market Segmentation
- 1.3. Research Methodology
- 1.4. Definitions and Assumptions
- 2. Executive Summary
- 2.1. Introduction
- 3. Market Dynamics
- 3.1. Introduction
- 3.2. Market Drivers
- 3.2.1. 4.; The Rise in Oil and Gas Drilling Activities4.; Increased Shale Gas Exploration
- 3.3. Market Restrains
- 3.3.1. 4.; Increasing Share of Renewable Energy
- 3.4. Market Trends
- 3.4.1. Offshore Segment to Dominate the Market
- 4. Market Factor Analysis
- 4.1. Porters Five Forces
- 4.2. Supply/Value Chain
- 4.3. PESTEL analysis
- 4.4. Market Entropy
- 4.5. Patent/Trademark Analysis
- 5. Global Sand Control Systems Industry Analysis, Insights and Forecast, 2019-2031
- 5.1. Market Analysis, Insights and Forecast - by Well Type
- 5.1.1. Open Hole
- 5.1.2. Cased Hole
- 5.2. Market Analysis, Insights and Forecast - by Location of Deployment
- 5.2.1. Onshore
- 5.2.2. Offshore
- 5.3. Market Analysis, Insights and Forecast - by Sand Control Method
- 5.3.1. Passive Sand Control (Non-intrusive Measures)
- 5.3.2. Active Sand Control (Intrusive Measures)
- 5.3.2.1. Resin Injection
- 5.3.2.2. Gravel Pack
- 5.3.2.3. Slotted Liners
- 5.3.2.4. Frack Pack
- 5.3.2.5. Other Methods
- 5.4. Market Analysis, Insights and Forecast - by Region
- 5.4.1. North America
- 5.4.2. Europe
- 5.4.3. Asia Pacific
- 5.4.4. South America
- 5.4.5. Middle East and Africa
- 5.1. Market Analysis, Insights and Forecast - by Well Type
- 6. North America Sand Control Systems Industry Analysis, Insights and Forecast, 2019-2031
- 6.1. Market Analysis, Insights and Forecast - by Well Type
- 6.1.1. Open Hole
- 6.1.2. Cased Hole
- 6.2. Market Analysis, Insights and Forecast - by Location of Deployment
- 6.2.1. Onshore
- 6.2.2. Offshore
- 6.3. Market Analysis, Insights and Forecast - by Sand Control Method
- 6.3.1. Passive Sand Control (Non-intrusive Measures)
- 6.3.2. Active Sand Control (Intrusive Measures)
- 6.3.2.1. Resin Injection
- 6.3.2.2. Gravel Pack
- 6.3.2.3. Slotted Liners
- 6.3.2.4. Frack Pack
- 6.3.2.5. Other Methods
- 6.1. Market Analysis, Insights and Forecast - by Well Type
- 7. Europe Sand Control Systems Industry Analysis, Insights and Forecast, 2019-2031
- 7.1. Market Analysis, Insights and Forecast - by Well Type
- 7.1.1. Open Hole
- 7.1.2. Cased Hole
- 7.2. Market Analysis, Insights and Forecast - by Location of Deployment
- 7.2.1. Onshore
- 7.2.2. Offshore
- 7.3. Market Analysis, Insights and Forecast - by Sand Control Method
- 7.3.1. Passive Sand Control (Non-intrusive Measures)
- 7.3.2. Active Sand Control (Intrusive Measures)
- 7.3.2.1. Resin Injection
- 7.3.2.2. Gravel Pack
- 7.3.2.3. Slotted Liners
- 7.3.2.4. Frack Pack
- 7.3.2.5. Other Methods
- 7.1. Market Analysis, Insights and Forecast - by Well Type
- 8. Asia Pacific Sand Control Systems Industry Analysis, Insights and Forecast, 2019-2031
- 8.1. Market Analysis, Insights and Forecast - by Well Type
- 8.1.1. Open Hole
- 8.1.2. Cased Hole
- 8.2. Market Analysis, Insights and Forecast - by Location of Deployment
- 8.2.1. Onshore
- 8.2.2. Offshore
- 8.3. Market Analysis, Insights and Forecast - by Sand Control Method
- 8.3.1. Passive Sand Control (Non-intrusive Measures)
- 8.3.2. Active Sand Control (Intrusive Measures)
- 8.3.2.1. Resin Injection
- 8.3.2.2. Gravel Pack
- 8.3.2.3. Slotted Liners
- 8.3.2.4. Frack Pack
- 8.3.2.5. Other Methods
- 8.1. Market Analysis, Insights and Forecast - by Well Type
- 9. South America Sand Control Systems Industry Analysis, Insights and Forecast, 2019-2031
- 9.1. Market Analysis, Insights and Forecast - by Well Type
- 9.1.1. Open Hole
- 9.1.2. Cased Hole
- 9.2. Market Analysis, Insights and Forecast - by Location of Deployment
- 9.2.1. Onshore
- 9.2.2. Offshore
- 9.3. Market Analysis, Insights and Forecast - by Sand Control Method
- 9.3.1. Passive Sand Control (Non-intrusive Measures)
- 9.3.2. Active Sand Control (Intrusive Measures)
- 9.3.2.1. Resin Injection
- 9.3.2.2. Gravel Pack
- 9.3.2.3. Slotted Liners
- 9.3.2.4. Frack Pack
- 9.3.2.5. Other Methods
- 9.1. Market Analysis, Insights and Forecast - by Well Type
- 10. Middle East and Africa Sand Control Systems Industry Analysis, Insights and Forecast, 2019-2031
- 10.1. Market Analysis, Insights and Forecast - by Well Type
- 10.1.1. Open Hole
- 10.1.2. Cased Hole
- 10.2. Market Analysis, Insights and Forecast - by Location of Deployment
- 10.2.1. Onshore
- 10.2.2. Offshore
- 10.3. Market Analysis, Insights and Forecast - by Sand Control Method
- 10.3.1. Passive Sand Control (Non-intrusive Measures)
- 10.3.2. Active Sand Control (Intrusive Measures)
- 10.3.2.1. Resin Injection
- 10.3.2.2. Gravel Pack
- 10.3.2.3. Slotted Liners
- 10.3.2.4. Frack Pack
- 10.3.2.5. Other Methods
- 10.1. Market Analysis, Insights and Forecast - by Well Type
- 11. North America Sand Control Systems Industry Analysis, Insights and Forecast, 2019-2031
- 11.1. Market Analysis, Insights and Forecast - By Country/Sub-region
- 11.1.1 United States
- 11.1.2 Canada
- 11.1.3 Mexico
- 12. Europe Sand Control Systems Industry Analysis, Insights and Forecast, 2019-2031
- 12.1. Market Analysis, Insights and Forecast - By Country/Sub-region
- 12.1.1 Germany
- 12.1.2 United Kingdom
- 12.1.3 France
- 12.1.4 Spain
- 12.1.5 Italy
- 12.1.6 Spain
- 12.1.7 Belgium
- 12.1.8 Netherland
- 12.1.9 Nordics
- 12.1.10 Rest of Europe
- 13. Asia Pacific Sand Control Systems Industry Analysis, Insights and Forecast, 2019-2031
- 13.1. Market Analysis, Insights and Forecast - By Country/Sub-region
- 13.1.1 China
- 13.1.2 Japan
- 13.1.3 India
- 13.1.4 South Korea
- 13.1.5 Southeast Asia
- 13.1.6 Australia
- 13.1.7 Indonesia
- 13.1.8 Phillipes
- 13.1.9 Singapore
- 13.1.10 Thailandc
- 13.1.11 Rest of Asia Pacific
- 14. South America Sand Control Systems Industry Analysis, Insights and Forecast, 2019-2031
- 14.1. Market Analysis, Insights and Forecast - By Country/Sub-region
- 14.1.1 Brazil
- 14.1.2 Argentina
- 14.1.3 Peru
- 14.1.4 Chile
- 14.1.5 Colombia
- 14.1.6 Ecuador
- 14.1.7 Venezuela
- 14.1.8 Rest of South America
- 15. North America Sand Control Systems Industry Analysis, Insights and Forecast, 2019-2031
- 15.1. Market Analysis, Insights and Forecast - By Country/Sub-region
- 15.1.1 United States
- 15.1.2 Canada
- 15.1.3 Mexico
- 16. MEA Sand Control Systems Industry Analysis, Insights and Forecast, 2019-2031
- 16.1. Market Analysis, Insights and Forecast - By Country/Sub-region
- 16.1.1 United Arab Emirates
- 16.1.2 Saudi Arabia
- 16.1.3 South Africa
- 16.1.4 Rest of Middle East and Africa
- 17. Competitive Analysis
- 17.1. Global Market Share Analysis 2024
- 17.2. Company Profiles
- 17.2.1 National Oilwell Varco Inc
- 17.2.1.1. Overview
- 17.2.1.2. Products
- 17.2.1.3. SWOT Analysis
- 17.2.1.4. Recent Developments
- 17.2.1.5. Financials (Based on Availability)
- 17.2.2 Schlumberger Ltd
- 17.2.2.1. Overview
- 17.2.2.2. Products
- 17.2.2.3. SWOT Analysis
- 17.2.2.4. Recent Developments
- 17.2.2.5. Financials (Based on Availability)
- 17.2.3 Superior Energy
- 17.2.3.1. Overview
- 17.2.3.2. Products
- 17.2.3.3. SWOT Analysis
- 17.2.3.4. Recent Developments
- 17.2.3.5. Financials (Based on Availability)
- 17.2.4 RGL Reservoir Management Inc
- 17.2.4.1. Overview
- 17.2.4.2. Products
- 17.2.4.3. SWOT Analysis
- 17.2.4.4. Recent Developments
- 17.2.4.5. Financials (Based on Availability)
- 17.2.5 Baker Hughes Company
- 17.2.5.1. Overview
- 17.2.5.2. Products
- 17.2.5.3. SWOT Analysis
- 17.2.5.4. Recent Developments
- 17.2.5.5. Financials (Based on Availability)
- 17.2.6 Halliburton Company
- 17.2.6.1. Overview
- 17.2.6.2. Products
- 17.2.6.3. SWOT Analysis
- 17.2.6.4. Recent Developments
- 17.2.6.5. Financials (Based on Availability)
- 17.2.7 Welltec A/S*List Not Exhaustive
- 17.2.7.1. Overview
- 17.2.7.2. Products
- 17.2.7.3. SWOT Analysis
- 17.2.7.4. Recent Developments
- 17.2.7.5. Financials (Based on Availability)
- 17.2.8 Weatherford International Ltd
- 17.2.8.1. Overview
- 17.2.8.2. Products
- 17.2.8.3. SWOT Analysis
- 17.2.8.4. Recent Developments
- 17.2.8.5. Financials (Based on Availability)
- 17.2.1 National Oilwell Varco Inc
List of Figures
- Figure 1: Global Sand Control Systems Industry Revenue Breakdown (Million, %) by Region 2024 & 2032
- Figure 2: Global Sand Control Systems Industry Volume Breakdown (K Unit, %) by Region 2024 & 2032
- Figure 3: North America Sand Control Systems Industry Revenue (Million), by Country 2024 & 2032
- Figure 4: North America Sand Control Systems Industry Volume (K Unit), by Country 2024 & 2032
- Figure 5: North America Sand Control Systems Industry Revenue Share (%), by Country 2024 & 2032
- Figure 6: North America Sand Control Systems Industry Volume Share (%), by Country 2024 & 2032
- Figure 7: Europe Sand Control Systems Industry Revenue (Million), by Country 2024 & 2032
- Figure 8: Europe Sand Control Systems Industry Volume (K Unit), by Country 2024 & 2032
- Figure 9: Europe Sand Control Systems Industry Revenue Share (%), by Country 2024 & 2032
- Figure 10: Europe Sand Control Systems Industry Volume Share (%), by Country 2024 & 2032
- Figure 11: Asia Pacific Sand Control Systems Industry Revenue (Million), by Country 2024 & 2032
- Figure 12: Asia Pacific Sand Control Systems Industry Volume (K Unit), by Country 2024 & 2032
- Figure 13: Asia Pacific Sand Control Systems Industry Revenue Share (%), by Country 2024 & 2032
- Figure 14: Asia Pacific Sand Control Systems Industry Volume Share (%), by Country 2024 & 2032
- Figure 15: South America Sand Control Systems Industry Revenue (Million), by Country 2024 & 2032
- Figure 16: South America Sand Control Systems Industry Volume (K Unit), by Country 2024 & 2032
- Figure 17: South America Sand Control Systems Industry Revenue Share (%), by Country 2024 & 2032
- Figure 18: South America Sand Control Systems Industry Volume Share (%), by Country 2024 & 2032
- Figure 19: North America Sand Control Systems Industry Revenue (Million), by Country 2024 & 2032
- Figure 20: North America Sand Control Systems Industry Volume (K Unit), by Country 2024 & 2032
- Figure 21: North America Sand Control Systems Industry Revenue Share (%), by Country 2024 & 2032
- Figure 22: North America Sand Control Systems Industry Volume Share (%), by Country 2024 & 2032
- Figure 23: MEA Sand Control Systems Industry Revenue (Million), by Country 2024 & 2032
- Figure 24: MEA Sand Control Systems Industry Volume (K Unit), by Country 2024 & 2032
- Figure 25: MEA Sand Control Systems Industry Revenue Share (%), by Country 2024 & 2032
- Figure 26: MEA Sand Control Systems Industry Volume Share (%), by Country 2024 & 2032
- Figure 27: North America Sand Control Systems Industry Revenue (Million), by Well Type 2024 & 2032
- Figure 28: North America Sand Control Systems Industry Volume (K Unit), by Well Type 2024 & 2032
- Figure 29: North America Sand Control Systems Industry Revenue Share (%), by Well Type 2024 & 2032
- Figure 30: North America Sand Control Systems Industry Volume Share (%), by Well Type 2024 & 2032
- Figure 31: North America Sand Control Systems Industry Revenue (Million), by Location of Deployment 2024 & 2032
- Figure 32: North America Sand Control Systems Industry Volume (K Unit), by Location of Deployment 2024 & 2032
- Figure 33: North America Sand Control Systems Industry Revenue Share (%), by Location of Deployment 2024 & 2032
- Figure 34: North America Sand Control Systems Industry Volume Share (%), by Location of Deployment 2024 & 2032
- Figure 35: North America Sand Control Systems Industry Revenue (Million), by Sand Control Method 2024 & 2032
- Figure 36: North America Sand Control Systems Industry Volume (K Unit), by Sand Control Method 2024 & 2032
- Figure 37: North America Sand Control Systems Industry Revenue Share (%), by Sand Control Method 2024 & 2032
- Figure 38: North America Sand Control Systems Industry Volume Share (%), by Sand Control Method 2024 & 2032
- Figure 39: North America Sand Control Systems Industry Revenue (Million), by Country 2024 & 2032
- Figure 40: North America Sand Control Systems Industry Volume (K Unit), by Country 2024 & 2032
- Figure 41: North America Sand Control Systems Industry Revenue Share (%), by Country 2024 & 2032
- Figure 42: North America Sand Control Systems Industry Volume Share (%), by Country 2024 & 2032
- Figure 43: Europe Sand Control Systems Industry Revenue (Million), by Well Type 2024 & 2032
- Figure 44: Europe Sand Control Systems Industry Volume (K Unit), by Well Type 2024 & 2032
- Figure 45: Europe Sand Control Systems Industry Revenue Share (%), by Well Type 2024 & 2032
- Figure 46: Europe Sand Control Systems Industry Volume Share (%), by Well Type 2024 & 2032
- Figure 47: Europe Sand Control Systems Industry Revenue (Million), by Location of Deployment 2024 & 2032
- Figure 48: Europe Sand Control Systems Industry Volume (K Unit), by Location of Deployment 2024 & 2032
- Figure 49: Europe Sand Control Systems Industry Revenue Share (%), by Location of Deployment 2024 & 2032
- Figure 50: Europe Sand Control Systems Industry Volume Share (%), by Location of Deployment 2024 & 2032
- Figure 51: Europe Sand Control Systems Industry Revenue (Million), by Sand Control Method 2024 & 2032
- Figure 52: Europe Sand Control Systems Industry Volume (K Unit), by Sand Control Method 2024 & 2032
- Figure 53: Europe Sand Control Systems Industry Revenue Share (%), by Sand Control Method 2024 & 2032
- Figure 54: Europe Sand Control Systems Industry Volume Share (%), by Sand Control Method 2024 & 2032
- Figure 55: Europe Sand Control Systems Industry Revenue (Million), by Country 2024 & 2032
- Figure 56: Europe Sand Control Systems Industry Volume (K Unit), by Country 2024 & 2032
- Figure 57: Europe Sand Control Systems Industry Revenue Share (%), by Country 2024 & 2032
- Figure 58: Europe Sand Control Systems Industry Volume Share (%), by Country 2024 & 2032
- Figure 59: Asia Pacific Sand Control Systems Industry Revenue (Million), by Well Type 2024 & 2032
- Figure 60: Asia Pacific Sand Control Systems Industry Volume (K Unit), by Well Type 2024 & 2032
- Figure 61: Asia Pacific Sand Control Systems Industry Revenue Share (%), by Well Type 2024 & 2032
- Figure 62: Asia Pacific Sand Control Systems Industry Volume Share (%), by Well Type 2024 & 2032
- Figure 63: Asia Pacific Sand Control Systems Industry Revenue (Million), by Location of Deployment 2024 & 2032
- Figure 64: Asia Pacific Sand Control Systems Industry Volume (K Unit), by Location of Deployment 2024 & 2032
- Figure 65: Asia Pacific Sand Control Systems Industry Revenue Share (%), by Location of Deployment 2024 & 2032
- Figure 66: Asia Pacific Sand Control Systems Industry Volume Share (%), by Location of Deployment 2024 & 2032
- Figure 67: Asia Pacific Sand Control Systems Industry Revenue (Million), by Sand Control Method 2024 & 2032
- Figure 68: Asia Pacific Sand Control Systems Industry Volume (K Unit), by Sand Control Method 2024 & 2032
- Figure 69: Asia Pacific Sand Control Systems Industry Revenue Share (%), by Sand Control Method 2024 & 2032
- Figure 70: Asia Pacific Sand Control Systems Industry Volume Share (%), by Sand Control Method 2024 & 2032
- Figure 71: Asia Pacific Sand Control Systems Industry Revenue (Million), by Country 2024 & 2032
- Figure 72: Asia Pacific Sand Control Systems Industry Volume (K Unit), by Country 2024 & 2032
- Figure 73: Asia Pacific Sand Control Systems Industry Revenue Share (%), by Country 2024 & 2032
- Figure 74: Asia Pacific Sand Control Systems Industry Volume Share (%), by Country 2024 & 2032
- Figure 75: South America Sand Control Systems Industry Revenue (Million), by Well Type 2024 & 2032
- Figure 76: South America Sand Control Systems Industry Volume (K Unit), by Well Type 2024 & 2032
- Figure 77: South America Sand Control Systems Industry Revenue Share (%), by Well Type 2024 & 2032
- Figure 78: South America Sand Control Systems Industry Volume Share (%), by Well Type 2024 & 2032
- Figure 79: South America Sand Control Systems Industry Revenue (Million), by Location of Deployment 2024 & 2032
- Figure 80: South America Sand Control Systems Industry Volume (K Unit), by Location of Deployment 2024 & 2032
- Figure 81: South America Sand Control Systems Industry Revenue Share (%), by Location of Deployment 2024 & 2032
- Figure 82: South America Sand Control Systems Industry Volume Share (%), by Location of Deployment 2024 & 2032
- Figure 83: South America Sand Control Systems Industry Revenue (Million), by Sand Control Method 2024 & 2032
- Figure 84: South America Sand Control Systems Industry Volume (K Unit), by Sand Control Method 2024 & 2032
- Figure 85: South America Sand Control Systems Industry Revenue Share (%), by Sand Control Method 2024 & 2032
- Figure 86: South America Sand Control Systems Industry Volume Share (%), by Sand Control Method 2024 & 2032
- Figure 87: South America Sand Control Systems Industry Revenue (Million), by Country 2024 & 2032
- Figure 88: South America Sand Control Systems Industry Volume (K Unit), by Country 2024 & 2032
- Figure 89: South America Sand Control Systems Industry Revenue Share (%), by Country 2024 & 2032
- Figure 90: South America Sand Control Systems Industry Volume Share (%), by Country 2024 & 2032
- Figure 91: Middle East and Africa Sand Control Systems Industry Revenue (Million), by Well Type 2024 & 2032
- Figure 92: Middle East and Africa Sand Control Systems Industry Volume (K Unit), by Well Type 2024 & 2032
- Figure 93: Middle East and Africa Sand Control Systems Industry Revenue Share (%), by Well Type 2024 & 2032
- Figure 94: Middle East and Africa Sand Control Systems Industry Volume Share (%), by Well Type 2024 & 2032
- Figure 95: Middle East and Africa Sand Control Systems Industry Revenue (Million), by Location of Deployment 2024 & 2032
- Figure 96: Middle East and Africa Sand Control Systems Industry Volume (K Unit), by Location of Deployment 2024 & 2032
- Figure 97: Middle East and Africa Sand Control Systems Industry Revenue Share (%), by Location of Deployment 2024 & 2032
- Figure 98: Middle East and Africa Sand Control Systems Industry Volume Share (%), by Location of Deployment 2024 & 2032
- Figure 99: Middle East and Africa Sand Control Systems Industry Revenue (Million), by Sand Control Method 2024 & 2032
- Figure 100: Middle East and Africa Sand Control Systems Industry Volume (K Unit), by Sand Control Method 2024 & 2032
- Figure 101: Middle East and Africa Sand Control Systems Industry Revenue Share (%), by Sand Control Method 2024 & 2032
- Figure 102: Middle East and Africa Sand Control Systems Industry Volume Share (%), by Sand Control Method 2024 & 2032
- Figure 103: Middle East and Africa Sand Control Systems Industry Revenue (Million), by Country 2024 & 2032
- Figure 104: Middle East and Africa Sand Control Systems Industry Volume (K Unit), by Country 2024 & 2032
- Figure 105: Middle East and Africa Sand Control Systems Industry Revenue Share (%), by Country 2024 & 2032
- Figure 106: Middle East and Africa Sand Control Systems Industry Volume Share (%), by Country 2024 & 2032
List of Tables
- Table 1: Global Sand Control Systems Industry Revenue Million Forecast, by Region 2019 & 2032
- Table 2: Global Sand Control Systems Industry Volume K Unit Forecast, by Region 2019 & 2032
- Table 3: Global Sand Control Systems Industry Revenue Million Forecast, by Well Type 2019 & 2032
- Table 4: Global Sand Control Systems Industry Volume K Unit Forecast, by Well Type 2019 & 2032
- Table 5: Global Sand Control Systems Industry Revenue Million Forecast, by Location of Deployment 2019 & 2032
- Table 6: Global Sand Control Systems Industry Volume K Unit Forecast, by Location of Deployment 2019 & 2032
- Table 7: Global Sand Control Systems Industry Revenue Million Forecast, by Sand Control Method 2019 & 2032
- Table 8: Global Sand Control Systems Industry Volume K Unit Forecast, by Sand Control Method 2019 & 2032
- Table 9: Global Sand Control Systems Industry Revenue Million Forecast, by Region 2019 & 2032
- Table 10: Global Sand Control Systems Industry Volume K Unit Forecast, by Region 2019 & 2032
- Table 11: Global Sand Control Systems Industry Revenue Million Forecast, by Country 2019 & 2032
- Table 12: Global Sand Control Systems Industry Volume K Unit Forecast, by Country 2019 & 2032
- Table 13: United States Sand Control Systems Industry Revenue (Million) Forecast, by Application 2019 & 2032
- Table 14: United States Sand Control Systems Industry Volume (K Unit) Forecast, by Application 2019 & 2032
- Table 15: Canada Sand Control Systems Industry Revenue (Million) Forecast, by Application 2019 & 2032
- Table 16: Canada Sand Control Systems Industry Volume (K Unit) Forecast, by Application 2019 & 2032
- Table 17: Mexico Sand Control Systems Industry Revenue (Million) Forecast, by Application 2019 & 2032
- Table 18: Mexico Sand Control Systems Industry Volume (K Unit) Forecast, by Application 2019 & 2032
- Table 19: Global Sand Control Systems Industry Revenue Million Forecast, by Country 2019 & 2032
- Table 20: Global Sand Control Systems Industry Volume K Unit Forecast, by Country 2019 & 2032
- Table 21: Germany Sand Control Systems Industry Revenue (Million) Forecast, by Application 2019 & 2032
- Table 22: Germany Sand Control Systems Industry Volume (K Unit) Forecast, by Application 2019 & 2032
- Table 23: United Kingdom Sand Control Systems Industry Revenue (Million) Forecast, by Application 2019 & 2032
- Table 24: United Kingdom Sand Control Systems Industry Volume (K Unit) Forecast, by Application 2019 & 2032
- Table 25: France Sand Control Systems Industry Revenue (Million) Forecast, by Application 2019 & 2032
- Table 26: France Sand Control Systems Industry Volume (K Unit) Forecast, by Application 2019 & 2032
- Table 27: Spain Sand Control Systems Industry Revenue (Million) Forecast, by Application 2019 & 2032
- Table 28: Spain Sand Control Systems Industry Volume (K Unit) Forecast, by Application 2019 & 2032
- Table 29: Italy Sand Control Systems Industry Revenue (Million) Forecast, by Application 2019 & 2032
- Table 30: Italy Sand Control Systems Industry Volume (K Unit) Forecast, by Application 2019 & 2032
- Table 31: Spain Sand Control Systems Industry Revenue (Million) Forecast, by Application 2019 & 2032
- Table 32: Spain Sand Control Systems Industry Volume (K Unit) Forecast, by Application 2019 & 2032
- Table 33: Belgium Sand Control Systems Industry Revenue (Million) Forecast, by Application 2019 & 2032
- Table 34: Belgium Sand Control Systems Industry Volume (K Unit) Forecast, by Application 2019 & 2032
- Table 35: Netherland Sand Control Systems Industry Revenue (Million) Forecast, by Application 2019 & 2032
- Table 36: Netherland Sand Control Systems Industry Volume (K Unit) Forecast, by Application 2019 & 2032
- Table 37: Nordics Sand Control Systems Industry Revenue (Million) Forecast, by Application 2019 & 2032
- Table 38: Nordics Sand Control Systems Industry Volume (K Unit) Forecast, by Application 2019 & 2032
- Table 39: Rest of Europe Sand Control Systems Industry Revenue (Million) Forecast, by Application 2019 & 2032
- Table 40: Rest of Europe Sand Control Systems Industry Volume (K Unit) Forecast, by Application 2019 & 2032
- Table 41: Global Sand Control Systems Industry Revenue Million Forecast, by Country 2019 & 2032
- Table 42: Global Sand Control Systems Industry Volume K Unit Forecast, by Country 2019 & 2032
- Table 43: China Sand Control Systems Industry Revenue (Million) Forecast, by Application 2019 & 2032
- Table 44: China Sand Control Systems Industry Volume (K Unit) Forecast, by Application 2019 & 2032
- Table 45: Japan Sand Control Systems Industry Revenue (Million) Forecast, by Application 2019 & 2032
- Table 46: Japan Sand Control Systems Industry Volume (K Unit) Forecast, by Application 2019 & 2032
- Table 47: India Sand Control Systems Industry Revenue (Million) Forecast, by Application 2019 & 2032
- Table 48: India Sand Control Systems Industry Volume (K Unit) Forecast, by Application 2019 & 2032
- Table 49: South Korea Sand Control Systems Industry Revenue (Million) Forecast, by Application 2019 & 2032
- Table 50: South Korea Sand Control Systems Industry Volume (K Unit) Forecast, by Application 2019 & 2032
- Table 51: Southeast Asia Sand Control Systems Industry Revenue (Million) Forecast, by Application 2019 & 2032
- Table 52: Southeast Asia Sand Control Systems Industry Volume (K Unit) Forecast, by Application 2019 & 2032
- Table 53: Australia Sand Control Systems Industry Revenue (Million) Forecast, by Application 2019 & 2032
- Table 54: Australia Sand Control Systems Industry Volume (K Unit) Forecast, by Application 2019 & 2032
- Table 55: Indonesia Sand Control Systems Industry Revenue (Million) Forecast, by Application 2019 & 2032
- Table 56: Indonesia Sand Control Systems Industry Volume (K Unit) Forecast, by Application 2019 & 2032
- Table 57: Phillipes Sand Control Systems Industry Revenue (Million) Forecast, by Application 2019 & 2032
- Table 58: Phillipes Sand Control Systems Industry Volume (K Unit) Forecast, by Application 2019 & 2032
- Table 59: Singapore Sand Control Systems Industry Revenue (Million) Forecast, by Application 2019 & 2032
- Table 60: Singapore Sand Control Systems Industry Volume (K Unit) Forecast, by Application 2019 & 2032
- Table 61: Thailandc Sand Control Systems Industry Revenue (Million) Forecast, by Application 2019 & 2032
- Table 62: Thailandc Sand Control Systems Industry Volume (K Unit) Forecast, by Application 2019 & 2032
- Table 63: Rest of Asia Pacific Sand Control Systems Industry Revenue (Million) Forecast, by Application 2019 & 2032
- Table 64: Rest of Asia Pacific Sand Control Systems Industry Volume (K Unit) Forecast, by Application 2019 & 2032
- Table 65: Global Sand Control Systems Industry Revenue Million Forecast, by Country 2019 & 2032
- Table 66: Global Sand Control Systems Industry Volume K Unit Forecast, by Country 2019 & 2032
- Table 67: Brazil Sand Control Systems Industry Revenue (Million) Forecast, by Application 2019 & 2032
- Table 68: Brazil Sand Control Systems Industry Volume (K Unit) Forecast, by Application 2019 & 2032
- Table 69: Argentina Sand Control Systems Industry Revenue (Million) Forecast, by Application 2019 & 2032
- Table 70: Argentina Sand Control Systems Industry Volume (K Unit) Forecast, by Application 2019 & 2032
- Table 71: Peru Sand Control Systems Industry Revenue (Million) Forecast, by Application 2019 & 2032
- Table 72: Peru Sand Control Systems Industry Volume (K Unit) Forecast, by Application 2019 & 2032
- Table 73: Chile Sand Control Systems Industry Revenue (Million) Forecast, by Application 2019 & 2032
- Table 74: Chile Sand Control Systems Industry Volume (K Unit) Forecast, by Application 2019 & 2032
- Table 75: Colombia Sand Control Systems Industry Revenue (Million) Forecast, by Application 2019 & 2032
- Table 76: Colombia Sand Control Systems Industry Volume (K Unit) Forecast, by Application 2019 & 2032
- Table 77: Ecuador Sand Control Systems Industry Revenue (Million) Forecast, by Application 2019 & 2032
- Table 78: Ecuador Sand Control Systems Industry Volume (K Unit) Forecast, by Application 2019 & 2032
- Table 79: Venezuela Sand Control Systems Industry Revenue (Million) Forecast, by Application 2019 & 2032
- Table 80: Venezuela Sand Control Systems Industry Volume (K Unit) Forecast, by Application 2019 & 2032
- Table 81: Rest of South America Sand Control Systems Industry Revenue (Million) Forecast, by Application 2019 & 2032
- Table 82: Rest of South America Sand Control Systems Industry Volume (K Unit) Forecast, by Application 2019 & 2032
- Table 83: Global Sand Control Systems Industry Revenue Million Forecast, by Country 2019 & 2032
- Table 84: Global Sand Control Systems Industry Volume K Unit Forecast, by Country 2019 & 2032
- Table 85: United States Sand Control Systems Industry Revenue (Million) Forecast, by Application 2019 & 2032
- Table 86: United States Sand Control Systems Industry Volume (K Unit) Forecast, by Application 2019 & 2032
- Table 87: Canada Sand Control Systems Industry Revenue (Million) Forecast, by Application 2019 & 2032
- Table 88: Canada Sand Control Systems Industry Volume (K Unit) Forecast, by Application 2019 & 2032
- Table 89: Mexico Sand Control Systems Industry Revenue (Million) Forecast, by Application 2019 & 2032
- Table 90: Mexico Sand Control Systems Industry Volume (K Unit) Forecast, by Application 2019 & 2032
- Table 91: Global Sand Control Systems Industry Revenue Million Forecast, by Country 2019 & 2032
- Table 92: Global Sand Control Systems Industry Volume K Unit Forecast, by Country 2019 & 2032
- Table 93: United Arab Emirates Sand Control Systems Industry Revenue (Million) Forecast, by Application 2019 & 2032
- Table 94: United Arab Emirates Sand Control Systems Industry Volume (K Unit) Forecast, by Application 2019 & 2032
- Table 95: Saudi Arabia Sand Control Systems Industry Revenue (Million) Forecast, by Application 2019 & 2032
- Table 96: Saudi Arabia Sand Control Systems Industry Volume (K Unit) Forecast, by Application 2019 & 2032
- Table 97: South Africa Sand Control Systems Industry Revenue (Million) Forecast, by Application 2019 & 2032
- Table 98: South Africa Sand Control Systems Industry Volume (K Unit) Forecast, by Application 2019 & 2032
- Table 99: Rest of Middle East and Africa Sand Control Systems Industry Revenue (Million) Forecast, by Application 2019 & 2032
- Table 100: Rest of Middle East and Africa Sand Control Systems Industry Volume (K Unit) Forecast, by Application 2019 & 2032
- Table 101: Global Sand Control Systems Industry Revenue Million Forecast, by Well Type 2019 & 2032
- Table 102: Global Sand Control Systems Industry Volume K Unit Forecast, by Well Type 2019 & 2032
- Table 103: Global Sand Control Systems Industry Revenue Million Forecast, by Location of Deployment 2019 & 2032
- Table 104: Global Sand Control Systems Industry Volume K Unit Forecast, by Location of Deployment 2019 & 2032
- Table 105: Global Sand Control Systems Industry Revenue Million Forecast, by Sand Control Method 2019 & 2032
- Table 106: Global Sand Control Systems Industry Volume K Unit Forecast, by Sand Control Method 2019 & 2032
- Table 107: Global Sand Control Systems Industry Revenue Million Forecast, by Country 2019 & 2032
- Table 108: Global Sand Control Systems Industry Volume K Unit Forecast, by Country 2019 & 2032
- Table 109: Global Sand Control Systems Industry Revenue Million Forecast, by Well Type 2019 & 2032
- Table 110: Global Sand Control Systems Industry Volume K Unit Forecast, by Well Type 2019 & 2032
- Table 111: Global Sand Control Systems Industry Revenue Million Forecast, by Location of Deployment 2019 & 2032
- Table 112: Global Sand Control Systems Industry Volume K Unit Forecast, by Location of Deployment 2019 & 2032
- Table 113: Global Sand Control Systems Industry Revenue Million Forecast, by Sand Control Method 2019 & 2032
- Table 114: Global Sand Control Systems Industry Volume K Unit Forecast, by Sand Control Method 2019 & 2032
- Table 115: Global Sand Control Systems Industry Revenue Million Forecast, by Country 2019 & 2032
- Table 116: Global Sand Control Systems Industry Volume K Unit Forecast, by Country 2019 & 2032
- Table 117: Global Sand Control Systems Industry Revenue Million Forecast, by Well Type 2019 & 2032
- Table 118: Global Sand Control Systems Industry Volume K Unit Forecast, by Well Type 2019 & 2032
- Table 119: Global Sand Control Systems Industry Revenue Million Forecast, by Location of Deployment 2019 & 2032
- Table 120: Global Sand Control Systems Industry Volume K Unit Forecast, by Location of Deployment 2019 & 2032
- Table 121: Global Sand Control Systems Industry Revenue Million Forecast, by Sand Control Method 2019 & 2032
- Table 122: Global Sand Control Systems Industry Volume K Unit Forecast, by Sand Control Method 2019 & 2032
- Table 123: Global Sand Control Systems Industry Revenue Million Forecast, by Country 2019 & 2032
- Table 124: Global Sand Control Systems Industry Volume K Unit Forecast, by Country 2019 & 2032
- Table 125: Global Sand Control Systems Industry Revenue Million Forecast, by Well Type 2019 & 2032
- Table 126: Global Sand Control Systems Industry Volume K Unit Forecast, by Well Type 2019 & 2032
- Table 127: Global Sand Control Systems Industry Revenue Million Forecast, by Location of Deployment 2019 & 2032
- Table 128: Global Sand Control Systems Industry Volume K Unit Forecast, by Location of Deployment 2019 & 2032
- Table 129: Global Sand Control Systems Industry Revenue Million Forecast, by Sand Control Method 2019 & 2032
- Table 130: Global Sand Control Systems Industry Volume K Unit Forecast, by Sand Control Method 2019 & 2032
- Table 131: Global Sand Control Systems Industry Revenue Million Forecast, by Country 2019 & 2032
- Table 132: Global Sand Control Systems Industry Volume K Unit Forecast, by Country 2019 & 2032
- Table 133: Global Sand Control Systems Industry Revenue Million Forecast, by Well Type 2019 & 2032
- Table 134: Global Sand Control Systems Industry Volume K Unit Forecast, by Well Type 2019 & 2032
- Table 135: Global Sand Control Systems Industry Revenue Million Forecast, by Location of Deployment 2019 & 2032
- Table 136: Global Sand Control Systems Industry Volume K Unit Forecast, by Location of Deployment 2019 & 2032
- Table 137: Global Sand Control Systems Industry Revenue Million Forecast, by Sand Control Method 2019 & 2032
- Table 138: Global Sand Control Systems Industry Volume K Unit Forecast, by Sand Control Method 2019 & 2032
- Table 139: Global Sand Control Systems Industry Revenue Million Forecast, by Country 2019 & 2032
- Table 140: Global Sand Control Systems Industry Volume K Unit Forecast, by Country 2019 & 2032
Frequently Asked Questions
1. What is the projected Compound Annual Growth Rate (CAGR) of the Sand Control Systems Industry?
The projected CAGR is approximately > 4.00%.
2. Which companies are prominent players in the Sand Control Systems Industry?
Key companies in the market include National Oilwell Varco Inc, Schlumberger Ltd, Superior Energy, RGL Reservoir Management Inc, Baker Hughes Company, Halliburton Company, Welltec A/S*List Not Exhaustive, Weatherford International Ltd.
3. What are the main segments of the Sand Control Systems Industry?
The market segments include Well Type, Location of Deployment, Sand Control Method.
4. Can you provide details about the market size?
The market size is estimated to be USD XX Million as of 2022.
5. What are some drivers contributing to market growth?
4.; The Rise in Oil and Gas Drilling Activities4.; Increased Shale Gas Exploration.
6. What are the notable trends driving market growth?
Offshore Segment to Dominate the Market.
7. Are there any restraints impacting market growth?
4.; Increasing Share of Renewable Energy.
8. Can you provide examples of recent developments in the market?
N/A
9. What pricing options are available for accessing the report?
Pricing options include single-user, multi-user, and enterprise licenses priced at USD 4750, USD 5250, and USD 8750 respectively.
10. Is the market size provided in terms of value or volume?
The market size is provided in terms of value, measured in Million and volume, measured in K Unit.
11. Are there any specific market keywords associated with the report?
Yes, the market keyword associated with the report is "Sand Control Systems Industry," which aids in identifying and referencing the specific market segment covered.
12. How do I determine which pricing option suits my needs best?
The pricing options vary based on user requirements and access needs. Individual users may opt for single-user licenses, while businesses requiring broader access may choose multi-user or enterprise licenses for cost-effective access to the report.
13. Are there any additional resources or data provided in the Sand Control Systems Industry report?
While the report offers comprehensive insights, it's advisable to review the specific contents or supplementary materials provided to ascertain if additional resources or data are available.
14. How can I stay updated on further developments or reports in the Sand Control Systems Industry?
To stay informed about further developments, trends, and reports in the Sand Control Systems Industry, consider subscribing to industry newsletters, following relevant companies and organizations, or regularly checking reputable industry news sources and publications.
Methodology
Step 1 - Identification of Relevant Samples Size from Population Database


Step 2 - Approaches for Defining Global Market Size (Value, Volume* & Price*)

Note*: In applicable scenarios
Step 3 - Data Sources
Primary Research
- Web Analytics
- Survey Reports
- Research Institute
- Latest Research Reports
- Opinion Leaders
Secondary Research
- Annual Reports
- White Paper
- Latest Press Release
- Industry Association
- Paid Database
- Investor Presentations

Step 4 - Data Triangulation
Involves using different sources of information in order to increase the validity of a study
These sources are likely to be stakeholders in a program - participants, other researchers, program staff, other community members, and so on.
Then we put all data in single framework & apply various statistical tools to find out the dynamic on the market.
During the analysis stage, feedback from the stakeholder groups would be compared to determine areas of agreement as well as areas of divergence


