
Key Insights
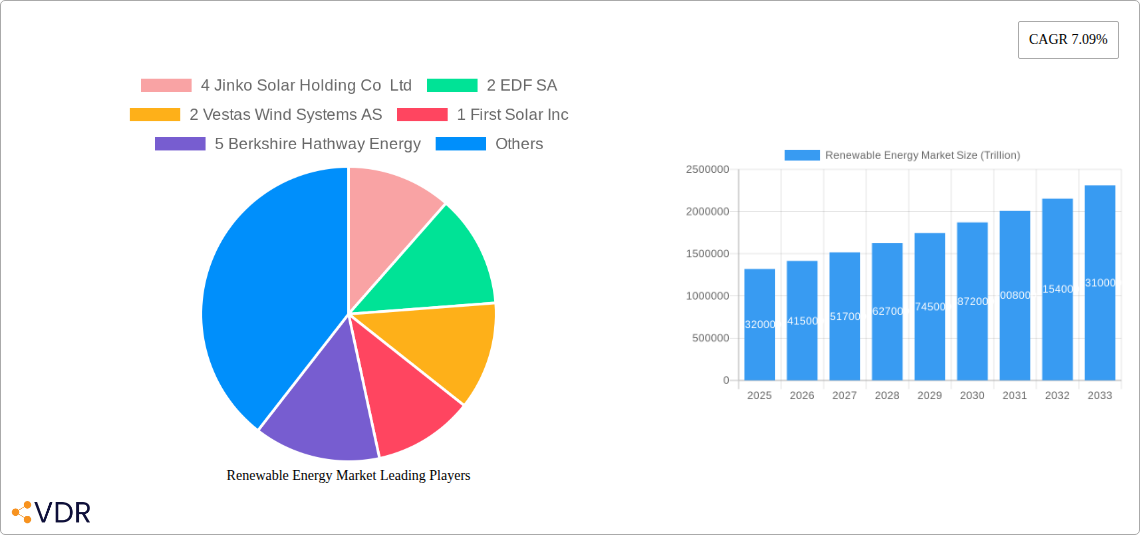
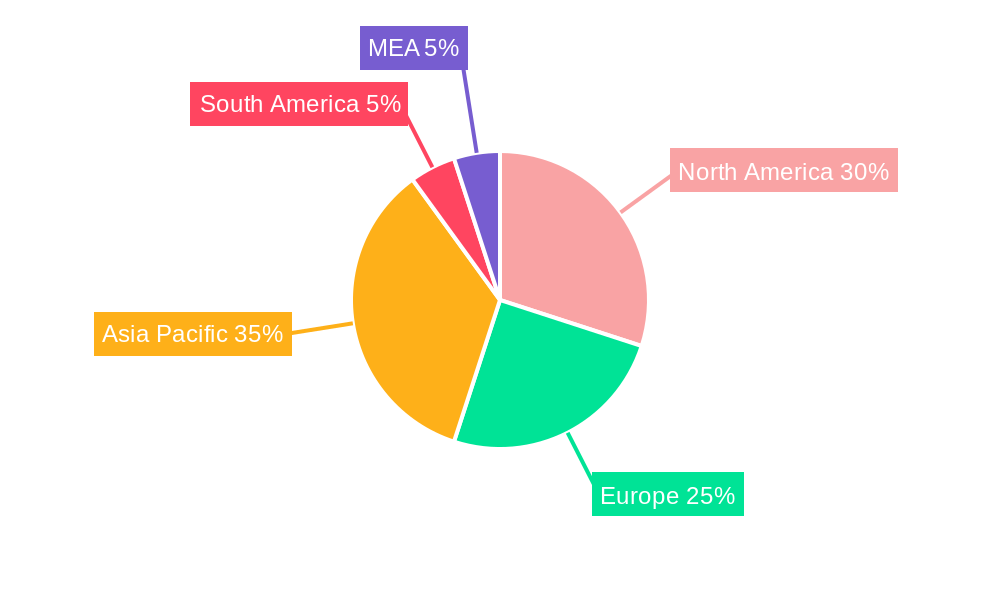
The renewable energy market is experiencing robust growth, projected to reach a market size of $1.32 trillion in 2025 and exhibiting a Compound Annual Growth Rate (CAGR) of 7.09% from 2025 to 2033. This expansion is driven by several factors, including increasing concerns about climate change and the urgent need to transition away from fossil fuels. Government policies promoting renewable energy adoption through subsidies, tax incentives, and renewable portfolio standards are also significantly contributing to market growth. Technological advancements leading to increased efficiency and reduced costs of renewable energy technologies, such as solar photovoltaic (PV) and wind turbines, further fuel this expansion. The diverse range of renewable energy sources, encompassing solar, wind, hydro, bioenergy, and geothermal, offers flexibility and adaptability to various geographical locations and energy demands. While the market faces challenges, such as intermittency issues associated with solar and wind power and the need for significant infrastructure investments, ongoing innovation in energy storage solutions and grid management systems are actively mitigating these restraints. The market's segmentation across various energy sources highlights the opportunities for specialized players focusing on specific technologies, like JinkoSolar (solar PV) and Vestas (wind turbines). Geographical distribution shows a strong concentration in North America, Europe, and Asia-Pacific, reflecting established markets and significant investment in renewable infrastructure in these regions. However, emerging markets in other regions, such as South America and the Middle East and Africa, are presenting increasingly attractive opportunities as they invest in sustainable energy infrastructure.
The competitive landscape is characterized by a mix of established players, such as EDF SA, NextEra Energy Inc., and Berkshire Hathaway Energy, and emerging companies specializing in specific technologies. This competition fosters innovation and drives down costs. The significant presence of EPC developers/operators/owners indicates a substantial demand for comprehensive project development and management services within the industry. Equipment suppliers play a critical role in enabling technological advancements, while the market ranking reveals the significant market shares held by leading companies in solar and wind power segments. The forecast period (2025-2033) suggests continued expansion, with market growth potentially accelerating as technological breakthroughs and policy support further enhance the viability and attractiveness of renewable energy options worldwide. This market presents significant investment opportunities and will likely continue to attract considerable funding given the global drive toward carbon neutrality and energy security.
Renewable Energy Market: A Comprehensive Report (2019-2033)
This in-depth report provides a comprehensive analysis of the global renewable energy market, encompassing market dynamics, growth trends, regional dominance, key players, and future outlook. Valued at xx trillion USD in 2025, the market is poised for significant expansion, projected to reach xx trillion USD by 2033. This report serves as an invaluable resource for industry professionals, investors, and policymakers seeking actionable insights into this rapidly evolving sector. The study period covers 2019-2033, with 2025 as the base year.
Renewable Energy Market Market Dynamics & Structure
The renewable energy market is characterized by a dynamic interplay of factors influencing its structure and growth trajectory. Market concentration is moderate, with a few large players holding significant shares, alongside numerous smaller, specialized companies. Technological innovation, particularly in solar PV and wind turbine technologies, is a primary driver, constantly enhancing efficiency and reducing costs. Stringent regulatory frameworks, including government incentives and carbon emission reduction targets, are crucial in shaping market growth and encouraging investment. However, challenges remain, including intermittency issues, grid integration complexities, and the availability of suitable locations for large-scale renewable energy projects. The market is also witnessing a rise in mergers and acquisitions (M&A) activity, as larger companies seek to consolidate their market positions and expand their portfolios. The total M&A deal volume in the sector between 2019 and 2024 was estimated at xx trillion USD.
- Market Concentration: Moderate, with top players holding approximately xx% market share.
- Technological Innovation: Continuous advancements in solar PV, wind, and other renewable energy technologies are driving down costs and improving efficiency.
- Regulatory Framework: Government policies, subsidies, and carbon pricing mechanisms significantly impact market growth.
- Competitive Substitutes: Fossil fuels remain a significant competitor, though renewable energy's cost competitiveness is steadily increasing.
- End-User Demographics: Demand is driven by a diverse range of end-users, including utilities, industrial facilities, and residential consumers.
- M&A Trends: Increased M&A activity reflects consolidation and expansion within the renewable energy sector.
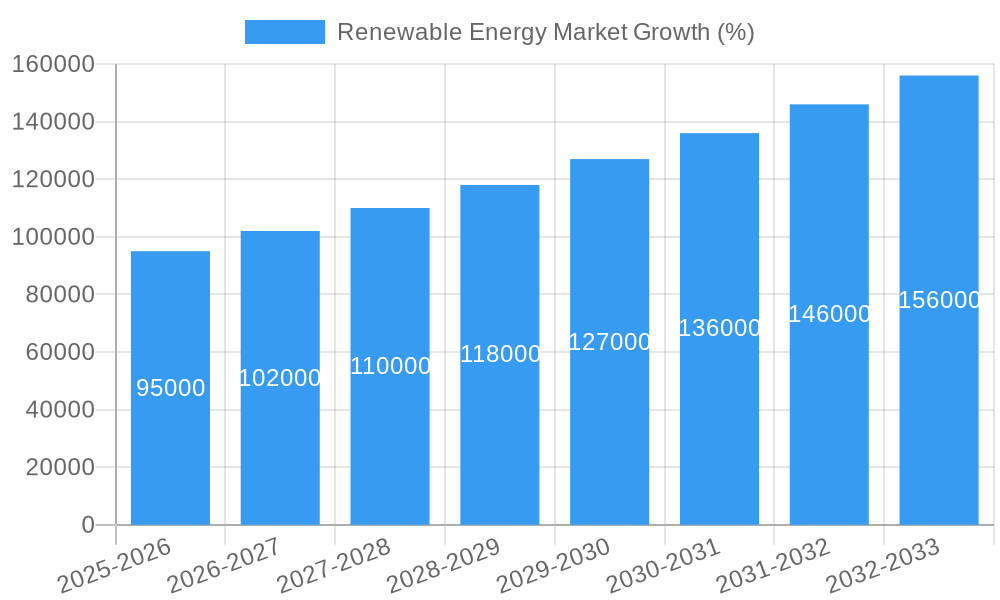
Renewable Energy Market Growth Trends & Insights
The renewable energy market exhibits robust growth, driven by increasing concerns about climate change, declining costs of renewable technologies, and supportive government policies. The market size has grown significantly from xx trillion USD in 2019 to xx trillion USD in 2024, exhibiting a compound annual growth rate (CAGR) of xx%. This growth is expected to continue, with a projected CAGR of xx% during the forecast period (2025-2033). Technological disruptions, such as the advancement of energy storage technologies and the rise of smart grids, are further accelerating adoption rates. Shifting consumer behavior, including a growing preference for sustainable energy sources and increased awareness of environmental issues, is also fueling market growth. Market penetration is increasing steadily across various sectors, with renewable energy increasingly becoming a mainstream energy source.
Dominant Regions, Countries, or Segments in Renewable Energy Market
The renewable energy market is geographically diverse, with certain regions and countries showcasing stronger growth. China, the United States, and the European Union are currently leading the market, driven by significant investments in renewable energy infrastructure, supportive policies, and high demand. Within the segment breakdown by energy type, the solar market dominates, owing to its cost-effectiveness and versatility, followed by wind power. Hydropower continues to play a significant role, particularly in regions with abundant water resources. The bioenergy and other renewable energy sources, including geothermal and tidal, are also growing, though their market shares remain comparatively smaller.
- Key Drivers:
- Favorable government policies and incentives
- Increasing energy demand and concerns about energy security
- Technological advancements and cost reductions
- Growing environmental awareness and sustainability goals.
- Dominance Factors:
- Abundant resources (solar irradiation, wind speeds, water resources)
- Supportive regulatory frameworks and investment incentives
- Well-developed grid infrastructure
- Strong industrial base and manufacturing capabilities.
Renewable Energy Market Product Landscape
The renewable energy market features a wide array of products, including solar panels, wind turbines, hydropower generators, and biomass boilers. Continuous innovations are enhancing efficiency, reducing costs, and improving the reliability of renewable energy systems. For instance, advancements in solar PV technology, including perovskite solar cells, offer potential for even higher efficiencies. In wind energy, taller and more efficient turbines are being deployed. These advancements are leading to improved performance metrics, such as higher energy yields and longer lifespans, and driving the adoption of renewable energy in various applications, from large-scale power generation to off-grid solutions.
Key Drivers, Barriers & Challenges in Renewable Energy Market
Key Drivers: The renewable energy market is propelled by a confluence of factors, including:
- Declining technology costs, especially in solar and wind.
- Stringent environmental regulations and carbon emission reduction targets.
- Government incentives and subsidies promoting renewable energy adoption.
- Growing consumer awareness and demand for sustainable energy.
Key Challenges: The sector faces several significant hurdles:
- Intermittency of renewable energy sources necessitates development of robust energy storage solutions.
- Grid integration challenges pose difficulties in effectively managing the variable output of renewable energy sources.
- Land use constraints can limit the deployment of large-scale renewable energy projects.
- Supply chain disruptions and resource scarcity can impact project timelines and costs. (Estimated impact: xx% increase in project costs in 2024)
Emerging Opportunities in Renewable Energy Market
Emerging opportunities abound within the renewable energy sector:
- The rise of hybrid energy systems combining renewable energy sources with energy storage.
- Growing demand for off-grid and decentralized renewable energy solutions in remote areas.
- Innovative applications of renewable energy in sectors like transportation and industrial processes.
- Expansion into untapped markets in developing countries with high renewable energy potential.
Growth Accelerators in the Renewable Energy Market Industry
Technological advancements are crucial growth catalysts. Continued improvements in solar panel efficiency, wind turbine designs, and energy storage technologies are reducing costs and enhancing performance. Strategic partnerships between energy companies, technology providers, and financial institutions are fostering innovation and accelerating market penetration. Market expansion strategies targeting new geographical areas and expanding into new applications are crucial for sustained growth.
Key Players Shaping the Renewable Energy Market Market
- Jinko Solar Holding Co Ltd
- EDF SA
- Vestas Wind Systems AS
- First Solar Inc
- Berkshire Hathaway Energy
- Equipment Suppliers
- Orsted AS
- EPC Developers/Operators/Owners
- Canadian Solar Inc
- Duke Energy Corporation
- Acciona Energia SA
- NextEra Energy Inc
- General Electric Company
- Siemens Gamesa Renewable Energy SA
- *List Not Exhaustive
Notable Milestones in Renewable Energy Market Sector
- April 2023: ArcelorMittal Brazil and Casa dos Ventos form a joint venture to develop the 554 MW Babilonia wind power project in Bahia, Brazil (USD 800 million investment).
- January 2023: Cepsa announces plans to build three 400 MW solar power projects in Castilla-La Mancha, Spain (USD 305 million investment).
- May 2022: NJR Clean Energy Ventures starts construction on an 8.9-MW floating solar installation in New Jersey, the largest in the US.
In-Depth Renewable Energy Market Market Outlook
The renewable energy market's future is exceptionally bright. Continued technological advancements, supportive government policies, and increasing consumer demand will drive significant growth. Strategic partnerships and innovative business models will further accelerate market expansion. Untapped markets in developing countries present vast opportunities. The sector is poised for sustained growth, offering significant potential for investors and businesses alike.
Renewable Energy Market Segmentation
-
1. Type
- 1.1. Solar
- 1.2. Wind
- 1.3. Hydro
- 1.4. Bioenergy
- 1.5. Other Types (Geothermal, Tidal, etc.)
Renewable Energy Market Segmentation By Geography
-
1. North America
- 1.1. United States of America
- 1.2. Canada
- 1.3. Rest of the North America
-
2. Europe
- 2.1. United Kingdom
- 2.2. Germany
- 2.3. France
- 2.4. Spain
- 2.5. NORDIC
- 2.6. Turkey
- 2.7. Russia
- 2.8. Rest of the Europe
-
3. Asia Pacific
- 3.1. China
- 3.2. India
- 3.3. Japan
- 3.4. Malaysia
- 3.5. Thailand
- 3.6. Indonesia
- 3.7. Vietnam
- 3.8. Rest of Asia Pacific
-
4. Middle East and Africa
- 4.1. United Arab Emirates
- 4.2. Saudi Arabia
- 4.3. Egypt
- 4.4. Nigeria
- 4.5. South Africa
- 4.6. Qatar
- 4.7. Rest of the Middle East and Africa
-
5. South America
- 5.1. Brazil
- 5.2. Argentina
- 5.3. Colombia
- 5.4. Rest of the South America
Renewable Energy Market REPORT HIGHLIGHTS
| Aspects | Details |
|---|---|
| Study Period | 2019-2033 |
| Base Year | 2024 |
| Estimated Year | 2025 |
| Forecast Period | 2025-2033 |
| Historical Period | 2019-2024 |
| Growth Rate | CAGR of 7.09% from 2019-2033 |
| Segmentation |
|
Table of Contents
- 1. Introduction
- 1.1. Research Scope
- 1.2. Market Segmentation
- 1.3. Research Methodology
- 1.4. Definitions and Assumptions
- 2. Executive Summary
- 2.1. Introduction
- 3. Market Dynamics
- 3.1. Introduction
- 3.2. Market Drivers
- 3.2.1. 4.; Favorable Government Policies for Renewable Energy4.; The Declining Price of Solar Panels and Wind Turbine Installations4.; Increasing Investments in Hydropower and Pumped Storage Hydropower Projects4.; Growing Emphasis on Geothermal Energy
- 3.3. Market Restrains
- 3.3.1. 4.; Increasing Penetration of Natural Gas for Power Generation
- 3.4. Market Trends
- 3.4.1. Hydropower Segment is Expected to Dominate the Market during the Forecast Period
- 4. Market Factor Analysis
- 4.1. Porters Five Forces
- 4.2. Supply/Value Chain
- 4.3. PESTEL analysis
- 4.4. Market Entropy
- 4.5. Patent/Trademark Analysis
- 5. Global Renewable Energy Market Analysis, Insights and Forecast, 2019-2031
- 5.1. Market Analysis, Insights and Forecast - by Type
- 5.1.1. Solar
- 5.1.2. Wind
- 5.1.3. Hydro
- 5.1.4. Bioenergy
- 5.1.5. Other Types (Geothermal, Tidal, etc.)
- 5.2. Market Analysis, Insights and Forecast - by Region
- 5.2.1. North America
- 5.2.2. Europe
- 5.2.3. Asia Pacific
- 5.2.4. Middle East and Africa
- 5.2.5. South America
- 5.1. Market Analysis, Insights and Forecast - by Type
- 6. North America Renewable Energy Market Analysis, Insights and Forecast, 2019-2031
- 6.1. Market Analysis, Insights and Forecast - by Type
- 6.1.1. Solar
- 6.1.2. Wind
- 6.1.3. Hydro
- 6.1.4. Bioenergy
- 6.1.5. Other Types (Geothermal, Tidal, etc.)
- 6.1. Market Analysis, Insights and Forecast - by Type
- 7. Europe Renewable Energy Market Analysis, Insights and Forecast, 2019-2031
- 7.1. Market Analysis, Insights and Forecast - by Type
- 7.1.1. Solar
- 7.1.2. Wind
- 7.1.3. Hydro
- 7.1.4. Bioenergy
- 7.1.5. Other Types (Geothermal, Tidal, etc.)
- 7.1. Market Analysis, Insights and Forecast - by Type
- 8. Asia Pacific Renewable Energy Market Analysis, Insights and Forecast, 2019-2031
- 8.1. Market Analysis, Insights and Forecast - by Type
- 8.1.1. Solar
- 8.1.2. Wind
- 8.1.3. Hydro
- 8.1.4. Bioenergy
- 8.1.5. Other Types (Geothermal, Tidal, etc.)
- 8.1. Market Analysis, Insights and Forecast - by Type
- 9. Middle East and Africa Renewable Energy Market Analysis, Insights and Forecast, 2019-2031
- 9.1. Market Analysis, Insights and Forecast - by Type
- 9.1.1. Solar
- 9.1.2. Wind
- 9.1.3. Hydro
- 9.1.4. Bioenergy
- 9.1.5. Other Types (Geothermal, Tidal, etc.)
- 9.1. Market Analysis, Insights and Forecast - by Type
- 10. South America Renewable Energy Market Analysis, Insights and Forecast, 2019-2031
- 10.1. Market Analysis, Insights and Forecast - by Type
- 10.1.1. Solar
- 10.1.2. Wind
- 10.1.3. Hydro
- 10.1.4. Bioenergy
- 10.1.5. Other Types (Geothermal, Tidal, etc.)
- 10.1. Market Analysis, Insights and Forecast - by Type
- 11. North America Renewable Energy Market Analysis, Insights and Forecast, 2019-2031
- 11.1. Market Analysis, Insights and Forecast - By Country/Sub-region
- 11.1.1 United States
- 11.1.2 Canada
- 11.1.3 Mexico
- 12. Europe Renewable Energy Market Analysis, Insights and Forecast, 2019-2031
- 12.1. Market Analysis, Insights and Forecast - By Country/Sub-region
- 12.1.1 Germany
- 12.1.2 United Kingdom
- 12.1.3 France
- 12.1.4 Spain
- 12.1.5 Italy
- 12.1.6 Spain
- 12.1.7 Belgium
- 12.1.8 Netherland
- 12.1.9 Nordics
- 12.1.10 Rest of Europe
- 13. Asia Pacific Renewable Energy Market Analysis, Insights and Forecast, 2019-2031
- 13.1. Market Analysis, Insights and Forecast - By Country/Sub-region
- 13.1.1 China
- 13.1.2 Japan
- 13.1.3 India
- 13.1.4 South Korea
- 13.1.5 Southeast Asia
- 13.1.6 Australia
- 13.1.7 Indonesia
- 13.1.8 Phillipes
- 13.1.9 Singapore
- 13.1.10 Thailandc
- 13.1.11 Rest of Asia Pacific
- 14. South America Renewable Energy Market Analysis, Insights and Forecast, 2019-2031
- 14.1. Market Analysis, Insights and Forecast - By Country/Sub-region
- 14.1.1 Brazil
- 14.1.2 Argentina
- 14.1.3 Peru
- 14.1.4 Chile
- 14.1.5 Colombia
- 14.1.6 Ecuador
- 14.1.7 Venezuela
- 14.1.8 Rest of South America
- 15. North America Renewable Energy Market Analysis, Insights and Forecast, 2019-2031
- 15.1. Market Analysis, Insights and Forecast - By Country/Sub-region
- 15.1.1 United States
- 15.1.2 Canada
- 15.1.3 Mexico
- 16. MEA Renewable Energy Market Analysis, Insights and Forecast, 2019-2031
- 16.1. Market Analysis, Insights and Forecast - By Country/Sub-region
- 16.1.1 United Arab Emirates
- 16.1.2 Saudi Arabia
- 16.1.3 South Africa
- 16.1.4 Rest of Middle East and Africa
- 17. Competitive Analysis
- 17.1. Global Market Share Analysis 2024
- 17.2. Company Profiles
- 17.2.1 4 Jinko Solar Holding Co Ltd
- 17.2.1.1. Overview
- 17.2.1.2. Products
- 17.2.1.3. SWOT Analysis
- 17.2.1.4. Recent Developments
- 17.2.1.5. Financials (Based on Availability)
- 17.2.2 2 EDF SA
- 17.2.2.1. Overview
- 17.2.2.2. Products
- 17.2.2.3. SWOT Analysis
- 17.2.2.4. Recent Developments
- 17.2.2.5. Financials (Based on Availability)
- 17.2.3 2 Vestas Wind Systems AS
- 17.2.3.1. Overview
- 17.2.3.2. Products
- 17.2.3.3. SWOT Analysis
- 17.2.3.4. Recent Developments
- 17.2.3.5. Financials (Based on Availability)
- 17.2.4 1 First Solar Inc
- 17.2.4.1. Overview
- 17.2.4.2. Products
- 17.2.4.3. SWOT Analysis
- 17.2.4.4. Recent Developments
- 17.2.4.5. Financials (Based on Availability)
- 17.2.5 5 Berkshire Hathway Energy
- 17.2.5.1. Overview
- 17.2.5.2. Products
- 17.2.5.3. SWOT Analysis
- 17.2.5.4. Recent Developments
- 17.2.5.5. Financials (Based on Availability)
- 17.2.6 Equipment Suppliers
- 17.2.6.1. Overview
- 17.2.6.2. Products
- 17.2.6.3. SWOT Analysis
- 17.2.6.4. Recent Developments
- 17.2.6.5. Financials (Based on Availability)
- 17.2.7 1 Orsted AS
- 17.2.7.1. Overview
- 17.2.7.2. Products
- 17.2.7.3. SWOT Analysis
- 17.2.7.4. Recent Developments
- 17.2.7.5. Financials (Based on Availability)
- 17.2.8 EPC Developers/Operators/Owners
- 17.2.8.1. Overview
- 17.2.8.2. Products
- 17.2.8.3. SWOT Analysis
- 17.2.8.4. Recent Developments
- 17.2.8.5. Financials (Based on Availability)
- 17.2.9 3 Canadian Solar Inc
- 17.2.9.1. Overview
- 17.2.9.2. Products
- 17.2.9.3. SWOT Analysis
- 17.2.9.4. Recent Developments
- 17.2.9.5. Financials (Based on Availability)
- 17.2.10 4 Duke Energy Corporation
- 17.2.10.1. Overview
- 17.2.10.2. Products
- 17.2.10.3. SWOT Analysis
- 17.2.10.4. Recent Developments
- 17.2.10.5. Financials (Based on Availability)
- 17.2.11 6 Acciona Energia SA
- 17.2.11.1. Overview
- 17.2.11.2. Products
- 17.2.11.3. SWOT Analysis
- 17.2.11.4. Recent Developments
- 17.2.11.5. Financials (Based on Availability)
- 17.2.12 3 NextEra Energy Inc
- 17.2.12.1. Overview
- 17.2.12.2. Products
- 17.2.12.3. SWOT Analysis
- 17.2.12.4. Recent Developments
- 17.2.12.5. Financials (Based on Availability)
- 17.2.13 5 General Electric Company
- 17.2.13.1. Overview
- 17.2.13.2. Products
- 17.2.13.3. SWOT Analysis
- 17.2.13.4. Recent Developments
- 17.2.13.5. Financials (Based on Availability)
- 17.2.14 6 Siemens Gamesa Renewable Energy SA*List Not Exhaustive 6 4 Market Ranking/Share (%) Analysi
- 17.2.14.1. Overview
- 17.2.14.2. Products
- 17.2.14.3. SWOT Analysis
- 17.2.14.4. Recent Developments
- 17.2.14.5. Financials (Based on Availability)
- 17.2.1 4 Jinko Solar Holding Co Ltd
List of Figures
- Figure 1: Global Renewable Energy Market Revenue Breakdown (Trillion, %) by Region 2024 & 2032
- Figure 2: Global Renewable Energy Market Volume Breakdown (TW, %) by Region 2024 & 2032
- Figure 3: North America Renewable Energy Market Revenue (Trillion), by Country 2024 & 2032
- Figure 4: North America Renewable Energy Market Volume (TW), by Country 2024 & 2032
- Figure 5: North America Renewable Energy Market Revenue Share (%), by Country 2024 & 2032
- Figure 6: North America Renewable Energy Market Volume Share (%), by Country 2024 & 2032
- Figure 7: Europe Renewable Energy Market Revenue (Trillion), by Country 2024 & 2032
- Figure 8: Europe Renewable Energy Market Volume (TW), by Country 2024 & 2032
- Figure 9: Europe Renewable Energy Market Revenue Share (%), by Country 2024 & 2032
- Figure 10: Europe Renewable Energy Market Volume Share (%), by Country 2024 & 2032
- Figure 11: Asia Pacific Renewable Energy Market Revenue (Trillion), by Country 2024 & 2032
- Figure 12: Asia Pacific Renewable Energy Market Volume (TW), by Country 2024 & 2032
- Figure 13: Asia Pacific Renewable Energy Market Revenue Share (%), by Country 2024 & 2032
- Figure 14: Asia Pacific Renewable Energy Market Volume Share (%), by Country 2024 & 2032
- Figure 15: South America Renewable Energy Market Revenue (Trillion), by Country 2024 & 2032
- Figure 16: South America Renewable Energy Market Volume (TW), by Country 2024 & 2032
- Figure 17: South America Renewable Energy Market Revenue Share (%), by Country 2024 & 2032
- Figure 18: South America Renewable Energy Market Volume Share (%), by Country 2024 & 2032
- Figure 19: North America Renewable Energy Market Revenue (Trillion), by Country 2024 & 2032
- Figure 20: North America Renewable Energy Market Volume (TW), by Country 2024 & 2032
- Figure 21: North America Renewable Energy Market Revenue Share (%), by Country 2024 & 2032
- Figure 22: North America Renewable Energy Market Volume Share (%), by Country 2024 & 2032
- Figure 23: MEA Renewable Energy Market Revenue (Trillion), by Country 2024 & 2032
- Figure 24: MEA Renewable Energy Market Volume (TW), by Country 2024 & 2032
- Figure 25: MEA Renewable Energy Market Revenue Share (%), by Country 2024 & 2032
- Figure 26: MEA Renewable Energy Market Volume Share (%), by Country 2024 & 2032
- Figure 27: North America Renewable Energy Market Revenue (Trillion), by Type 2024 & 2032
- Figure 28: North America Renewable Energy Market Volume (TW), by Type 2024 & 2032
- Figure 29: North America Renewable Energy Market Revenue Share (%), by Type 2024 & 2032
- Figure 30: North America Renewable Energy Market Volume Share (%), by Type 2024 & 2032
- Figure 31: North America Renewable Energy Market Revenue (Trillion), by Country 2024 & 2032
- Figure 32: North America Renewable Energy Market Volume (TW), by Country 2024 & 2032
- Figure 33: North America Renewable Energy Market Revenue Share (%), by Country 2024 & 2032
- Figure 34: North America Renewable Energy Market Volume Share (%), by Country 2024 & 2032
- Figure 35: Europe Renewable Energy Market Revenue (Trillion), by Type 2024 & 2032
- Figure 36: Europe Renewable Energy Market Volume (TW), by Type 2024 & 2032
- Figure 37: Europe Renewable Energy Market Revenue Share (%), by Type 2024 & 2032
- Figure 38: Europe Renewable Energy Market Volume Share (%), by Type 2024 & 2032
- Figure 39: Europe Renewable Energy Market Revenue (Trillion), by Country 2024 & 2032
- Figure 40: Europe Renewable Energy Market Volume (TW), by Country 2024 & 2032
- Figure 41: Europe Renewable Energy Market Revenue Share (%), by Country 2024 & 2032
- Figure 42: Europe Renewable Energy Market Volume Share (%), by Country 2024 & 2032
- Figure 43: Asia Pacific Renewable Energy Market Revenue (Trillion), by Type 2024 & 2032
- Figure 44: Asia Pacific Renewable Energy Market Volume (TW), by Type 2024 & 2032
- Figure 45: Asia Pacific Renewable Energy Market Revenue Share (%), by Type 2024 & 2032
- Figure 46: Asia Pacific Renewable Energy Market Volume Share (%), by Type 2024 & 2032
- Figure 47: Asia Pacific Renewable Energy Market Revenue (Trillion), by Country 2024 & 2032
- Figure 48: Asia Pacific Renewable Energy Market Volume (TW), by Country 2024 & 2032
- Figure 49: Asia Pacific Renewable Energy Market Revenue Share (%), by Country 2024 & 2032
- Figure 50: Asia Pacific Renewable Energy Market Volume Share (%), by Country 2024 & 2032
- Figure 51: Middle East and Africa Renewable Energy Market Revenue (Trillion), by Type 2024 & 2032
- Figure 52: Middle East and Africa Renewable Energy Market Volume (TW), by Type 2024 & 2032
- Figure 53: Middle East and Africa Renewable Energy Market Revenue Share (%), by Type 2024 & 2032
- Figure 54: Middle East and Africa Renewable Energy Market Volume Share (%), by Type 2024 & 2032
- Figure 55: Middle East and Africa Renewable Energy Market Revenue (Trillion), by Country 2024 & 2032
- Figure 56: Middle East and Africa Renewable Energy Market Volume (TW), by Country 2024 & 2032
- Figure 57: Middle East and Africa Renewable Energy Market Revenue Share (%), by Country 2024 & 2032
- Figure 58: Middle East and Africa Renewable Energy Market Volume Share (%), by Country 2024 & 2032
- Figure 59: South America Renewable Energy Market Revenue (Trillion), by Type 2024 & 2032
- Figure 60: South America Renewable Energy Market Volume (TW), by Type 2024 & 2032
- Figure 61: South America Renewable Energy Market Revenue Share (%), by Type 2024 & 2032
- Figure 62: South America Renewable Energy Market Volume Share (%), by Type 2024 & 2032
- Figure 63: South America Renewable Energy Market Revenue (Trillion), by Country 2024 & 2032
- Figure 64: South America Renewable Energy Market Volume (TW), by Country 2024 & 2032
- Figure 65: South America Renewable Energy Market Revenue Share (%), by Country 2024 & 2032
- Figure 66: South America Renewable Energy Market Volume Share (%), by Country 2024 & 2032
List of Tables
- Table 1: Global Renewable Energy Market Revenue Trillion Forecast, by Region 2019 & 2032
- Table 2: Global Renewable Energy Market Volume TW Forecast, by Region 2019 & 2032
- Table 3: Global Renewable Energy Market Revenue Trillion Forecast, by Type 2019 & 2032
- Table 4: Global Renewable Energy Market Volume TW Forecast, by Type 2019 & 2032
- Table 5: Global Renewable Energy Market Revenue Trillion Forecast, by Region 2019 & 2032
- Table 6: Global Renewable Energy Market Volume TW Forecast, by Region 2019 & 2032
- Table 7: Global Renewable Energy Market Revenue Trillion Forecast, by Country 2019 & 2032
- Table 8: Global Renewable Energy Market Volume TW Forecast, by Country 2019 & 2032
- Table 9: United States Renewable Energy Market Revenue (Trillion) Forecast, by Application 2019 & 2032
- Table 10: United States Renewable Energy Market Volume (TW) Forecast, by Application 2019 & 2032
- Table 11: Canada Renewable Energy Market Revenue (Trillion) Forecast, by Application 2019 & 2032
- Table 12: Canada Renewable Energy Market Volume (TW) Forecast, by Application 2019 & 2032
- Table 13: Mexico Renewable Energy Market Revenue (Trillion) Forecast, by Application 2019 & 2032
- Table 14: Mexico Renewable Energy Market Volume (TW) Forecast, by Application 2019 & 2032
- Table 15: Global Renewable Energy Market Revenue Trillion Forecast, by Country 2019 & 2032
- Table 16: Global Renewable Energy Market Volume TW Forecast, by Country 2019 & 2032
- Table 17: Germany Renewable Energy Market Revenue (Trillion) Forecast, by Application 2019 & 2032
- Table 18: Germany Renewable Energy Market Volume (TW) Forecast, by Application 2019 & 2032
- Table 19: United Kingdom Renewable Energy Market Revenue (Trillion) Forecast, by Application 2019 & 2032
- Table 20: United Kingdom Renewable Energy Market Volume (TW) Forecast, by Application 2019 & 2032
- Table 21: France Renewable Energy Market Revenue (Trillion) Forecast, by Application 2019 & 2032
- Table 22: France Renewable Energy Market Volume (TW) Forecast, by Application 2019 & 2032
- Table 23: Spain Renewable Energy Market Revenue (Trillion) Forecast, by Application 2019 & 2032
- Table 24: Spain Renewable Energy Market Volume (TW) Forecast, by Application 2019 & 2032
- Table 25: Italy Renewable Energy Market Revenue (Trillion) Forecast, by Application 2019 & 2032
- Table 26: Italy Renewable Energy Market Volume (TW) Forecast, by Application 2019 & 2032
- Table 27: Spain Renewable Energy Market Revenue (Trillion) Forecast, by Application 2019 & 2032
- Table 28: Spain Renewable Energy Market Volume (TW) Forecast, by Application 2019 & 2032
- Table 29: Belgium Renewable Energy Market Revenue (Trillion) Forecast, by Application 2019 & 2032
- Table 30: Belgium Renewable Energy Market Volume (TW) Forecast, by Application 2019 & 2032
- Table 31: Netherland Renewable Energy Market Revenue (Trillion) Forecast, by Application 2019 & 2032
- Table 32: Netherland Renewable Energy Market Volume (TW) Forecast, by Application 2019 & 2032
- Table 33: Nordics Renewable Energy Market Revenue (Trillion) Forecast, by Application 2019 & 2032
- Table 34: Nordics Renewable Energy Market Volume (TW) Forecast, by Application 2019 & 2032
- Table 35: Rest of Europe Renewable Energy Market Revenue (Trillion) Forecast, by Application 2019 & 2032
- Table 36: Rest of Europe Renewable Energy Market Volume (TW) Forecast, by Application 2019 & 2032
- Table 37: Global Renewable Energy Market Revenue Trillion Forecast, by Country 2019 & 2032
- Table 38: Global Renewable Energy Market Volume TW Forecast, by Country 2019 & 2032
- Table 39: China Renewable Energy Market Revenue (Trillion) Forecast, by Application 2019 & 2032
- Table 40: China Renewable Energy Market Volume (TW) Forecast, by Application 2019 & 2032
- Table 41: Japan Renewable Energy Market Revenue (Trillion) Forecast, by Application 2019 & 2032
- Table 42: Japan Renewable Energy Market Volume (TW) Forecast, by Application 2019 & 2032
- Table 43: India Renewable Energy Market Revenue (Trillion) Forecast, by Application 2019 & 2032
- Table 44: India Renewable Energy Market Volume (TW) Forecast, by Application 2019 & 2032
- Table 45: South Korea Renewable Energy Market Revenue (Trillion) Forecast, by Application 2019 & 2032
- Table 46: South Korea Renewable Energy Market Volume (TW) Forecast, by Application 2019 & 2032
- Table 47: Southeast Asia Renewable Energy Market Revenue (Trillion) Forecast, by Application 2019 & 2032
- Table 48: Southeast Asia Renewable Energy Market Volume (TW) Forecast, by Application 2019 & 2032
- Table 49: Australia Renewable Energy Market Revenue (Trillion) Forecast, by Application 2019 & 2032
- Table 50: Australia Renewable Energy Market Volume (TW) Forecast, by Application 2019 & 2032
- Table 51: Indonesia Renewable Energy Market Revenue (Trillion) Forecast, by Application 2019 & 2032
- Table 52: Indonesia Renewable Energy Market Volume (TW) Forecast, by Application 2019 & 2032
- Table 53: Phillipes Renewable Energy Market Revenue (Trillion) Forecast, by Application 2019 & 2032
- Table 54: Phillipes Renewable Energy Market Volume (TW) Forecast, by Application 2019 & 2032
- Table 55: Singapore Renewable Energy Market Revenue (Trillion) Forecast, by Application 2019 & 2032
- Table 56: Singapore Renewable Energy Market Volume (TW) Forecast, by Application 2019 & 2032
- Table 57: Thailandc Renewable Energy Market Revenue (Trillion) Forecast, by Application 2019 & 2032
- Table 58: Thailandc Renewable Energy Market Volume (TW) Forecast, by Application 2019 & 2032
- Table 59: Rest of Asia Pacific Renewable Energy Market Revenue (Trillion) Forecast, by Application 2019 & 2032
- Table 60: Rest of Asia Pacific Renewable Energy Market Volume (TW) Forecast, by Application 2019 & 2032
- Table 61: Global Renewable Energy Market Revenue Trillion Forecast, by Country 2019 & 2032
- Table 62: Global Renewable Energy Market Volume TW Forecast, by Country 2019 & 2032
- Table 63: Brazil Renewable Energy Market Revenue (Trillion) Forecast, by Application 2019 & 2032
- Table 64: Brazil Renewable Energy Market Volume (TW) Forecast, by Application 2019 & 2032
- Table 65: Argentina Renewable Energy Market Revenue (Trillion) Forecast, by Application 2019 & 2032
- Table 66: Argentina Renewable Energy Market Volume (TW) Forecast, by Application 2019 & 2032
- Table 67: Peru Renewable Energy Market Revenue (Trillion) Forecast, by Application 2019 & 2032
- Table 68: Peru Renewable Energy Market Volume (TW) Forecast, by Application 2019 & 2032
- Table 69: Chile Renewable Energy Market Revenue (Trillion) Forecast, by Application 2019 & 2032
- Table 70: Chile Renewable Energy Market Volume (TW) Forecast, by Application 2019 & 2032
- Table 71: Colombia Renewable Energy Market Revenue (Trillion) Forecast, by Application 2019 & 2032
- Table 72: Colombia Renewable Energy Market Volume (TW) Forecast, by Application 2019 & 2032
- Table 73: Ecuador Renewable Energy Market Revenue (Trillion) Forecast, by Application 2019 & 2032
- Table 74: Ecuador Renewable Energy Market Volume (TW) Forecast, by Application 2019 & 2032
- Table 75: Venezuela Renewable Energy Market Revenue (Trillion) Forecast, by Application 2019 & 2032
- Table 76: Venezuela Renewable Energy Market Volume (TW) Forecast, by Application 2019 & 2032
- Table 77: Rest of South America Renewable Energy Market Revenue (Trillion) Forecast, by Application 2019 & 2032
- Table 78: Rest of South America Renewable Energy Market Volume (TW) Forecast, by Application 2019 & 2032
- Table 79: Global Renewable Energy Market Revenue Trillion Forecast, by Country 2019 & 2032
- Table 80: Global Renewable Energy Market Volume TW Forecast, by Country 2019 & 2032
- Table 81: United States Renewable Energy Market Revenue (Trillion) Forecast, by Application 2019 & 2032
- Table 82: United States Renewable Energy Market Volume (TW) Forecast, by Application 2019 & 2032
- Table 83: Canada Renewable Energy Market Revenue (Trillion) Forecast, by Application 2019 & 2032
- Table 84: Canada Renewable Energy Market Volume (TW) Forecast, by Application 2019 & 2032
- Table 85: Mexico Renewable Energy Market Revenue (Trillion) Forecast, by Application 2019 & 2032
- Table 86: Mexico Renewable Energy Market Volume (TW) Forecast, by Application 2019 & 2032
- Table 87: Global Renewable Energy Market Revenue Trillion Forecast, by Country 2019 & 2032
- Table 88: Global Renewable Energy Market Volume TW Forecast, by Country 2019 & 2032
- Table 89: United Arab Emirates Renewable Energy Market Revenue (Trillion) Forecast, by Application 2019 & 2032
- Table 90: United Arab Emirates Renewable Energy Market Volume (TW) Forecast, by Application 2019 & 2032
- Table 91: Saudi Arabia Renewable Energy Market Revenue (Trillion) Forecast, by Application 2019 & 2032
- Table 92: Saudi Arabia Renewable Energy Market Volume (TW) Forecast, by Application 2019 & 2032
- Table 93: South Africa Renewable Energy Market Revenue (Trillion) Forecast, by Application 2019 & 2032
- Table 94: South Africa Renewable Energy Market Volume (TW) Forecast, by Application 2019 & 2032
- Table 95: Rest of Middle East and Africa Renewable Energy Market Revenue (Trillion) Forecast, by Application 2019 & 2032
- Table 96: Rest of Middle East and Africa Renewable Energy Market Volume (TW) Forecast, by Application 2019 & 2032
- Table 97: Global Renewable Energy Market Revenue Trillion Forecast, by Type 2019 & 2032
- Table 98: Global Renewable Energy Market Volume TW Forecast, by Type 2019 & 2032
- Table 99: Global Renewable Energy Market Revenue Trillion Forecast, by Country 2019 & 2032
- Table 100: Global Renewable Energy Market Volume TW Forecast, by Country 2019 & 2032
- Table 101: United States of America Renewable Energy Market Revenue (Trillion) Forecast, by Application 2019 & 2032
- Table 102: United States of America Renewable Energy Market Volume (TW) Forecast, by Application 2019 & 2032
- Table 103: Canada Renewable Energy Market Revenue (Trillion) Forecast, by Application 2019 & 2032
- Table 104: Canada Renewable Energy Market Volume (TW) Forecast, by Application 2019 & 2032
- Table 105: Rest of the North America Renewable Energy Market Revenue (Trillion) Forecast, by Application 2019 & 2032
- Table 106: Rest of the North America Renewable Energy Market Volume (TW) Forecast, by Application 2019 & 2032
- Table 107: Global Renewable Energy Market Revenue Trillion Forecast, by Type 2019 & 2032
- Table 108: Global Renewable Energy Market Volume TW Forecast, by Type 2019 & 2032
- Table 109: Global Renewable Energy Market Revenue Trillion Forecast, by Country 2019 & 2032
- Table 110: Global Renewable Energy Market Volume TW Forecast, by Country 2019 & 2032
- Table 111: United Kingdom Renewable Energy Market Revenue (Trillion) Forecast, by Application 2019 & 2032
- Table 112: United Kingdom Renewable Energy Market Volume (TW) Forecast, by Application 2019 & 2032
- Table 113: Germany Renewable Energy Market Revenue (Trillion) Forecast, by Application 2019 & 2032
- Table 114: Germany Renewable Energy Market Volume (TW) Forecast, by Application 2019 & 2032
- Table 115: France Renewable Energy Market Revenue (Trillion) Forecast, by Application 2019 & 2032
- Table 116: France Renewable Energy Market Volume (TW) Forecast, by Application 2019 & 2032
- Table 117: Spain Renewable Energy Market Revenue (Trillion) Forecast, by Application 2019 & 2032
- Table 118: Spain Renewable Energy Market Volume (TW) Forecast, by Application 2019 & 2032
- Table 119: NORDIC Renewable Energy Market Revenue (Trillion) Forecast, by Application 2019 & 2032
- Table 120: NORDIC Renewable Energy Market Volume (TW) Forecast, by Application 2019 & 2032
- Table 121: Turkey Renewable Energy Market Revenue (Trillion) Forecast, by Application 2019 & 2032
- Table 122: Turkey Renewable Energy Market Volume (TW) Forecast, by Application 2019 & 2032
- Table 123: Russia Renewable Energy Market Revenue (Trillion) Forecast, by Application 2019 & 2032
- Table 124: Russia Renewable Energy Market Volume (TW) Forecast, by Application 2019 & 2032
- Table 125: Rest of the Europe Renewable Energy Market Revenue (Trillion) Forecast, by Application 2019 & 2032
- Table 126: Rest of the Europe Renewable Energy Market Volume (TW) Forecast, by Application 2019 & 2032
- Table 127: Global Renewable Energy Market Revenue Trillion Forecast, by Type 2019 & 2032
- Table 128: Global Renewable Energy Market Volume TW Forecast, by Type 2019 & 2032
- Table 129: Global Renewable Energy Market Revenue Trillion Forecast, by Country 2019 & 2032
- Table 130: Global Renewable Energy Market Volume TW Forecast, by Country 2019 & 2032
- Table 131: China Renewable Energy Market Revenue (Trillion) Forecast, by Application 2019 & 2032
- Table 132: China Renewable Energy Market Volume (TW) Forecast, by Application 2019 & 2032
- Table 133: India Renewable Energy Market Revenue (Trillion) Forecast, by Application 2019 & 2032
- Table 134: India Renewable Energy Market Volume (TW) Forecast, by Application 2019 & 2032
- Table 135: Japan Renewable Energy Market Revenue (Trillion) Forecast, by Application 2019 & 2032
- Table 136: Japan Renewable Energy Market Volume (TW) Forecast, by Application 2019 & 2032
- Table 137: Malaysia Renewable Energy Market Revenue (Trillion) Forecast, by Application 2019 & 2032
- Table 138: Malaysia Renewable Energy Market Volume (TW) Forecast, by Application 2019 & 2032
- Table 139: Thailand Renewable Energy Market Revenue (Trillion) Forecast, by Application 2019 & 2032
- Table 140: Thailand Renewable Energy Market Volume (TW) Forecast, by Application 2019 & 2032
- Table 141: Indonesia Renewable Energy Market Revenue (Trillion) Forecast, by Application 2019 & 2032
- Table 142: Indonesia Renewable Energy Market Volume (TW) Forecast, by Application 2019 & 2032
- Table 143: Vietnam Renewable Energy Market Revenue (Trillion) Forecast, by Application 2019 & 2032
- Table 144: Vietnam Renewable Energy Market Volume (TW) Forecast, by Application 2019 & 2032
- Table 145: Rest of Asia Pacific Renewable Energy Market Revenue (Trillion) Forecast, by Application 2019 & 2032
- Table 146: Rest of Asia Pacific Renewable Energy Market Volume (TW) Forecast, by Application 2019 & 2032
- Table 147: Global Renewable Energy Market Revenue Trillion Forecast, by Type 2019 & 2032
- Table 148: Global Renewable Energy Market Volume TW Forecast, by Type 2019 & 2032
- Table 149: Global Renewable Energy Market Revenue Trillion Forecast, by Country 2019 & 2032
- Table 150: Global Renewable Energy Market Volume TW Forecast, by Country 2019 & 2032
- Table 151: United Arab Emirates Renewable Energy Market Revenue (Trillion) Forecast, by Application 2019 & 2032
- Table 152: United Arab Emirates Renewable Energy Market Volume (TW) Forecast, by Application 2019 & 2032
- Table 153: Saudi Arabia Renewable Energy Market Revenue (Trillion) Forecast, by Application 2019 & 2032
- Table 154: Saudi Arabia Renewable Energy Market Volume (TW) Forecast, by Application 2019 & 2032
- Table 155: Egypt Renewable Energy Market Revenue (Trillion) Forecast, by Application 2019 & 2032
- Table 156: Egypt Renewable Energy Market Volume (TW) Forecast, by Application 2019 & 2032
- Table 157: Nigeria Renewable Energy Market Revenue (Trillion) Forecast, by Application 2019 & 2032
- Table 158: Nigeria Renewable Energy Market Volume (TW) Forecast, by Application 2019 & 2032
- Table 159: South Africa Renewable Energy Market Revenue (Trillion) Forecast, by Application 2019 & 2032
- Table 160: South Africa Renewable Energy Market Volume (TW) Forecast, by Application 2019 & 2032
- Table 161: Qatar Renewable Energy Market Revenue (Trillion) Forecast, by Application 2019 & 2032
- Table 162: Qatar Renewable Energy Market Volume (TW) Forecast, by Application 2019 & 2032
- Table 163: Rest of the Middle East and Africa Renewable Energy Market Revenue (Trillion) Forecast, by Application 2019 & 2032
- Table 164: Rest of the Middle East and Africa Renewable Energy Market Volume (TW) Forecast, by Application 2019 & 2032
- Table 165: Global Renewable Energy Market Revenue Trillion Forecast, by Type 2019 & 2032
- Table 166: Global Renewable Energy Market Volume TW Forecast, by Type 2019 & 2032
- Table 167: Global Renewable Energy Market Revenue Trillion Forecast, by Country 2019 & 2032
- Table 168: Global Renewable Energy Market Volume TW Forecast, by Country 2019 & 2032
- Table 169: Brazil Renewable Energy Market Revenue (Trillion) Forecast, by Application 2019 & 2032
- Table 170: Brazil Renewable Energy Market Volume (TW) Forecast, by Application 2019 & 2032
- Table 171: Argentina Renewable Energy Market Revenue (Trillion) Forecast, by Application 2019 & 2032
- Table 172: Argentina Renewable Energy Market Volume (TW) Forecast, by Application 2019 & 2032
- Table 173: Colombia Renewable Energy Market Revenue (Trillion) Forecast, by Application 2019 & 2032
- Table 174: Colombia Renewable Energy Market Volume (TW) Forecast, by Application 2019 & 2032
- Table 175: Rest of the South America Renewable Energy Market Revenue (Trillion) Forecast, by Application 2019 & 2032
- Table 176: Rest of the South America Renewable Energy Market Volume (TW) Forecast, by Application 2019 & 2032
Frequently Asked Questions
1. What is the projected Compound Annual Growth Rate (CAGR) of the Renewable Energy Market?
The projected CAGR is approximately 7.09%.
2. Which companies are prominent players in the Renewable Energy Market?
Key companies in the market include 4 Jinko Solar Holding Co Ltd, 2 EDF SA, 2 Vestas Wind Systems AS, 1 First Solar Inc, 5 Berkshire Hathway Energy, Equipment Suppliers, 1 Orsted AS, EPC Developers/Operators/Owners, 3 Canadian Solar Inc, 4 Duke Energy Corporation, 6 Acciona Energia SA, 3 NextEra Energy Inc, 5 General Electric Company, 6 Siemens Gamesa Renewable Energy SA*List Not Exhaustive 6 4 Market Ranking/Share (%) Analysi.
3. What are the main segments of the Renewable Energy Market?
The market segments include Type.
4. Can you provide details about the market size?
The market size is estimated to be USD 1.32 Trillion as of 2022.
5. What are some drivers contributing to market growth?
4.; Favorable Government Policies for Renewable Energy4.; The Declining Price of Solar Panels and Wind Turbine Installations4.; Increasing Investments in Hydropower and Pumped Storage Hydropower Projects4.; Growing Emphasis on Geothermal Energy.
6. What are the notable trends driving market growth?
Hydropower Segment is Expected to Dominate the Market during the Forecast Period.
7. Are there any restraints impacting market growth?
4.; Increasing Penetration of Natural Gas for Power Generation.
8. Can you provide examples of recent developments in the market?
April 2023: ArcelorMittal announced that the company's Brazilian entity, ArcelorMittal Brazil, formed a joint venture with the Brazilian renewable energy company Casa dos Ventos to develop the 554 MW Babilonia wind power project. The project is expected to be developed at a cost of USD 800 million and will be located in the central region of Bahia, northeast Brazil. ArcelorMittal is anticipated to hold a 55% share in the joint venture, and the remaining share will be held by Casa dos Ventos.
9. What pricing options are available for accessing the report?
Pricing options include single-user, multi-user, and enterprise licenses priced at USD 4750, USD 5250, and USD 8750 respectively.
10. Is the market size provided in terms of value or volume?
The market size is provided in terms of value, measured in Trillion and volume, measured in TW.
11. Are there any specific market keywords associated with the report?
Yes, the market keyword associated with the report is "Renewable Energy Market," which aids in identifying and referencing the specific market segment covered.
12. How do I determine which pricing option suits my needs best?
The pricing options vary based on user requirements and access needs. Individual users may opt for single-user licenses, while businesses requiring broader access may choose multi-user or enterprise licenses for cost-effective access to the report.
13. Are there any additional resources or data provided in the Renewable Energy Market report?
While the report offers comprehensive insights, it's advisable to review the specific contents or supplementary materials provided to ascertain if additional resources or data are available.
14. How can I stay updated on further developments or reports in the Renewable Energy Market?
To stay informed about further developments, trends, and reports in the Renewable Energy Market, consider subscribing to industry newsletters, following relevant companies and organizations, or regularly checking reputable industry news sources and publications.
Methodology
Step 1 - Identification of Relevant Samples Size from Population Database


Step 2 - Approaches for Defining Global Market Size (Value, Volume* & Price*)

Note*: In applicable scenarios
Step 3 - Data Sources
Primary Research
- Web Analytics
- Survey Reports
- Research Institute
- Latest Research Reports
- Opinion Leaders
Secondary Research
- Annual Reports
- White Paper
- Latest Press Release
- Industry Association
- Paid Database
- Investor Presentations

Step 4 - Data Triangulation
Involves using different sources of information in order to increase the validity of a study
These sources are likely to be stakeholders in a program - participants, other researchers, program staff, other community members, and so on.
Then we put all data in single framework & apply various statistical tools to find out the dynamic on the market.
During the analysis stage, feedback from the stakeholder groups would be compared to determine areas of agreement as well as areas of divergence


