Diaphragm Pump Market Market Analysis and Forecasts

Diaphragm Pump Market by Mechanism (Air Operated, Electrically Operated), by Discharge Pressure (Up to 80 bar, Between 80 to 200 bar, Above 200 bar), by End-User (Water and Wastewater, Oil and Gas, Chemical and Petrochemical, Pharmaceutical, Food and Beverage, Other End-Users), by North America, by Europe, by Asia Pacific, by South America, by Middle East and Africa Forecast 2025-2033

Jul 16 2025
Base Year: 2024

180 Pages
Main Logo

Diaphragm Pump Market Market Analysis and Forecasts


Home
Industries
Energy & Power
sponsor image
sponsor image
sponsor image
sponsor image
sponsor image

Tailored for you

  • In-depth Analysis Tailored to Specified Regions or Segments
  • Company Profiles Customized to User Preferences
  • Comprehensive Insights Focused on Specific Segments or Regions
  • Customized Evaluation of Competitive Landscape to Meet Your Needs
  • Tailored Customization to Address Other Specific Requirements
Ask for customization


Key Insights

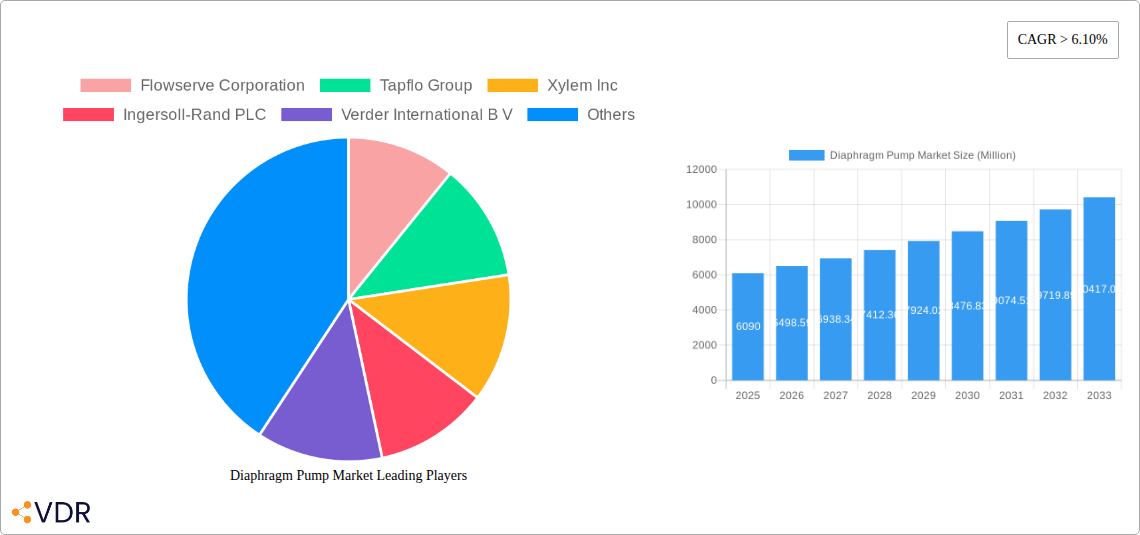
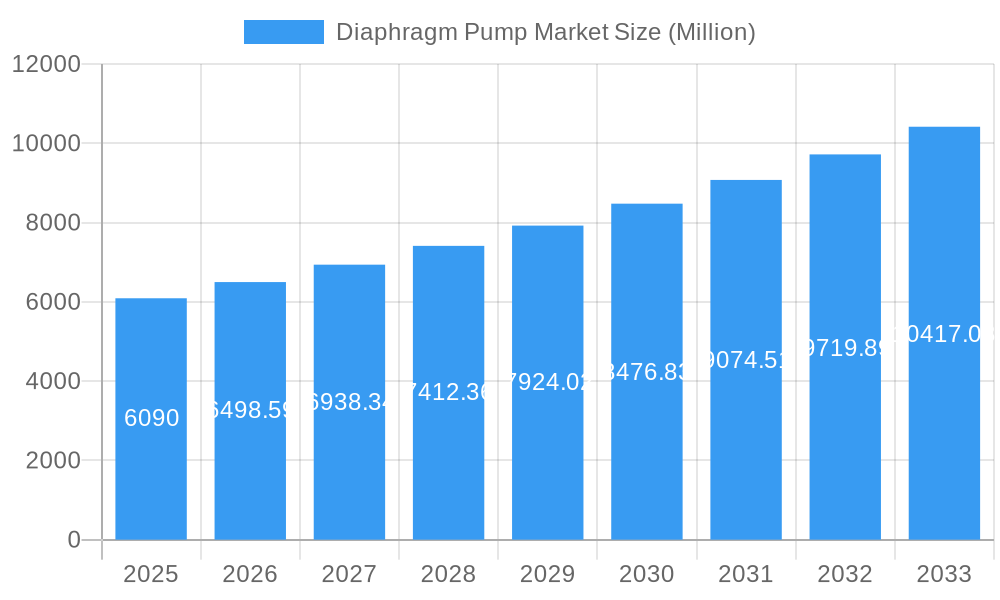
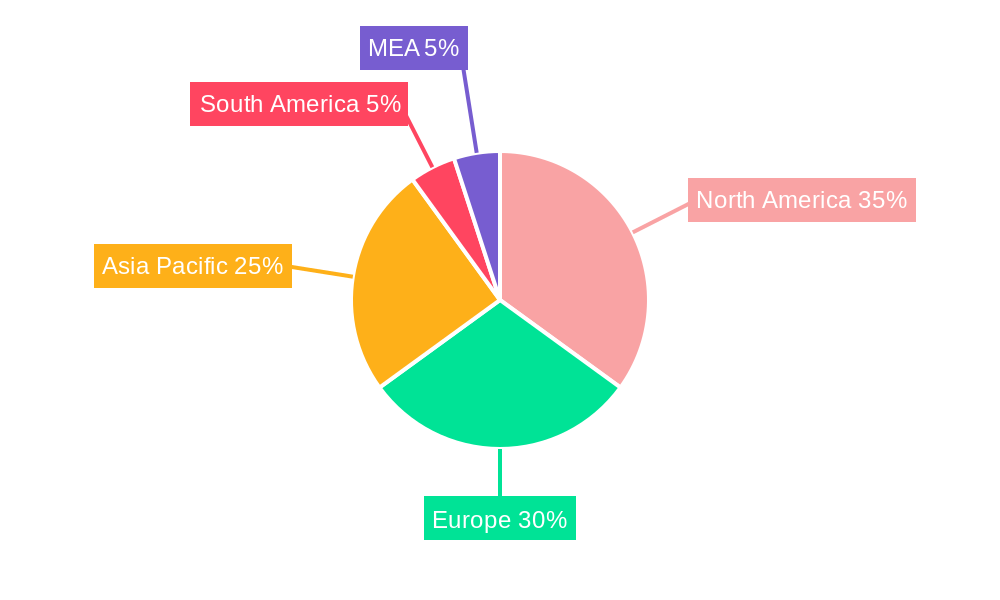
The global diaphragm pump market, valued at $6.09 billion in 2025, is projected to experience robust growth, exhibiting a Compound Annual Growth Rate (CAGR) exceeding 6.10% from 2025 to 2033. This expansion is fueled by several key factors. The increasing demand for efficient and reliable fluid transfer solutions across diverse industries, such as water and wastewater treatment, oil and gas extraction, and chemical processing, is a primary driver. Furthermore, the rising adoption of advanced materials and improved designs leading to enhanced durability and performance of diaphragm pumps contributes significantly to market growth. Stringent environmental regulations promoting cleaner production processes and minimizing waste further bolster market demand. Segmentation analysis reveals that air-operated diaphragm pumps currently hold a substantial market share, although electrically operated pumps are gaining traction due to their energy efficiency and ease of automation. Similarly, the high-pressure segment (above 200 bar) is witnessing accelerated growth driven by applications demanding precise fluid handling in specialized industries. Geographically, North America and Europe currently dominate the market, but the Asia-Pacific region is expected to demonstrate the fastest growth rate due to rapid industrialization and infrastructure development in countries like China and India.

The competitive landscape is characterized by the presence of both established players and specialized manufacturers. Companies like Flowserve Corporation, Xylem Inc., and Graco Inc. are major market participants, leveraging their extensive product portfolios and global reach. However, the market also presents opportunities for smaller, specialized firms focusing on niche applications or innovative technologies. While factors such as high initial investment costs and potential maintenance challenges might pose some restraints, the overall market outlook remains positive, driven by the continuous need for reliable and versatile pumping solutions across a broad range of industrial and commercial applications. The market's future trajectory will be influenced by technological advancements, evolving regulatory landscapes, and the ongoing expansion of key end-user industries.

Diaphragm Pump Market Research Report - Market Size, Growth & Forecast

Diaphragm Pump Market: A Comprehensive Report (2019-2033)

This in-depth report provides a comprehensive analysis of the global Diaphragm Pump Market, encompassing market dynamics, growth trends, regional dominance, product landscape, key players, and future outlook. The study period covers 2019-2033, with 2025 as the base and estimated year. This report is crucial for industry professionals, investors, and strategic decision-makers seeking a clear understanding of this dynamic market. The market is segmented by mechanism (Air Operated, Electrically Operated), discharge pressure (Up to 80 bar, Between 80 to 200 bar, Above 200 bar), and end-user (Water and Wastewater, Oil and Gas, Chemical and Petrochemical, Pharmaceutical, Food and Beverage, Other End-Users). The market is projected to reach xx million units by 2033.

Diaphragm Pump Market Market Dynamics & Structure

This section analyzes the Diaphragm Pump market's competitive landscape, technological advancements, regulatory influences, and market trends. The market is moderately concentrated, with several key players holding significant market share. Technological innovations, particularly in energy efficiency and material science, are driving market growth. Stringent environmental regulations are also shaping product development and adoption. The report examines the impact of mergers and acquisitions (M&A) activity on market consolidation and competitive dynamics. The analysis includes quantitative data on market shares and M&A deal volumes, alongside qualitative insights into innovation barriers and market entry strategies.

  • Market Concentration: Moderately concentrated, with top 5 players holding approximately xx% market share in 2024.
  • Technological Innovation: Focus on energy-efficient designs, advanced materials (e.g., corrosion-resistant polymers), and smart functionalities.
  • Regulatory Framework: Stringent emission and safety standards impacting product development and adoption.
  • Competitive Substitutes: Centrifugal pumps, piston pumps, and peristaltic pumps pose some competitive challenges.
  • M&A Trends: Consolidation expected to continue, driven by economies of scale and technological advancements. xx M&A deals recorded between 2019-2024.
  • End-User Demographics: Growing demand from Water and Wastewater, Oil & Gas and Chemical sectors.

Diaphragm Pump Market Growth Trends & Insights

This section details the Diaphragm Pump market's historical and projected growth trajectory. We analyze market size evolution, adoption rates across various end-user segments, and the impact of technological disruptions. The analysis considers consumer behavior shifts, emphasizing the factors influencing purchase decisions, such as cost, efficiency, and reliability. Key metrics, including the Compound Annual Growth Rate (CAGR) and market penetration rates, provide a granular view of market expansion. The market exhibited a CAGR of xx% during 2019-2024 and is projected to grow at a CAGR of xx% from 2025 to 2033, driven primarily by increasing demand from the chemical and water treatment industries. Technological advancements, particularly in automation and remote monitoring, are accelerating adoption rates.

Diaphragm Pump Market Growth

Dominant Regions, Countries, or Segments in Diaphragm Pump Market

This section identifies the leading regions, countries, and market segments driving Diaphragm Pump market growth. North America and Europe currently dominate, fueled by robust industrial activity and stringent environmental regulations. However, the Asia-Pacific region is expected to witness significant growth due to rapid industrialization and infrastructure development. The analysis delves into factors such as economic policies, infrastructure investments, and government regulations influencing regional market dynamics. Within segments, the air-operated diaphragm pumps segment currently holds the largest market share, but electrically operated pumps are showing rapid growth, fueled by advancements in energy efficiency and automation.

  • Leading Regions: North America and Europe (xx million units combined in 2024).
  • High-Growth Regions: Asia-Pacific (projected xx% CAGR 2025-2033).
  • Dominant Segments (Mechanism): Air-Operated (xx% market share in 2024), Electrically-Operated (showing fastest growth).
  • Dominant Segments (Discharge Pressure): Up to 80 bar (largest market share).
  • Dominant Segments (End-User): Water and Wastewater (largest market share).

Diaphragm Pump Market Product Landscape

Diaphragm pump technology continues to evolve, focusing on improved efficiency, durability, and ease of maintenance. Recent innovations include the incorporation of advanced materials for enhanced chemical resistance and the integration of smart sensors for real-time monitoring and predictive maintenance. These advancements cater to diverse applications across various industries, providing solutions for high-volume fluid transfer, precise metering, and harsh chemical handling. Unique selling propositions include increased flow rates, reduced energy consumption, and improved reliability.

Key Drivers, Barriers & Challenges in Diaphragm Pump Market

Key Drivers: The increasing demand from various end-use industries (water and wastewater treatment, oil and gas, chemical processing) is a primary driver. Technological advancements in pump designs leading to increased efficiency and improved performance are also significant factors. Government regulations aimed at reducing environmental impact are creating opportunities for eco-friendly diaphragm pump solutions.

Key Barriers & Challenges: High initial investment costs, potential maintenance complexities, and the availability of substitute technologies are key challenges. Supply chain disruptions and fluctuations in raw material prices also impact market dynamics. Competitive pressure from established players and new entrants presents ongoing challenges.

Emerging Opportunities in Diaphragm Pump Market

Emerging opportunities lie in the growing adoption of diaphragm pumps in niche applications, such as pharmaceutical and food processing. The development of customized diaphragm pumps tailored to specific industry needs presents significant growth potential. Expanding into untapped markets, particularly in developing economies, also offers considerable opportunities. Furthermore, the integration of advanced technologies like IoT and AI could enhance the capabilities of diaphragm pumps, creating new market segments.

Growth Accelerators in the Diaphragm Pump Market Industry

Long-term growth will be accelerated by continuous technological innovations, strategic partnerships, and market expansion strategies. Advancements in materials science, leading to more durable and chemically resistant pumps, will drive adoption. Strategic collaborations between pump manufacturers and end-users will facilitate customized solutions and enhance market penetration. Expanding into new geographical markets with a focus on emerging economies will unlock significant growth potential.

Key Players Shaping the Diaphragm Pump Market Market

  • Flowserve Corporation
  • Tapflo Group
  • Xylem Inc
  • Ingersoll-Rand PLC
  • Verder International B.V.
  • Graco Inc
  • LEWA Group
  • Idex Corporation
  • Dover Corporation
  • SPX FLOW Inc
  • Yamada Corporation
  • Grundfos AS

Notable Milestones in Diaphragm Pump Sector

  • August 2021: Graco Inc. launched the Husky 3300e electric double diaphragm pump, offering high-volume fluid transfer and reduced power consumption.
  • April 2020: Quattroflow (part of PSG and Dover Corporation) introduced the QF2500 Quaternary Diaphragm Pump, ideal for demanding biopharma applications.

In-Depth Diaphragm Pump Market Market Outlook

The Diaphragm Pump market is poised for continued growth, driven by robust demand from diverse industries and ongoing technological advancements. Strategic investments in R&D, focus on sustainable solutions, and expansion into new applications will shape future market dynamics. Companies that leverage digital technologies and prioritize customer-centric strategies will be best positioned for success in this competitive landscape. The market's future potential is significant, with opportunities for both established players and new entrants to capitalize on emerging trends and untapped market segments.

Diaphragm Pump Market Segmentation

  • 1. Mechanism
    • 1.1. Air Operated
    • 1.2. Electrically Operated
  • 2. Discharge Pressure
    • 2.1. Up to 80 bar
    • 2.2. Between 80 to 200 bar
    • 2.3. Above 200 bar
  • 3. End-User
    • 3.1. Water and Wastewater
    • 3.2. Oil and Gas
    • 3.3. Chemical and Petrochemical
    • 3.4. Pharmaceutical
    • 3.5. Food and Beverage
    • 3.6. Other End-Users

Diaphragm Pump Market Segmentation By Geography

  • 1. North America
  • 2. Europe
  • 3. Asia Pacific
  • 4. South America
  • 5. Middle East and Africa
Diaphragm Pump Market Regional Share


Diaphragm Pump Market REPORT HIGHLIGHTS

AspectsDetails
Study Period 2019-2033
Base Year 2024
Estimated Year 2025
Forecast Period2025-2033
Historical Period2019-2024
Growth RateCAGR of > 6.10% from 2019-2033
Segmentation
    • By Mechanism
      • Air Operated
      • Electrically Operated
    • By Discharge Pressure
      • Up to 80 bar
      • Between 80 to 200 bar
      • Above 200 bar
    • By End-User
      • Water and Wastewater
      • Oil and Gas
      • Chemical and Petrochemical
      • Pharmaceutical
      • Food and Beverage
      • Other End-Users
  • By Geography
    • North America
    • Europe
    • Asia Pacific
    • South America
    • Middle East and Africa


Table of Contents

  1. 1. Introduction
    • 1.1. Research Scope
    • 1.2. Market Segmentation
    • 1.3. Research Methodology
    • 1.4. Definitions and Assumptions
  2. 2. Executive Summary
    • 2.1. Introduction
  3. 3. Market Dynamics
    • 3.1. Introduction
      • 3.2. Market Drivers
        • 3.2.1. 4.; Declining Costs of Solar Technologies4.; Demand for Decentralized Solar Energy Systems
      • 3.3. Market Restrains
        • 3.3.1. 4.; Absence of Any New Initiatives in the Country
      • 3.4. Market Trends
        • 3.4.1. Water and Wastewater Sector to Dominate the Market
  4. 4. Market Factor Analysis
    • 4.1. Porters Five Forces
    • 4.2. Supply/Value Chain
    • 4.3. PESTEL analysis
    • 4.4. Market Entropy
    • 4.5. Patent/Trademark Analysis
  5. 5. Global Diaphragm Pump Market Analysis, Insights and Forecast, 2019-2031
    • 5.1. Market Analysis, Insights and Forecast - by Mechanism
      • 5.1.1. Air Operated
      • 5.1.2. Electrically Operated
    • 5.2. Market Analysis, Insights and Forecast - by Discharge Pressure
      • 5.2.1. Up to 80 bar
      • 5.2.2. Between 80 to 200 bar
      • 5.2.3. Above 200 bar
    • 5.3. Market Analysis, Insights and Forecast - by End-User
      • 5.3.1. Water and Wastewater
      • 5.3.2. Oil and Gas
      • 5.3.3. Chemical and Petrochemical
      • 5.3.4. Pharmaceutical
      • 5.3.5. Food and Beverage
      • 5.3.6. Other End-Users
    • 5.4. Market Analysis, Insights and Forecast - by Region
      • 5.4.1. North America
      • 5.4.2. Europe
      • 5.4.3. Asia Pacific
      • 5.4.4. South America
      • 5.4.5. Middle East and Africa
  6. 6. North America Diaphragm Pump Market Analysis, Insights and Forecast, 2019-2031
    • 6.1. Market Analysis, Insights and Forecast - by Mechanism
      • 6.1.1. Air Operated
      • 6.1.2. Electrically Operated
    • 6.2. Market Analysis, Insights and Forecast - by Discharge Pressure
      • 6.2.1. Up to 80 bar
      • 6.2.2. Between 80 to 200 bar
      • 6.2.3. Above 200 bar
    • 6.3. Market Analysis, Insights and Forecast - by End-User
      • 6.3.1. Water and Wastewater
      • 6.3.2. Oil and Gas
      • 6.3.3. Chemical and Petrochemical
      • 6.3.4. Pharmaceutical
      • 6.3.5. Food and Beverage
      • 6.3.6. Other End-Users
  7. 7. Europe Diaphragm Pump Market Analysis, Insights and Forecast, 2019-2031
    • 7.1. Market Analysis, Insights and Forecast - by Mechanism
      • 7.1.1. Air Operated
      • 7.1.2. Electrically Operated
    • 7.2. Market Analysis, Insights and Forecast - by Discharge Pressure
      • 7.2.1. Up to 80 bar
      • 7.2.2. Between 80 to 200 bar
      • 7.2.3. Above 200 bar
    • 7.3. Market Analysis, Insights and Forecast - by End-User
      • 7.3.1. Water and Wastewater
      • 7.3.2. Oil and Gas
      • 7.3.3. Chemical and Petrochemical
      • 7.3.4. Pharmaceutical
      • 7.3.5. Food and Beverage
      • 7.3.6. Other End-Users
  8. 8. Asia Pacific Diaphragm Pump Market Analysis, Insights and Forecast, 2019-2031
    • 8.1. Market Analysis, Insights and Forecast - by Mechanism
      • 8.1.1. Air Operated
      • 8.1.2. Electrically Operated
    • 8.2. Market Analysis, Insights and Forecast - by Discharge Pressure
      • 8.2.1. Up to 80 bar
      • 8.2.2. Between 80 to 200 bar
      • 8.2.3. Above 200 bar
    • 8.3. Market Analysis, Insights and Forecast - by End-User
      • 8.3.1. Water and Wastewater
      • 8.3.2. Oil and Gas
      • 8.3.3. Chemical and Petrochemical
      • 8.3.4. Pharmaceutical
      • 8.3.5. Food and Beverage
      • 8.3.6. Other End-Users
  9. 9. South America Diaphragm Pump Market Analysis, Insights and Forecast, 2019-2031
    • 9.1. Market Analysis, Insights and Forecast - by Mechanism
      • 9.1.1. Air Operated
      • 9.1.2. Electrically Operated
    • 9.2. Market Analysis, Insights and Forecast - by Discharge Pressure
      • 9.2.1. Up to 80 bar
      • 9.2.2. Between 80 to 200 bar
      • 9.2.3. Above 200 bar
    • 9.3. Market Analysis, Insights and Forecast - by End-User
      • 9.3.1. Water and Wastewater
      • 9.3.2. Oil and Gas
      • 9.3.3. Chemical and Petrochemical
      • 9.3.4. Pharmaceutical
      • 9.3.5. Food and Beverage
      • 9.3.6. Other End-Users
  10. 10. Middle East and Africa Diaphragm Pump Market Analysis, Insights and Forecast, 2019-2031
    • 10.1. Market Analysis, Insights and Forecast - by Mechanism
      • 10.1.1. Air Operated
      • 10.1.2. Electrically Operated
    • 10.2. Market Analysis, Insights and Forecast - by Discharge Pressure
      • 10.2.1. Up to 80 bar
      • 10.2.2. Between 80 to 200 bar
      • 10.2.3. Above 200 bar
    • 10.3. Market Analysis, Insights and Forecast - by End-User
      • 10.3.1. Water and Wastewater
      • 10.3.2. Oil and Gas
      • 10.3.3. Chemical and Petrochemical
      • 10.3.4. Pharmaceutical
      • 10.3.5. Food and Beverage
      • 10.3.6. Other End-Users
  11. 11. North America Diaphragm Pump Market Analysis, Insights and Forecast, 2019-2031
      • 11.1. Market Analysis, Insights and Forecast - By Country/Sub-region
        • 11.1.1 United States
        • 11.1.2 Canada
        • 11.1.3 Mexico
  12. 12. Europe Diaphragm Pump Market Analysis, Insights and Forecast, 2019-2031
      • 12.1. Market Analysis, Insights and Forecast - By Country/Sub-region
        • 12.1.1 Germany
        • 12.1.2 United Kingdom
        • 12.1.3 France
        • 12.1.4 Spain
        • 12.1.5 Italy
        • 12.1.6 Spain
        • 12.1.7 Belgium
        • 12.1.8 Netherland
        • 12.1.9 Nordics
        • 12.1.10 Rest of Europe
  13. 13. Asia Pacific Diaphragm Pump Market Analysis, Insights and Forecast, 2019-2031
      • 13.1. Market Analysis, Insights and Forecast - By Country/Sub-region
        • 13.1.1 China
        • 13.1.2 Japan
        • 13.1.3 India
        • 13.1.4 South Korea
        • 13.1.5 Southeast Asia
        • 13.1.6 Australia
        • 13.1.7 Indonesia
        • 13.1.8 Phillipes
        • 13.1.9 Singapore
        • 13.1.10 Thailandc
        • 13.1.11 Rest of Asia Pacific
  14. 14. South America Diaphragm Pump Market Analysis, Insights and Forecast, 2019-2031
      • 14.1. Market Analysis, Insights and Forecast - By Country/Sub-region
        • 14.1.1 Brazil
        • 14.1.2 Argentina
        • 14.1.3 Peru
        • 14.1.4 Chile
        • 14.1.5 Colombia
        • 14.1.6 Ecuador
        • 14.1.7 Venezuela
        • 14.1.8 Rest of South America
  15. 15. North America Diaphragm Pump Market Analysis, Insights and Forecast, 2019-2031
      • 15.1. Market Analysis, Insights and Forecast - By Country/Sub-region
        • 15.1.1 United States
        • 15.1.2 Canada
        • 15.1.3 Mexico
  16. 16. MEA Diaphragm Pump Market Analysis, Insights and Forecast, 2019-2031
      • 16.1. Market Analysis, Insights and Forecast - By Country/Sub-region
        • 16.1.1 United Arab Emirates
        • 16.1.2 Saudi Arabia
        • 16.1.3 South Africa
        • 16.1.4 Rest of Middle East and Africa
  17. 17. Competitive Analysis
    • 17.1. Global Market Share Analysis 2024
      • 17.2. Company Profiles
        • 17.2.1 Flowserve Corporation
          • 17.2.1.1. Overview
          • 17.2.1.2. Products
          • 17.2.1.3. SWOT Analysis
          • 17.2.1.4. Recent Developments
          • 17.2.1.5. Financials (Based on Availability)
        • 17.2.2 Tapflo Group
          • 17.2.2.1. Overview
          • 17.2.2.2. Products
          • 17.2.2.3. SWOT Analysis
          • 17.2.2.4. Recent Developments
          • 17.2.2.5. Financials (Based on Availability)
        • 17.2.3 Xylem Inc
          • 17.2.3.1. Overview
          • 17.2.3.2. Products
          • 17.2.3.3. SWOT Analysis
          • 17.2.3.4. Recent Developments
          • 17.2.3.5. Financials (Based on Availability)
        • 17.2.4 Ingersoll-Rand PLC
          • 17.2.4.1. Overview
          • 17.2.4.2. Products
          • 17.2.4.3. SWOT Analysis
          • 17.2.4.4. Recent Developments
          • 17.2.4.5. Financials (Based on Availability)
        • 17.2.5 Verder International B V
          • 17.2.5.1. Overview
          • 17.2.5.2. Products
          • 17.2.5.3. SWOT Analysis
          • 17.2.5.4. Recent Developments
          • 17.2.5.5. Financials (Based on Availability)
        • 17.2.6 Graco Inc
          • 17.2.6.1. Overview
          • 17.2.6.2. Products
          • 17.2.6.3. SWOT Analysis
          • 17.2.6.4. Recent Developments
          • 17.2.6.5. Financials (Based on Availability)
        • 17.2.7 LEWA Group*List Not Exhaustive
          • 17.2.7.1. Overview
          • 17.2.7.2. Products
          • 17.2.7.3. SWOT Analysis
          • 17.2.7.4. Recent Developments
          • 17.2.7.5. Financials (Based on Availability)
        • 17.2.8 Idex Corporation
          • 17.2.8.1. Overview
          • 17.2.8.2. Products
          • 17.2.8.3. SWOT Analysis
          • 17.2.8.4. Recent Developments
          • 17.2.8.5. Financials (Based on Availability)
        • 17.2.9 Dover Corporation
          • 17.2.9.1. Overview
          • 17.2.9.2. Products
          • 17.2.9.3. SWOT Analysis
          • 17.2.9.4. Recent Developments
          • 17.2.9.5. Financials (Based on Availability)
        • 17.2.10 SPX FLOW Inc
          • 17.2.10.1. Overview
          • 17.2.10.2. Products
          • 17.2.10.3. SWOT Analysis
          • 17.2.10.4. Recent Developments
          • 17.2.10.5. Financials (Based on Availability)
        • 17.2.11 Yamada Corporation
          • 17.2.11.1. Overview
          • 17.2.11.2. Products
          • 17.2.11.3. SWOT Analysis
          • 17.2.11.4. Recent Developments
          • 17.2.11.5. Financials (Based on Availability)
        • 17.2.12 Grundfos AS
          • 17.2.12.1. Overview
          • 17.2.12.2. Products
          • 17.2.12.3. SWOT Analysis
          • 17.2.12.4. Recent Developments
          • 17.2.12.5. Financials (Based on Availability)

List of Figures

  1. Figure 1: Global Diaphragm Pump Market Revenue Breakdown (Million, %) by Region 2024 & 2032
  2. Figure 2: Global Diaphragm Pump Market Volume Breakdown (K Tons, %) by Region 2024 & 2032
  3. Figure 3: North America Diaphragm Pump Market Revenue (Million), by Country 2024 & 2032
  4. Figure 4: North America Diaphragm Pump Market Volume (K Tons), by Country 2024 & 2032
  5. Figure 5: North America Diaphragm Pump Market Revenue Share (%), by Country 2024 & 2032
  6. Figure 6: North America Diaphragm Pump Market Volume Share (%), by Country 2024 & 2032
  7. Figure 7: Europe Diaphragm Pump Market Revenue (Million), by Country 2024 & 2032
  8. Figure 8: Europe Diaphragm Pump Market Volume (K Tons), by Country 2024 & 2032
  9. Figure 9: Europe Diaphragm Pump Market Revenue Share (%), by Country 2024 & 2032
  10. Figure 10: Europe Diaphragm Pump Market Volume Share (%), by Country 2024 & 2032
  11. Figure 11: Asia Pacific Diaphragm Pump Market Revenue (Million), by Country 2024 & 2032
  12. Figure 12: Asia Pacific Diaphragm Pump Market Volume (K Tons), by Country 2024 & 2032
  13. Figure 13: Asia Pacific Diaphragm Pump Market Revenue Share (%), by Country 2024 & 2032
  14. Figure 14: Asia Pacific Diaphragm Pump Market Volume Share (%), by Country 2024 & 2032
  15. Figure 15: South America Diaphragm Pump Market Revenue (Million), by Country 2024 & 2032
  16. Figure 16: South America Diaphragm Pump Market Volume (K Tons), by Country 2024 & 2032
  17. Figure 17: South America Diaphragm Pump Market Revenue Share (%), by Country 2024 & 2032
  18. Figure 18: South America Diaphragm Pump Market Volume Share (%), by Country 2024 & 2032
  19. Figure 19: North America Diaphragm Pump Market Revenue (Million), by Country 2024 & 2032
  20. Figure 20: North America Diaphragm Pump Market Volume (K Tons), by Country 2024 & 2032
  21. Figure 21: North America Diaphragm Pump Market Revenue Share (%), by Country 2024 & 2032
  22. Figure 22: North America Diaphragm Pump Market Volume Share (%), by Country 2024 & 2032
  23. Figure 23: MEA Diaphragm Pump Market Revenue (Million), by Country 2024 & 2032
  24. Figure 24: MEA Diaphragm Pump Market Volume (K Tons), by Country 2024 & 2032
  25. Figure 25: MEA Diaphragm Pump Market Revenue Share (%), by Country 2024 & 2032
  26. Figure 26: MEA Diaphragm Pump Market Volume Share (%), by Country 2024 & 2032
  27. Figure 27: North America Diaphragm Pump Market Revenue (Million), by Mechanism 2024 & 2032
  28. Figure 28: North America Diaphragm Pump Market Volume (K Tons), by Mechanism 2024 & 2032
  29. Figure 29: North America Diaphragm Pump Market Revenue Share (%), by Mechanism 2024 & 2032
  30. Figure 30: North America Diaphragm Pump Market Volume Share (%), by Mechanism 2024 & 2032
  31. Figure 31: North America Diaphragm Pump Market Revenue (Million), by Discharge Pressure 2024 & 2032
  32. Figure 32: North America Diaphragm Pump Market Volume (K Tons), by Discharge Pressure 2024 & 2032
  33. Figure 33: North America Diaphragm Pump Market Revenue Share (%), by Discharge Pressure 2024 & 2032
  34. Figure 34: North America Diaphragm Pump Market Volume Share (%), by Discharge Pressure 2024 & 2032
  35. Figure 35: North America Diaphragm Pump Market Revenue (Million), by End-User 2024 & 2032
  36. Figure 36: North America Diaphragm Pump Market Volume (K Tons), by End-User 2024 & 2032
  37. Figure 37: North America Diaphragm Pump Market Revenue Share (%), by End-User 2024 & 2032
  38. Figure 38: North America Diaphragm Pump Market Volume Share (%), by End-User 2024 & 2032
  39. Figure 39: North America Diaphragm Pump Market Revenue (Million), by Country 2024 & 2032
  40. Figure 40: North America Diaphragm Pump Market Volume (K Tons), by Country 2024 & 2032
  41. Figure 41: North America Diaphragm Pump Market Revenue Share (%), by Country 2024 & 2032
  42. Figure 42: North America Diaphragm Pump Market Volume Share (%), by Country 2024 & 2032
  43. Figure 43: Europe Diaphragm Pump Market Revenue (Million), by Mechanism 2024 & 2032
  44. Figure 44: Europe Diaphragm Pump Market Volume (K Tons), by Mechanism 2024 & 2032
  45. Figure 45: Europe Diaphragm Pump Market Revenue Share (%), by Mechanism 2024 & 2032
  46. Figure 46: Europe Diaphragm Pump Market Volume Share (%), by Mechanism 2024 & 2032
  47. Figure 47: Europe Diaphragm Pump Market Revenue (Million), by Discharge Pressure 2024 & 2032
  48. Figure 48: Europe Diaphragm Pump Market Volume (K Tons), by Discharge Pressure 2024 & 2032
  49. Figure 49: Europe Diaphragm Pump Market Revenue Share (%), by Discharge Pressure 2024 & 2032
  50. Figure 50: Europe Diaphragm Pump Market Volume Share (%), by Discharge Pressure 2024 & 2032
  51. Figure 51: Europe Diaphragm Pump Market Revenue (Million), by End-User 2024 & 2032
  52. Figure 52: Europe Diaphragm Pump Market Volume (K Tons), by End-User 2024 & 2032
  53. Figure 53: Europe Diaphragm Pump Market Revenue Share (%), by End-User 2024 & 2032
  54. Figure 54: Europe Diaphragm Pump Market Volume Share (%), by End-User 2024 & 2032
  55. Figure 55: Europe Diaphragm Pump Market Revenue (Million), by Country 2024 & 2032
  56. Figure 56: Europe Diaphragm Pump Market Volume (K Tons), by Country 2024 & 2032
  57. Figure 57: Europe Diaphragm Pump Market Revenue Share (%), by Country 2024 & 2032
  58. Figure 58: Europe Diaphragm Pump Market Volume Share (%), by Country 2024 & 2032
  59. Figure 59: Asia Pacific Diaphragm Pump Market Revenue (Million), by Mechanism 2024 & 2032
  60. Figure 60: Asia Pacific Diaphragm Pump Market Volume (K Tons), by Mechanism 2024 & 2032
  61. Figure 61: Asia Pacific Diaphragm Pump Market Revenue Share (%), by Mechanism 2024 & 2032
  62. Figure 62: Asia Pacific Diaphragm Pump Market Volume Share (%), by Mechanism 2024 & 2032
  63. Figure 63: Asia Pacific Diaphragm Pump Market Revenue (Million), by Discharge Pressure 2024 & 2032
  64. Figure 64: Asia Pacific Diaphragm Pump Market Volume (K Tons), by Discharge Pressure 2024 & 2032
  65. Figure 65: Asia Pacific Diaphragm Pump Market Revenue Share (%), by Discharge Pressure 2024 & 2032
  66. Figure 66: Asia Pacific Diaphragm Pump Market Volume Share (%), by Discharge Pressure 2024 & 2032
  67. Figure 67: Asia Pacific Diaphragm Pump Market Revenue (Million), by End-User 2024 & 2032
  68. Figure 68: Asia Pacific Diaphragm Pump Market Volume (K Tons), by End-User 2024 & 2032
  69. Figure 69: Asia Pacific Diaphragm Pump Market Revenue Share (%), by End-User 2024 & 2032
  70. Figure 70: Asia Pacific Diaphragm Pump Market Volume Share (%), by End-User 2024 & 2032
  71. Figure 71: Asia Pacific Diaphragm Pump Market Revenue (Million), by Country 2024 & 2032
  72. Figure 72: Asia Pacific Diaphragm Pump Market Volume (K Tons), by Country 2024 & 2032
  73. Figure 73: Asia Pacific Diaphragm Pump Market Revenue Share (%), by Country 2024 & 2032
  74. Figure 74: Asia Pacific Diaphragm Pump Market Volume Share (%), by Country 2024 & 2032
  75. Figure 75: South America Diaphragm Pump Market Revenue (Million), by Mechanism 2024 & 2032
  76. Figure 76: South America Diaphragm Pump Market Volume (K Tons), by Mechanism 2024 & 2032
  77. Figure 77: South America Diaphragm Pump Market Revenue Share (%), by Mechanism 2024 & 2032
  78. Figure 78: South America Diaphragm Pump Market Volume Share (%), by Mechanism 2024 & 2032
  79. Figure 79: South America Diaphragm Pump Market Revenue (Million), by Discharge Pressure 2024 & 2032
  80. Figure 80: South America Diaphragm Pump Market Volume (K Tons), by Discharge Pressure 2024 & 2032
  81. Figure 81: South America Diaphragm Pump Market Revenue Share (%), by Discharge Pressure 2024 & 2032
  82. Figure 82: South America Diaphragm Pump Market Volume Share (%), by Discharge Pressure 2024 & 2032
  83. Figure 83: South America Diaphragm Pump Market Revenue (Million), by End-User 2024 & 2032
  84. Figure 84: South America Diaphragm Pump Market Volume (K Tons), by End-User 2024 & 2032
  85. Figure 85: South America Diaphragm Pump Market Revenue Share (%), by End-User 2024 & 2032
  86. Figure 86: South America Diaphragm Pump Market Volume Share (%), by End-User 2024 & 2032
  87. Figure 87: South America Diaphragm Pump Market Revenue (Million), by Country 2024 & 2032
  88. Figure 88: South America Diaphragm Pump Market Volume (K Tons), by Country 2024 & 2032
  89. Figure 89: South America Diaphragm Pump Market Revenue Share (%), by Country 2024 & 2032
  90. Figure 90: South America Diaphragm Pump Market Volume Share (%), by Country 2024 & 2032
  91. Figure 91: Middle East and Africa Diaphragm Pump Market Revenue (Million), by Mechanism 2024 & 2032
  92. Figure 92: Middle East and Africa Diaphragm Pump Market Volume (K Tons), by Mechanism 2024 & 2032
  93. Figure 93: Middle East and Africa Diaphragm Pump Market Revenue Share (%), by Mechanism 2024 & 2032
  94. Figure 94: Middle East and Africa Diaphragm Pump Market Volume Share (%), by Mechanism 2024 & 2032
  95. Figure 95: Middle East and Africa Diaphragm Pump Market Revenue (Million), by Discharge Pressure 2024 & 2032
  96. Figure 96: Middle East and Africa Diaphragm Pump Market Volume (K Tons), by Discharge Pressure 2024 & 2032
  97. Figure 97: Middle East and Africa Diaphragm Pump Market Revenue Share (%), by Discharge Pressure 2024 & 2032
  98. Figure 98: Middle East and Africa Diaphragm Pump Market Volume Share (%), by Discharge Pressure 2024 & 2032
  99. Figure 99: Middle East and Africa Diaphragm Pump Market Revenue (Million), by End-User 2024 & 2032
  100. Figure 100: Middle East and Africa Diaphragm Pump Market Volume (K Tons), by End-User 2024 & 2032
  101. Figure 101: Middle East and Africa Diaphragm Pump Market Revenue Share (%), by End-User 2024 & 2032
  102. Figure 102: Middle East and Africa Diaphragm Pump Market Volume Share (%), by End-User 2024 & 2032
  103. Figure 103: Middle East and Africa Diaphragm Pump Market Revenue (Million), by Country 2024 & 2032
  104. Figure 104: Middle East and Africa Diaphragm Pump Market Volume (K Tons), by Country 2024 & 2032
  105. Figure 105: Middle East and Africa Diaphragm Pump Market Revenue Share (%), by Country 2024 & 2032
  106. Figure 106: Middle East and Africa Diaphragm Pump Market Volume Share (%), by Country 2024 & 2032

List of Tables

  1. Table 1: Global Diaphragm Pump Market Revenue Million Forecast, by Region 2019 & 2032
  2. Table 2: Global Diaphragm Pump Market Volume K Tons Forecast, by Region 2019 & 2032
  3. Table 3: Global Diaphragm Pump Market Revenue Million Forecast, by Mechanism 2019 & 2032
  4. Table 4: Global Diaphragm Pump Market Volume K Tons Forecast, by Mechanism 2019 & 2032
  5. Table 5: Global Diaphragm Pump Market Revenue Million Forecast, by Discharge Pressure 2019 & 2032
  6. Table 6: Global Diaphragm Pump Market Volume K Tons Forecast, by Discharge Pressure 2019 & 2032
  7. Table 7: Global Diaphragm Pump Market Revenue Million Forecast, by End-User 2019 & 2032
  8. Table 8: Global Diaphragm Pump Market Volume K Tons Forecast, by End-User 2019 & 2032
  9. Table 9: Global Diaphragm Pump Market Revenue Million Forecast, by Region 2019 & 2032
  10. Table 10: Global Diaphragm Pump Market Volume K Tons Forecast, by Region 2019 & 2032
  11. Table 11: Global Diaphragm Pump Market Revenue Million Forecast, by Country 2019 & 2032
  12. Table 12: Global Diaphragm Pump Market Volume K Tons Forecast, by Country 2019 & 2032
  13. Table 13: United States Diaphragm Pump Market Revenue (Million) Forecast, by Application 2019 & 2032
  14. Table 14: United States Diaphragm Pump Market Volume (K Tons) Forecast, by Application 2019 & 2032
  15. Table 15: Canada Diaphragm Pump Market Revenue (Million) Forecast, by Application 2019 & 2032
  16. Table 16: Canada Diaphragm Pump Market Volume (K Tons) Forecast, by Application 2019 & 2032
  17. Table 17: Mexico Diaphragm Pump Market Revenue (Million) Forecast, by Application 2019 & 2032
  18. Table 18: Mexico Diaphragm Pump Market Volume (K Tons) Forecast, by Application 2019 & 2032
  19. Table 19: Global Diaphragm Pump Market Revenue Million Forecast, by Country 2019 & 2032
  20. Table 20: Global Diaphragm Pump Market Volume K Tons Forecast, by Country 2019 & 2032
  21. Table 21: Germany Diaphragm Pump Market Revenue (Million) Forecast, by Application 2019 & 2032
  22. Table 22: Germany Diaphragm Pump Market Volume (K Tons) Forecast, by Application 2019 & 2032
  23. Table 23: United Kingdom Diaphragm Pump Market Revenue (Million) Forecast, by Application 2019 & 2032
  24. Table 24: United Kingdom Diaphragm Pump Market Volume (K Tons) Forecast, by Application 2019 & 2032
  25. Table 25: France Diaphragm Pump Market Revenue (Million) Forecast, by Application 2019 & 2032
  26. Table 26: France Diaphragm Pump Market Volume (K Tons) Forecast, by Application 2019 & 2032
  27. Table 27: Spain Diaphragm Pump Market Revenue (Million) Forecast, by Application 2019 & 2032
  28. Table 28: Spain Diaphragm Pump Market Volume (K Tons) Forecast, by Application 2019 & 2032
  29. Table 29: Italy Diaphragm Pump Market Revenue (Million) Forecast, by Application 2019 & 2032
  30. Table 30: Italy Diaphragm Pump Market Volume (K Tons) Forecast, by Application 2019 & 2032
  31. Table 31: Spain Diaphragm Pump Market Revenue (Million) Forecast, by Application 2019 & 2032
  32. Table 32: Spain Diaphragm Pump Market Volume (K Tons) Forecast, by Application 2019 & 2032
  33. Table 33: Belgium Diaphragm Pump Market Revenue (Million) Forecast, by Application 2019 & 2032
  34. Table 34: Belgium Diaphragm Pump Market Volume (K Tons) Forecast, by Application 2019 & 2032
  35. Table 35: Netherland Diaphragm Pump Market Revenue (Million) Forecast, by Application 2019 & 2032
  36. Table 36: Netherland Diaphragm Pump Market Volume (K Tons) Forecast, by Application 2019 & 2032
  37. Table 37: Nordics Diaphragm Pump Market Revenue (Million) Forecast, by Application 2019 & 2032
  38. Table 38: Nordics Diaphragm Pump Market Volume (K Tons) Forecast, by Application 2019 & 2032
  39. Table 39: Rest of Europe Diaphragm Pump Market Revenue (Million) Forecast, by Application 2019 & 2032
  40. Table 40: Rest of Europe Diaphragm Pump Market Volume (K Tons) Forecast, by Application 2019 & 2032
  41. Table 41: Global Diaphragm Pump Market Revenue Million Forecast, by Country 2019 & 2032
  42. Table 42: Global Diaphragm Pump Market Volume K Tons Forecast, by Country 2019 & 2032
  43. Table 43: China Diaphragm Pump Market Revenue (Million) Forecast, by Application 2019 & 2032
  44. Table 44: China Diaphragm Pump Market Volume (K Tons) Forecast, by Application 2019 & 2032
  45. Table 45: Japan Diaphragm Pump Market Revenue (Million) Forecast, by Application 2019 & 2032
  46. Table 46: Japan Diaphragm Pump Market Volume (K Tons) Forecast, by Application 2019 & 2032
  47. Table 47: India Diaphragm Pump Market Revenue (Million) Forecast, by Application 2019 & 2032
  48. Table 48: India Diaphragm Pump Market Volume (K Tons) Forecast, by Application 2019 & 2032
  49. Table 49: South Korea Diaphragm Pump Market Revenue (Million) Forecast, by Application 2019 & 2032
  50. Table 50: South Korea Diaphragm Pump Market Volume (K Tons) Forecast, by Application 2019 & 2032
  51. Table 51: Southeast Asia Diaphragm Pump Market Revenue (Million) Forecast, by Application 2019 & 2032
  52. Table 52: Southeast Asia Diaphragm Pump Market Volume (K Tons) Forecast, by Application 2019 & 2032
  53. Table 53: Australia Diaphragm Pump Market Revenue (Million) Forecast, by Application 2019 & 2032
  54. Table 54: Australia Diaphragm Pump Market Volume (K Tons) Forecast, by Application 2019 & 2032
  55. Table 55: Indonesia Diaphragm Pump Market Revenue (Million) Forecast, by Application 2019 & 2032
  56. Table 56: Indonesia Diaphragm Pump Market Volume (K Tons) Forecast, by Application 2019 & 2032
  57. Table 57: Phillipes Diaphragm Pump Market Revenue (Million) Forecast, by Application 2019 & 2032
  58. Table 58: Phillipes Diaphragm Pump Market Volume (K Tons) Forecast, by Application 2019 & 2032
  59. Table 59: Singapore Diaphragm Pump Market Revenue (Million) Forecast, by Application 2019 & 2032
  60. Table 60: Singapore Diaphragm Pump Market Volume (K Tons) Forecast, by Application 2019 & 2032
  61. Table 61: Thailandc Diaphragm Pump Market Revenue (Million) Forecast, by Application 2019 & 2032
  62. Table 62: Thailandc Diaphragm Pump Market Volume (K Tons) Forecast, by Application 2019 & 2032
  63. Table 63: Rest of Asia Pacific Diaphragm Pump Market Revenue (Million) Forecast, by Application 2019 & 2032
  64. Table 64: Rest of Asia Pacific Diaphragm Pump Market Volume (K Tons) Forecast, by Application 2019 & 2032
  65. Table 65: Global Diaphragm Pump Market Revenue Million Forecast, by Country 2019 & 2032
  66. Table 66: Global Diaphragm Pump Market Volume K Tons Forecast, by Country 2019 & 2032
  67. Table 67: Brazil Diaphragm Pump Market Revenue (Million) Forecast, by Application 2019 & 2032
  68. Table 68: Brazil Diaphragm Pump Market Volume (K Tons) Forecast, by Application 2019 & 2032
  69. Table 69: Argentina Diaphragm Pump Market Revenue (Million) Forecast, by Application 2019 & 2032
  70. Table 70: Argentina Diaphragm Pump Market Volume (K Tons) Forecast, by Application 2019 & 2032
  71. Table 71: Peru Diaphragm Pump Market Revenue (Million) Forecast, by Application 2019 & 2032
  72. Table 72: Peru Diaphragm Pump Market Volume (K Tons) Forecast, by Application 2019 & 2032
  73. Table 73: Chile Diaphragm Pump Market Revenue (Million) Forecast, by Application 2019 & 2032
  74. Table 74: Chile Diaphragm Pump Market Volume (K Tons) Forecast, by Application 2019 & 2032
  75. Table 75: Colombia Diaphragm Pump Market Revenue (Million) Forecast, by Application 2019 & 2032
  76. Table 76: Colombia Diaphragm Pump Market Volume (K Tons) Forecast, by Application 2019 & 2032
  77. Table 77: Ecuador Diaphragm Pump Market Revenue (Million) Forecast, by Application 2019 & 2032
  78. Table 78: Ecuador Diaphragm Pump Market Volume (K Tons) Forecast, by Application 2019 & 2032
  79. Table 79: Venezuela Diaphragm Pump Market Revenue (Million) Forecast, by Application 2019 & 2032
  80. Table 80: Venezuela Diaphragm Pump Market Volume (K Tons) Forecast, by Application 2019 & 2032
  81. Table 81: Rest of South America Diaphragm Pump Market Revenue (Million) Forecast, by Application 2019 & 2032
  82. Table 82: Rest of South America Diaphragm Pump Market Volume (K Tons) Forecast, by Application 2019 & 2032
  83. Table 83: Global Diaphragm Pump Market Revenue Million Forecast, by Country 2019 & 2032
  84. Table 84: Global Diaphragm Pump Market Volume K Tons Forecast, by Country 2019 & 2032
  85. Table 85: United States Diaphragm Pump Market Revenue (Million) Forecast, by Application 2019 & 2032
  86. Table 86: United States Diaphragm Pump Market Volume (K Tons) Forecast, by Application 2019 & 2032
  87. Table 87: Canada Diaphragm Pump Market Revenue (Million) Forecast, by Application 2019 & 2032
  88. Table 88: Canada Diaphragm Pump Market Volume (K Tons) Forecast, by Application 2019 & 2032
  89. Table 89: Mexico Diaphragm Pump Market Revenue (Million) Forecast, by Application 2019 & 2032
  90. Table 90: Mexico Diaphragm Pump Market Volume (K Tons) Forecast, by Application 2019 & 2032
  91. Table 91: Global Diaphragm Pump Market Revenue Million Forecast, by Country 2019 & 2032
  92. Table 92: Global Diaphragm Pump Market Volume K Tons Forecast, by Country 2019 & 2032
  93. Table 93: United Arab Emirates Diaphragm Pump Market Revenue (Million) Forecast, by Application 2019 & 2032
  94. Table 94: United Arab Emirates Diaphragm Pump Market Volume (K Tons) Forecast, by Application 2019 & 2032
  95. Table 95: Saudi Arabia Diaphragm Pump Market Revenue (Million) Forecast, by Application 2019 & 2032
  96. Table 96: Saudi Arabia Diaphragm Pump Market Volume (K Tons) Forecast, by Application 2019 & 2032
  97. Table 97: South Africa Diaphragm Pump Market Revenue (Million) Forecast, by Application 2019 & 2032
  98. Table 98: South Africa Diaphragm Pump Market Volume (K Tons) Forecast, by Application 2019 & 2032
  99. Table 99: Rest of Middle East and Africa Diaphragm Pump Market Revenue (Million) Forecast, by Application 2019 & 2032
  100. Table 100: Rest of Middle East and Africa Diaphragm Pump Market Volume (K Tons) Forecast, by Application 2019 & 2032
  101. Table 101: Global Diaphragm Pump Market Revenue Million Forecast, by Mechanism 2019 & 2032
  102. Table 102: Global Diaphragm Pump Market Volume K Tons Forecast, by Mechanism 2019 & 2032
  103. Table 103: Global Diaphragm Pump Market Revenue Million Forecast, by Discharge Pressure 2019 & 2032
  104. Table 104: Global Diaphragm Pump Market Volume K Tons Forecast, by Discharge Pressure 2019 & 2032
  105. Table 105: Global Diaphragm Pump Market Revenue Million Forecast, by End-User 2019 & 2032
  106. Table 106: Global Diaphragm Pump Market Volume K Tons Forecast, by End-User 2019 & 2032
  107. Table 107: Global Diaphragm Pump Market Revenue Million Forecast, by Country 2019 & 2032
  108. Table 108: Global Diaphragm Pump Market Volume K Tons Forecast, by Country 2019 & 2032
  109. Table 109: Global Diaphragm Pump Market Revenue Million Forecast, by Mechanism 2019 & 2032
  110. Table 110: Global Diaphragm Pump Market Volume K Tons Forecast, by Mechanism 2019 & 2032
  111. Table 111: Global Diaphragm Pump Market Revenue Million Forecast, by Discharge Pressure 2019 & 2032
  112. Table 112: Global Diaphragm Pump Market Volume K Tons Forecast, by Discharge Pressure 2019 & 2032
  113. Table 113: Global Diaphragm Pump Market Revenue Million Forecast, by End-User 2019 & 2032
  114. Table 114: Global Diaphragm Pump Market Volume K Tons Forecast, by End-User 2019 & 2032
  115. Table 115: Global Diaphragm Pump Market Revenue Million Forecast, by Country 2019 & 2032
  116. Table 116: Global Diaphragm Pump Market Volume K Tons Forecast, by Country 2019 & 2032
  117. Table 117: Global Diaphragm Pump Market Revenue Million Forecast, by Mechanism 2019 & 2032
  118. Table 118: Global Diaphragm Pump Market Volume K Tons Forecast, by Mechanism 2019 & 2032
  119. Table 119: Global Diaphragm Pump Market Revenue Million Forecast, by Discharge Pressure 2019 & 2032
  120. Table 120: Global Diaphragm Pump Market Volume K Tons Forecast, by Discharge Pressure 2019 & 2032
  121. Table 121: Global Diaphragm Pump Market Revenue Million Forecast, by End-User 2019 & 2032
  122. Table 122: Global Diaphragm Pump Market Volume K Tons Forecast, by End-User 2019 & 2032
  123. Table 123: Global Diaphragm Pump Market Revenue Million Forecast, by Country 2019 & 2032
  124. Table 124: Global Diaphragm Pump Market Volume K Tons Forecast, by Country 2019 & 2032
  125. Table 125: Global Diaphragm Pump Market Revenue Million Forecast, by Mechanism 2019 & 2032
  126. Table 126: Global Diaphragm Pump Market Volume K Tons Forecast, by Mechanism 2019 & 2032
  127. Table 127: Global Diaphragm Pump Market Revenue Million Forecast, by Discharge Pressure 2019 & 2032
  128. Table 128: Global Diaphragm Pump Market Volume K Tons Forecast, by Discharge Pressure 2019 & 2032
  129. Table 129: Global Diaphragm Pump Market Revenue Million Forecast, by End-User 2019 & 2032
  130. Table 130: Global Diaphragm Pump Market Volume K Tons Forecast, by End-User 2019 & 2032
  131. Table 131: Global Diaphragm Pump Market Revenue Million Forecast, by Country 2019 & 2032
  132. Table 132: Global Diaphragm Pump Market Volume K Tons Forecast, by Country 2019 & 2032
  133. Table 133: Global Diaphragm Pump Market Revenue Million Forecast, by Mechanism 2019 & 2032
  134. Table 134: Global Diaphragm Pump Market Volume K Tons Forecast, by Mechanism 2019 & 2032
  135. Table 135: Global Diaphragm Pump Market Revenue Million Forecast, by Discharge Pressure 2019 & 2032
  136. Table 136: Global Diaphragm Pump Market Volume K Tons Forecast, by Discharge Pressure 2019 & 2032
  137. Table 137: Global Diaphragm Pump Market Revenue Million Forecast, by End-User 2019 & 2032
  138. Table 138: Global Diaphragm Pump Market Volume K Tons Forecast, by End-User 2019 & 2032
  139. Table 139: Global Diaphragm Pump Market Revenue Million Forecast, by Country 2019 & 2032
  140. Table 140: Global Diaphragm Pump Market Volume K Tons Forecast, by Country 2019 & 2032


Frequently Asked Questions

1. What is the projected Compound Annual Growth Rate (CAGR) of the Diaphragm Pump Market?

The projected CAGR is approximately > 6.10%.

2. Which companies are prominent players in the Diaphragm Pump Market?

Key companies in the market include Flowserve Corporation, Tapflo Group, Xylem Inc, Ingersoll-Rand PLC, Verder International B V, Graco Inc, LEWA Group*List Not Exhaustive, Idex Corporation, Dover Corporation, SPX FLOW Inc, Yamada Corporation, Grundfos AS.

3. What are the main segments of the Diaphragm Pump Market?

The market segments include Mechanism, Discharge Pressure, End-User.

4. Can you provide details about the market size?

The market size is estimated to be USD 6090 Million as of 2022.

5. What are some drivers contributing to market growth?

4.; Declining Costs of Solar Technologies4.; Demand for Decentralized Solar Energy Systems.

6. What are the notable trends driving market growth?

Water and Wastewater Sector to Dominate the Market.

7. Are there any restraints impacting market growth?

4.; Absence of Any New Initiatives in the Country.

8. Can you provide examples of recent developments in the market?

In August 2021, Graco Inc. announced the launch of its new Husky 3300e electric double diaphragm pump. The Husky 3300e pump transfers industrial fluids and offers plant managers high-volume fluid transfer (up 220 gpm) and drastically reduces power consumption.

9. What pricing options are available for accessing the report?

Pricing options include single-user, multi-user, and enterprise licenses priced at USD 4750, USD 5250, and USD 8750 respectively.

10. Is the market size provided in terms of value or volume?

The market size is provided in terms of value, measured in Million and volume, measured in K Tons.

11. Are there any specific market keywords associated with the report?

Yes, the market keyword associated with the report is "Diaphragm Pump Market," which aids in identifying and referencing the specific market segment covered.

12. How do I determine which pricing option suits my needs best?

The pricing options vary based on user requirements and access needs. Individual users may opt for single-user licenses, while businesses requiring broader access may choose multi-user or enterprise licenses for cost-effective access to the report.

13. Are there any additional resources or data provided in the Diaphragm Pump Market report?

While the report offers comprehensive insights, it's advisable to review the specific contents or supplementary materials provided to ascertain if additional resources or data are available.

14. How can I stay updated on further developments or reports in the Diaphragm Pump Market?

To stay informed about further developments, trends, and reports in the Diaphragm Pump Market, consider subscribing to industry newsletters, following relevant companies and organizations, or regularly checking reputable industry news sources and publications.


Methodology

Step 1 - Identification of Relevant Samples Size from Population Database

Step Chart
Bar Chart
Method Chart

Step 2 - Approaches for Defining Global Market Size (Value, Volume* & Price*)

Approach Chart
Top-down and bottom-up approaches are used to validate the global market size and estimate the market size for manufactures, regional segments, product, and application.

Note*: In applicable scenarios

Step 3 - Data Sources

Primary Research

  • Web Analytics
  • Survey Reports
  • Research Institute
  • Latest Research Reports
  • Opinion Leaders

Secondary Research

  • Annual Reports
  • White Paper
  • Latest Press Release
  • Industry Association
  • Paid Database
  • Investor Presentations
Analyst Chart

Step 4 - Data Triangulation

Involves using different sources of information in order to increase the validity of a study

These sources are likely to be stakeholders in a program - participants, other researchers, program staff, other community members, and so on.

Then we put all data in single framework & apply various statistical tools to find out the dynamic on the market.

During the analysis stage, feedback from the stakeholder groups would be compared to determine areas of agreement as well as areas of divergence

Additionally, after gathering mixed and scattered data from a wide range of sources, data is triangulated and correlated to come up with estimated figures which are further validated through primary mediums or industry experts, opinion leaders.

About Visionary Data Reports

Visionary Data Reports provides future-focused market research, advanced analytics, and strategic insights for technology, healthcare, green energy, and finance. Our reports help you anticipate trends, innovate, and lead in your industry. Our expert team combines primary research, data science, and industry knowledge to deliver actionable intelligence. We offer syndicated reports, custom analytics, and consulting services tailored to your business needs. At Visionary Data Reports, we are committed to quality, transparency, and client satisfaction. Every report is rigorously validated to ensure accuracy and relevance. Our global perspective and forward-thinking approach help you understand both current and emerging market dynamics.

Stay ahead with Visionary Data Reports. Subscribe to our newsletter for the latest insights and research highlights, and follow us on social media for real-time updates. Visionary Data Reports – Your Guide to Tomorrow’s Opportunities.

artwork spiralartwork spiralRelated Reports
artwork underline

Strategizing Growth: Asia Pacific Liquid Hydrogen Market Market’s Decade Ahead 2025-2033

The Asia-Pacific liquid hydrogen market is booming, projected to reach [Value from chart_data for 2033] million by 2033, driven by automotive, chemical, and aerospace sectors. Explore key trends, drivers, restraints, and leading companies in this rapidly expanding market.

August 2025
Base Year: 2024
No Of Pages: 234
Price: $4750

Energy Storage in United Kingdom Market Market Dynamics: Drivers and Barriers to Growth 2025-2033

Discover the booming UK energy storage market! This in-depth analysis reveals key trends, growth drivers, market size projections (2025-2033), leading companies, and regional insights. Learn about battery storage, pumped hydro, and other technologies shaping the UK's energy future.

August 2025
Base Year: 2024
No Of Pages: 197
Price: $3800

South America Intelligent Pigging Market Market’s Evolution: Key Growth Drivers 2025-2033

Discover the booming South American intelligent pigging market! This in-depth analysis reveals a CAGR exceeding 4%, driven by aging pipelines and stringent safety regulations. Learn about market trends, key players (Baker Hughes, Rosen Group), and future growth projections for oil & gas pipeline inspection.

August 2025
Base Year: 2024
No Of Pages: 234
Price: $4750

Solar Energy Market in Romania 2025-2033: Preparing for Growth and Change

Discover the booming Romanian solar energy market! This in-depth analysis reveals a CAGR of 18.50%, driven by government incentives, falling costs, and growing demand. Explore market size, key segments (residential, commercial, utility-scale), leading companies, and future trends until 2033.

August 2025
Base Year: 2024
No Of Pages: 197
Price: $3800

Oman Oil and Gas Pipeline Market Unlocking Growth Potential: 2025-2033 Analysis and Forecasts

Discover the booming Oman oil and gas pipeline market, projected to exceed $2.57 billion by 2033. Explore market drivers, trends, and key players shaping this dynamic sector's future. Learn about onshore vs. offshore segments, crude oil vs. gas pipelines, and investment opportunities in this high-growth region.

August 2025
Base Year: 2024
No Of Pages: 197
Price: $3800

Wind Turbine Refurbishment Industry Market Demand and Consumption Trends: Outlook 2025-2033

Booming wind turbine refurbishment market analysis reveals a CAGR exceeding 3.53%, driven by aging infrastructure and cost-effective maintenance. Explore key trends, regional insights, and leading companies shaping this multi-billion dollar industry's future in our comprehensive report.

August 2025
Base Year: 2024
No Of Pages: 234
Price: $4750

Power Quality Meter Industry Growth Forecast and Consumer Insights

Discover the booming power quality meter market! This comprehensive analysis reveals a CAGR of 7.40% through 2033, driven by industrial automation and renewable energy. Explore key players, regional trends, and market segmentation for informed business decisions.

August 2025
Base Year: 2024
No Of Pages: 234
Price: $4750

North America Distribution Transformer Industry Market Drivers and Challenges: Trends 2025-2033

The North American distribution transformer market is booming, projected to reach \$[insert projected 2033 value based on chart data] billion by 2033, driven by grid modernization, renewable energy integration, and smart grid technologies. Discover key trends, market segmentation, and leading players in this dynamic industry.

August 2025
Base Year: 2024
No Of Pages: 234
Price: $4750

France Nuclear Power Reactor Decommissioning Market Trends and Forecast 2025-2033

The France Nuclear Power Reactor Decommissioning market is experiencing robust growth (CAGR >4%), driven by aging reactors and stringent regulations. Explore market size, trends, key players (Orano SA, EDF), and future projections (2025-2033) in this comprehensive analysis.

August 2025
Base Year: 2024
No Of Pages: 197
Price: $3800

Brazil Oil and Gas Downstream Market Consumer Behavior Dynamics: Key Trends 2025-2033

Discover the booming Brazil oil and gas downstream market! Our in-depth analysis reveals a CAGR exceeding 5.13% through 2033, driven by automotive growth and biofuel initiatives. Explore market size, key players (Petrobras, Shell, ExxonMobil), and regional trends. Invest wisely in this dynamic sector.

August 2025
Base Year: 2024
No Of Pages: 197
Price: $3800

Japan Nuclear Power Reactor Decommissioning Market Analysis Uncovered: Market Drivers and Forecasts 2025-2033

Discover the booming Japan Nuclear Power Reactor Decommissioning market. Explore market size, CAGR, key drivers, trends, and challenges impacting this $1.5B+ sector, with insights into leading companies and regional analysis (2019-2033).

August 2025
Base Year: 2024
No Of Pages: 197
Price: $3800

North America Artificial Lift Systems Market Market’s Evolution: Key Growth Drivers 2025-2033

The North American Artificial Lift Systems market is booming, projected to exceed $3.8 billion by 2033, driven by surging oil & gas production and technological advancements in ESPs, PCPs, and gas lift systems. Learn about key market trends, leading companies, and regional insights in this comprehensive analysis.

August 2025
Base Year: 2024
No Of Pages: 234
Price: $4750

North America AI-Powered Energy Storage Market Unlocking Growth Potential: Analysis and Forecasts 2025-2033

Discover the explosive growth of the North American AI-powered energy storage market. This in-depth analysis reveals a CAGR of 46.35%, driven by renewable energy adoption, AI optimization, and key players like Tesla and BYD. Explore market trends, segmentation, and future projections for 2025-2033.

August 2025
Base Year: 2024
No Of Pages: 234
Price: $4750

Navigating India Petrol Station Market Market Trends: Competitor Analysis and Growth 2025-2033

Discover the booming India petrol station market! This comprehensive analysis reveals a ₹250 billion (USD 30 billion) market growing at a CAGR exceeding 5% until 2033, driven by rising vehicle ownership and economic growth. Learn about key players, regional trends, and future projections.

August 2025
Base Year: 2024
No Of Pages: 197
Price: $3800

France Wind Energy Market Growth Opportunities: Market Size Forecast to 2033

Discover the booming France wind energy market forecast to 2033! This in-depth analysis reveals a CAGR of 7.43%, driven by government initiatives and technological advancements. Explore key players, market segments (onshore & offshore), and growth challenges.

August 2025
Base Year: 2024
No Of Pages: 197
Price: $3800

APAC Offshore Support Market CAGR Trends: Growth Outlook 2025-2033

Discover the booming APAC offshore support vessel market, projected to exceed a massive valuation by 2033. Explore key drivers like renewable energy growth, regional economic expansion, and leading companies shaping this dynamic sector. Analyze market trends and future forecasts in this in-depth analysis.

August 2025
Base Year: 2024
No Of Pages: 234
Price: $4750

East Asia Battery Market Market’s Tech Revolution: Projections to 2033

Discover the explosive growth of the East Asia battery market! This comprehensive analysis reveals key trends, driving forces, and leading players shaping the future of EV, energy storage, and data center technologies in China, Japan, South Korea and beyond. Project your market strategies with our insightful forecast through 2033.

August 2025
Base Year: 2024
No Of Pages: 234
Price: $4750

Drill Pipe Industry Report Probes the XXX Million Size, Share, Growth Report and Future Analysis by 2033

Discover the booming drill pipe market! Explore its $XX million valuation, 4.5%+ CAGR, key drivers, regional insights (North America, Europe, Asia-Pacific), top players (NOV, TMK, Tenaris), and future trends in this comprehensive market analysis covering 2019-2033. Learn about onshore vs. offshore deployment and the impact of technological advancements.

August 2025
Base Year: 2024
No Of Pages: 234
Price: $4750

Renewable Energy Market in Germany Market Disruption: Competitor Insights and Trends 2025-2033

Discover the booming German renewable energy market! This in-depth analysis reveals a €5 billion (2025 estimate) market with a 7.27% CAGR, driven by strong government policies and technological advancements. Explore key players, regional trends, and growth projections for solar, wind, hydro, and bioenergy sectors until 2033.

August 2025
Base Year: 2024
No Of Pages: 197
Price: $3800

MEA Power Rental Industry Report Probes the XXX Million Size, Share, Growth Report and Future Analysis by 2033

Discover the booming MEA power rental market! Our analysis reveals a CAGR exceeding 9.68%, driven by infrastructure growth & energy demands. Explore key trends, segments (prime power, peak shaving, emergency standby), and leading companies shaping this dynamic industry. Learn more about market size, regional breakdown, and future projections.

August 2025
Base Year: 2024
No Of Pages: 234
Price: $4750

Thailand Oil and Gas Industry Market Report: Strategic Insights

Discover the future of Thailand's oil and gas industry. This in-depth market analysis reveals a steady growth trajectory (CAGR 2.33%), driven by industrial and transportation demands, while outlining challenges such as price volatility and the global shift towards renewables. Learn about key players, market segmentation, and regional trends.

August 2025
Base Year: 2024
No Of Pages: 197
Price: $3800

LNG as a Fuel Industry Strategic Insights: Analysis 2025 and Forecasts 2033

Discover the booming LNG as fuel market! This comprehensive analysis reveals key trends, drivers, and restraints, projecting a CAGR >8% through 2033. Explore regional market shares, leading companies, and the future of LNG in transportation and power generation.

August 2025
Base Year: 2024
No Of Pages: 234
Price: $4750

Exploring Opportunities in North Sea Offshore Helicopter Services Market Sector

Discover the booming North Sea Offshore Helicopter Services market. This in-depth analysis reveals key trends, growth drivers (offshore wind, oil & gas), and challenges for 2025-2033, including regional market share and leading companies like Airbus and Bristow. Explore market size, CAGR, and future projections for this vital sector.

August 2025
Base Year: 2024
No Of Pages: 234
Price: $4750

Polymer Photovoltaic Cell Market Market Expansion: Growth Outlook 2025-2033

The Polymer Photovoltaic Cell market is booming, with a projected CAGR of 21.40% to 2033. Discover key trends, drivers, and restraints shaping this dynamic sector, including insights into organic vs. inorganic materials, flexible vs. rigid form factors, and leading companies. Explore regional market shares and growth projections.

August 2025
Base Year: 2024
No Of Pages: 234
Price: $4750

Future Forecasts for Chile Renewable Energy Industry Industry Growth

Discover the booming Chilean renewable energy market! Explore its 9%+ CAGR, key drivers, leading companies (JinkoSolar, First Solar, Vestas), and segment analysis (solar, wind, hydro). Learn about market forecasts and investment opportunities in this rapidly expanding sector.

August 2025
Base Year: 2024
No Of Pages: 197
Price: $3800

North West Europe Diesel Generator Market Future-proof Strategies: Trends, Competitor Dynamics, and Opportunities 2025-2033

The North West Europe diesel generator market is booming, driven by industrial growth and the need for reliable backup power. Discover key trends, market size projections (2025-2033), leading companies, and regional breakdowns in this comprehensive market analysis. Explore growth drivers, restraints, and segment analysis (capacity, end-user, application) for this dynamic sector.

August 2025
Base Year: 2024
No Of Pages: 234
Price: $4750

Open Hole Logging Services Market Market Dynamics: Drivers and Barriers to Growth 2025-2033

The Open Hole Logging Services market is booming, projected to exceed $XX million by 2033 with a CAGR above 2%. Driven by technological advancements and rising demand for efficient subsurface data acquisition, this report analyzes market trends, key players (Schlumberger, Baker Hughes, Halliburton), regional growth, and future projections. Learn more about this lucrative sector.

August 2025
Base Year: 2024
No Of Pages: 234
Price: $4750

Strategic Analysis of United States Turbine Control Systems Market Industry Opportunities

Discover the booming US Turbine Control Systems market! This in-depth analysis reveals a CAGR exceeding 3.59%, driven by renewable energy integration and smart grid technologies. Learn about key players, market segments, and future growth projections for 2025-2033.

August 2025
Base Year: 2024
No Of Pages: 197
Price: $3800

Europe High Voltage Switchgear Market Industry’s Growth Dynamics and Insights

The European High Voltage Switchgear Market is booming, projected to reach €7.24 billion by 2033 with a CAGR of 8.71%. Driven by renewable energy integration and grid modernization, this market analysis reveals key trends, leading players (ABB, Siemens, Hitachi), and regional breakdowns. Learn more about this high-growth sector.

August 2025
Base Year: 2024
No Of Pages: 234
Price: $4750

UAE Power Market Growth Pathways: Strategic Analysis and Forecasts 2025-2033

Discover the booming UAE power market forecast to 2033! This comprehensive analysis reveals a CAGR of 4.20%, driven by renewable energy investments, economic diversification, and key players like DEWA and TAQA. Explore market size, segmentation, and future trends.

August 2025
Base Year: 2024
No Of Pages: 197
Price: $3800

United Arab Emirates Solar Photovoltaic (PV) Market Projected to Grow at XX CAGR: Insights and Forecasts 2025-2033

Discover the booming UAE solar PV market! Our analysis reveals impressive growth projections exceeding 12% CAGR, driven by government initiatives and rising sustainability concerns. Explore market size, segmentation, key players, and future trends in this in-depth report.

August 2025
Base Year: 2024
No Of Pages: 197
Price: $3800

Understanding Canada Waste to Energy Market Trends and Growth Dynamics

Discover the booming Canadian waste-to-energy market. This comprehensive analysis reveals key trends, technologies (incineration, gasification, pyrolysis), regional growth projections (Eastern, Western, Central Canada), and top companies driving innovation from 2025-2033. Learn about the market size, CAGR, and investment opportunities.

August 2025
Base Year: 2024
No Of Pages: 197
Price: $3800

Electricity Market in Spain Growth Opportunities and Market Forecast 2025-2033: A Strategic Analysis

Discover the booming Spanish electricity market! This in-depth analysis reveals a CAGR of 12.89%, driven by renewable energy adoption and surging demand. Learn about key players, market segments, and future growth projections to 2033. Explore the opportunities and challenges facing this dynamic sector.

August 2025
Base Year: 2024
No Of Pages: 197
Price: $3800

Europe Low Voltage Switchgear Market Charting Growth Trajectories: Analysis and Forecasts 2025-2033

The European low-voltage switchgear market is booming, driven by smart grid modernization, renewable energy integration, and industrial automation. Discover key market trends, growth projections (CAGR >6%), major players (ABB, Siemens, Schneider Electric), and regional insights in our comprehensive analysis.

August 2025
Base Year: 2024
No Of Pages: 234
Price: $4750

North America Gas Insulated Switchgear Market Report: Trends and Forecasts 2025-2033

The North American Gas Insulated Switchgear (GIS) market is booming, with a CAGR exceeding 6%! This comprehensive analysis explores market size, key drivers (renewable energy, smart grids), trends, restraints, and leading companies like Siemens, Schneider Electric, and GE. Discover growth projections to 2033 and regional breakdowns.

August 2025
Base Year: 2024
No Of Pages: 197
Price: $3800

Europe Solar PV Inverters Market Unlocking Growth Potential: Analysis and Forecasts 2025-2033

The European solar PV inverter market is booming, with a CAGR exceeding 6%! Discover key trends, growth drivers, leading companies, and regional insights in this comprehensive market analysis covering residential, commercial, and utility-scale applications. Learn about the rise of microinverters and the future of solar energy in Europe.

August 2025
Base Year: 2024
No Of Pages: 234
Price: $4750

China Bunker Fuel Market Market Demand Dynamics: Insights 2025-2033

Discover the booming China bunker fuel market forecast to 2033! This comprehensive analysis reveals market size, CAGR, key drivers (maritime trade, environmental regulations), restraints (oil price volatility, economic fluctuations), and leading companies. Explore market segmentation by fuel type (HSFO, VLSFO, MGO) and vessel type.

August 2025
Base Year: 2024
No Of Pages: 197
Price: $3800

United Kingdom Midstream Oil and Gas Software Industry XX CAGR Growth to Drive Market Size to XXX Million by 2033

Discover the booming UK midstream oil & gas software market! Our analysis reveals a projected £500 million market by 2033, driven by digitalization and regulatory compliance. Learn about market size, growth trends, and key drivers shaping this dynamic sector.

August 2025
Base Year: 2024
No Of Pages: 197
Price: $3800

China Electric Vehicle Battery Materials Market Future Forecasts: Insights and Trends to 2033

China's electric vehicle battery materials market is booming, projected to reach $37.85 billion by 2033, driven by soaring EV sales and government support. Learn about key market trends, leading companies like CATL and BYD, and the challenges facing this rapidly expanding sector.

August 2025
Base Year: 2024
No Of Pages: 197
Price: $3800

MEA Combined Heat & Power Industry Comprehensive Market Study: Trends and Predictions 2025-2033

The MEA Combined Heat & Power (CHP) market is booming, projected to exceed a 5.10% CAGR through 2033. Driven by industrialization, government policies, and rising energy costs, this market offers significant opportunities across the UAE, Saudi Arabia, and South Africa. Discover key trends, regional breakdowns, and leading companies shaping this dynamic sector.

August 2025
Base Year: 2024
No Of Pages: 234
Price: $4750

Market Deep Dive: Exploring North America Drilling Market Trends 2025-2033

Discover the booming North American microgrid market! This in-depth analysis reveals key trends, drivers, and restraints impacting the growth of custom microgrids, remote power systems, and more, with a focus on institutional, commercial, and off-grid applications. Explore market size projections, leading companies, and regional insights through 2033.

August 2025
Base Year: 2024
No Of Pages: 234
Price: $4750

Malaysia Refined Petroleum Products Market 2025-2033 Analysis: Trends, Competitor Dynamics, and Growth Opportunities

Discover the booming Malaysia Refined Petroleum Products Market, projected to reach \$24 billion by 2033 with a 5.9% CAGR. This in-depth analysis covers market drivers, trends, restraints, key players (Petronas, Shell, Chevron), and regional insights. Learn how transportation, industrial, and power generation fuel demand shapes this dynamic market.

August 2025
Base Year: 2024
No Of Pages: 197
Price: $3800

North America Industrial Centrifuge Market Unlocking Growth Potential: Analysis and Forecasts 2025-2033

Discover the booming North America industrial centrifuge market! This comprehensive analysis reveals key trends, growth drivers (food & beverage, pharma, wastewater), leading companies (GEA, Alfa Laval, Flottweg), and projected market size to 2033. Learn about segmentation by operation mode, industry, and design.

August 2025
Base Year: 2024
No Of Pages: 234
Price: $4750

US Natural Gas Market Soars to XXX Million, witnessing a CAGR of XX during the forecast period 2025-2033

The US natural gas market is booming, projected to exceed a CAGR of 5% through 2033. This comprehensive analysis explores market drivers, trends, restraints, key players (Occidental Petroleum, Shell, ExxonMobil, etc.), and regional breakdowns (Northeast, Southeast, etc.), providing insights for investors and industry professionals. Discover future growth projections and understand the evolving landscape of this vital energy sector.

August 2025
Base Year: 2024
No Of Pages: 197
Price: $3800

Strategic Growth Drivers for Europe Advanced Biofuel Market Market

Discover the booming Europe advanced biofuel market! This in-depth analysis reveals key trends, drivers, and restraints shaping this dynamic sector, including leading companies, regional growth forecasts, and market size projections through 2033. Learn about the impact of sustainable transportation policies and technological advancements on the future of biofuels in Europe.

August 2025
Base Year: 2024
No Of Pages: 234
Price: $4750

Exploring Key Trends in Top Drive Drilling Industry Market

The Top Drive Drilling market is booming, with a CAGR exceeding 4.5%! This comprehensive analysis explores market size, key players (Aker Solutions, CNPC, Nabors Industries), regional trends (North America, Asia Pacific), and future growth projections for electric and hydraulic top drives in onshore and offshore drilling. Discover the latest insights and forecasts for 2025-2033.

August 2025
Base Year: 2024
No Of Pages: 234
Price: $4750

Power Plant Control System Market Market’s Consumer Insights and Trends

The Power Plant Control System market is booming, projected to reach $XX million by 2033, driven by renewable energy adoption, aging infrastructure upgrades, and smart grid integration. Learn about key market trends, leading companies (Rockwell Automation, Honeywell, ABB), and regional growth forecasts in this comprehensive analysis.

August 2025
Base Year: 2024
No Of Pages: 234
Price: $4750

Unlocking the Future of Lithium-Air Battery Industry: Growth and Trends 2025-2033

Discover the booming lithium-air battery market! This in-depth analysis reveals a CAGR exceeding 5.50%, driven by EV adoption and consumer electronics. Explore market size, trends, key players (Tesla, Lithium Air Industries), and regional insights for 2025-2033. Invest wisely in this high-growth sector.

August 2025
Base Year: 2024
No Of Pages: 234
Price: $4750

North America Battery Manufacturing Equipment Market Decoded: Comprehensive Analysis and Forecasts 2025-2033

The North American battery manufacturing equipment market is booming, projected to reach $2.15 billion by 2033 with a 20% CAGR. Driven by EV adoption and government incentives, this report analyzes market size, key players (Dürr AG, Hitachi Ltd., etc.), and segment trends for coating, calendaring, and more. Learn more!

August 2025
Base Year: 2024
No Of Pages: 180
Price: $4750

South America Oil And Gas Hoses And Coupling Market 2025-2033 Overview: Trends, Competitor Dynamics, and Opportunities

Discover the booming South American oil and gas hoses and couplings market. Learn about its impressive CAGR, key drivers, major players (Trelleborg, Parker Hannifin, etc.), and regional insights (Brazil, Argentina). Explore market forecasts and trends until 2033.

August 2025
Base Year: 2024
No Of Pages: 180
Price: $4750
  • Home
  • About Us
  • Industries
    • Aerospace & Defense
    • Agriculture
    • Animal Nutrition & Wellness
    • Automotive
    • Chemicals & Materials
    • Consumer Goods and Services
    • Energy & Power
    • Financial Services and Investment Intelligence
    • Food & Beverage
    • Home and Property Improvement
    • Hospitality and Tourism
    • Logistics
    • Manufacturing Products and Services
    • Packaging
    • Professional and Commercial Services
    • Real Estate and Construction
    • Retail
    • Technology, Media and Telecom
    • Healthcare
  • Services
  • Contact
Main Logo
  • Home
  • About Us
  • Industries
    • Aerospace & Defense
    • Agriculture
    • Animal Nutrition & Wellness
    • Automotive
    • Chemicals & Materials
    • Consumer Goods and Services
    • Energy & Power
    • Financial Services and Investment Intelligence
    • Food & Beverage
    • Home and Property Improvement
    • Hospitality and Tourism
    • Logistics
    • Manufacturing Products and Services
    • Packaging
    • Professional and Commercial Services
    • Real Estate and Construction
    • Retail
    • Technology, Media and Telecom
    • Healthcare
  • Services
  • Contact
+17162654855
[email protected]

+17162654855

[email protected]

Business Address

Head Office

Ansec House 3 rd floor Tank Road, Yerwada, Pune, Maharashtra 411014

Contact Information

Craig Francis

Business Development Head

+17162654855

[email protected]

Secure Payment Partners

payment image
RetailLogisticsPackagingAutomotiveHealthcareAgricultureEnergy & PowerFood & BeverageAerospace & DefenseChemicals & MaterialsHospitality and TourismAnimal Nutrition & WellnessConsumer Goods and ServicesReal Estate and ConstructionHome and Property ImprovementTechnology, Media and TelecomManufacturing Products and ServicesFinancial Services and Investment Intelligence

© 2025 PRDUA Research & Media Private Limited, All rights reserved

Privacy Policy
Terms and Conditions
FAQ