
Key Insights
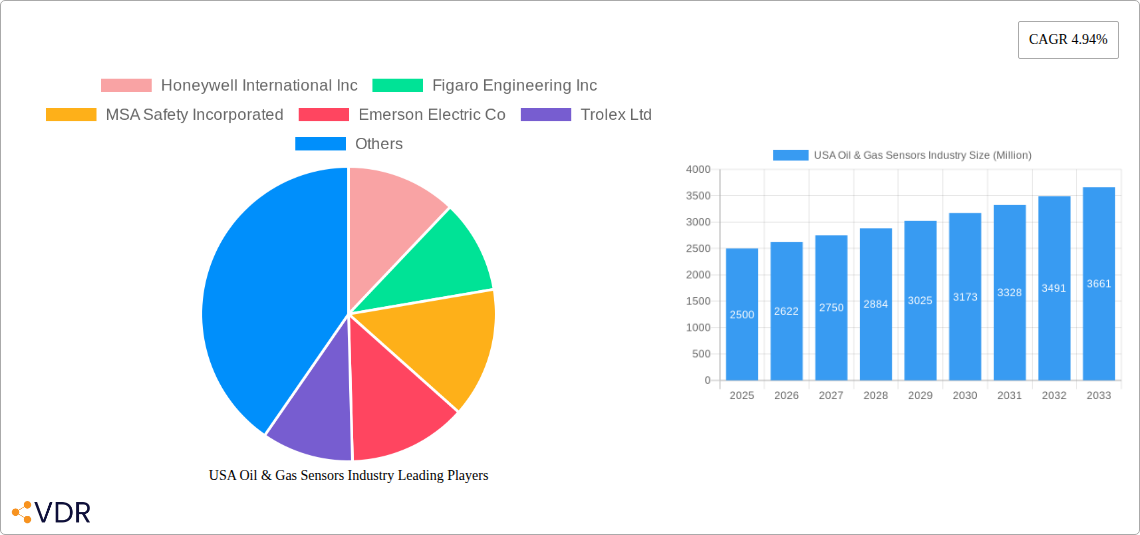
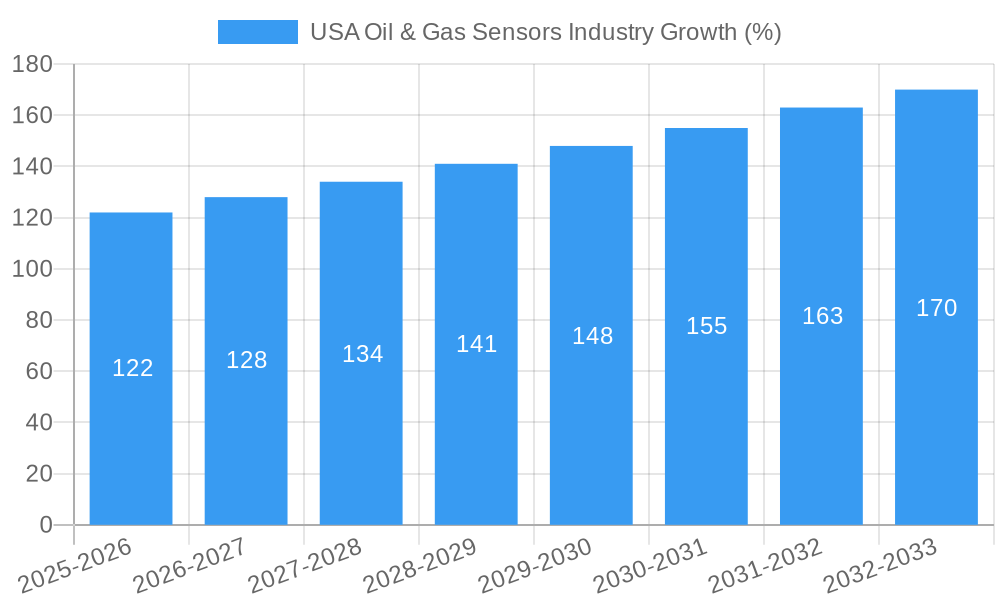
The US oil and gas sensors market is experiencing robust growth, driven by increasing demand for enhanced safety and efficiency in oil and gas operations. The market, valued at approximately $2.5 billion in 2025 (estimated based on a global market size and regional distribution), is projected to expand at a compound annual growth rate (CAGR) of 4.94% from 2025 to 2033. This growth is fueled by several key factors. Stringent government regulations mandating advanced safety measures in oil and gas extraction, processing, and transportation are driving adoption of sophisticated sensors. Furthermore, the ongoing transition towards automation and digitalization within the industry necessitates the deployment of advanced sensor technologies for real-time monitoring and control, improving operational efficiency and reducing downtime. The increasing focus on predictive maintenance, leveraging sensor data to anticipate equipment failures, further contributes to market expansion. The diverse range of sensor types, including electrochemical, photoionization detectors (PID), and infrared sensors, caters to various applications across the value chain, from upstream exploration to downstream refining and distribution. Technological advancements leading to smaller, more precise, and cost-effective sensors are also fostering market growth.
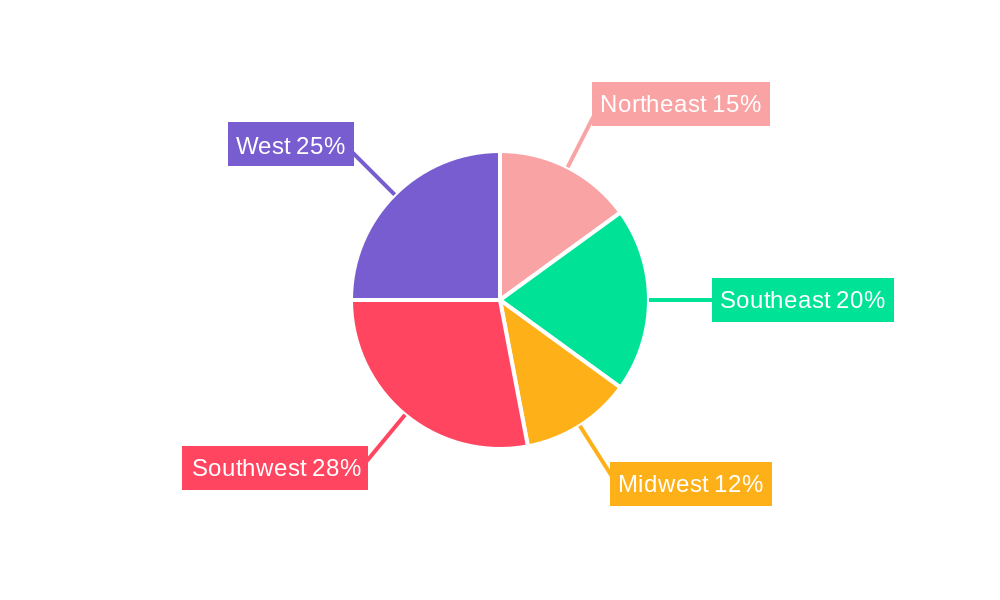
Segment-wise, the wireless sensor segment is expected to witness significant growth due to its flexibility and ease of deployment in challenging environments. Among gas types, oxygen, carbon monoxide, and hydrocarbon sensors are in high demand owing to their critical role in safety monitoring. The industrial sector dominates the application landscape, followed by building automation and medical applications. Major players like Honeywell, MSA Safety, and Emerson Electric are continuously investing in R&D and strategic acquisitions to strengthen their market positions. While challenges such as initial high investment costs and the need for skilled personnel to manage and interpret sensor data exist, the overall market outlook remains positive, driven by the long-term need for safety, efficiency, and environmental compliance within the US oil and gas industry. Regional variations in growth are expected, with states like Texas, Louisiana, and North Dakota leading in sensor adoption due to their significant oil and gas production activities.
USA Oil & Gas Sensors Industry Market Report: 2019-2033
This comprehensive report provides an in-depth analysis of the USA Oil & Gas Sensors market, encompassing market dynamics, growth trends, regional segmentation, product landscape, key players, and future outlook. The study period spans from 2019 to 2033, with 2025 serving as the base and estimated year. The forecast period covers 2025-2033, and the historical period encompasses 2019-2024. The report is essential for industry professionals, investors, and researchers seeking a detailed understanding of this rapidly evolving market. The market size is predicted to reach xx Million units by 2033.
USA Oil & Gas Sensors Industry Market Dynamics & Structure
The USA oil & gas sensors market is characterized by moderate concentration, with key players like Honeywell International Inc, Emerson Electric Co, and MSA Safety Incorporated holding significant market share. Technological innovation, driven by the need for enhanced accuracy, reliability, and miniaturization, is a key market driver. Stringent environmental regulations and safety standards further propel demand for advanced sensors. Competitive product substitutes, such as optical and spectroscopic methods, present challenges, while the increasing adoption of IoT and Industry 4.0 technologies presents significant opportunities. The market is witnessing a rise in M&A activity, with an estimated xx deals in the last five years, primarily focused on consolidating market share and expanding technological capabilities.
- Market Concentration: Moderately concentrated, with top 5 players holding approximately xx% market share.
- Technological Innovation: Focus on miniaturization, improved accuracy, wireless connectivity, and IoT integration.
- Regulatory Framework: Stringent environmental and safety regulations drive demand for sophisticated sensors.
- Competitive Substitutes: Optical and spectroscopic methods pose a competitive threat.
- End-User Demographics: Dominated by large oil and gas companies, followed by smaller operators and service providers.
- M&A Trends: xx M&A deals in the last 5 years, driven by expansion and technological integration.
USA Oil & Gas Sensors Industry Growth Trends & Insights
The USA oil & gas sensors market experienced robust growth during the historical period (2019-2024), with a CAGR of xx%. This growth is primarily attributed to increasing exploration and production activities, coupled with stricter environmental regulations. The market is expected to maintain a healthy growth trajectory during the forecast period (2025-2033), driven by technological advancements like the integration of artificial intelligence (AI) and machine learning (ML) for predictive maintenance and enhanced safety protocols. Market penetration of wireless sensors is steadily increasing, driven by cost savings and improved operational efficiency. Consumer behavior shifts toward automation and data-driven decision-making further fuel market demand. The market size is projected to reach xx Million units by 2033.
Dominant Regions, Countries, or Segments in USA Oil & Gas Sensors Industry
The Texas and Louisiana regions dominate the USA oil & gas sensors market, owing to their significant concentration of oil and gas production activities. Within the segment breakdown:
- By Type: Wireless sensors are witnessing faster growth due to advantages in installation and maintenance. The Wired segment currently holds a larger market share but is predicted to decline in percentage over the coming years.
- By Gas Type: Oxygen, Carbon Monoxide, and Hydrocarbon sensors collectively account for the largest market share, driven by stringent safety and emission regulations. Demand for Nitrogen Oxide and other gas sensors is growing due to increased awareness of environmental concerns.
- By Technology: Electrochemical sensors currently dominate the market due to their cost-effectiveness and reliability. However, Photoionization Detectors (PID) and Solid State/Metal-Oxide-Semiconductor sensors are gaining traction due to their enhanced sensitivity and selectivity.
- By Application: The Industrial segment holds the largest market share, followed by the Automotive sector. Growth in the Building Automation and Medical segments is expected to be significant in the forecast period due to increasing automation and environmental monitoring needs.
Key Drivers:
- Robust oil & gas production activities in key regions.
- Stringent environmental regulations and safety standards.
- Technological advancements leading to improved sensor performance and affordability.
- Increased adoption of IoT and Industry 4.0 technologies.
USA Oil & Gas Sensors Industry Product Landscape
The USA oil & gas sensor market showcases a diverse product landscape, featuring wired and wireless sensors with varying gas detection capabilities. Technological advancements are focused on miniaturization, improved accuracy, and enhanced durability. Sensors are increasingly integrated with data analytics platforms for real-time monitoring and predictive maintenance. Unique selling propositions include improved sensitivity, faster response times, and extended operational lifespan. Advancements in MEMS (Microelectromechanical systems) technology are also driving innovation in this sector.
Key Drivers, Barriers & Challenges in USA Oil & Gas Sensors Industry
Key Drivers:
- Growing demand for enhanced safety and environmental compliance.
- Increasing automation and digitalization in oil & gas operations.
- Technological advancements in sensor technology.
Key Challenges:
- High initial investment costs for advanced sensor systems.
- Supply chain disruptions and component shortages.
- Cybersecurity threats associated with interconnected sensor networks. An estimated xx% of companies have experienced cybersecurity issues related to their sensors, resulting in estimated losses of xx Million units annually.
Emerging Opportunities in USA Oil & Gas Sensors Industry
Emerging opportunities include:
- Increasing demand for wireless, low-power sensors for remote monitoring and predictive maintenance.
- Expansion into emerging applications like leak detection, pipeline integrity monitoring, and emissions control.
- Development of integrated sensor systems with advanced data analytics capabilities.
Growth Accelerators in the USA Oil & Gas Sensors Industry
Long-term growth is driven by advancements in sensor technology (e.g., MEMS sensors), strategic partnerships between sensor manufacturers and oil & gas companies, and expansion into new applications within renewable energy and environmental monitoring. Investments in R&D and technological breakthroughs will further enhance market growth.
Key Players Shaping the USA Oil & Gas Sensors Industry Market
- Honeywell International Inc
- Figaro Engineering Inc
- MSA Safety Incorporated
- Emerson Electric Co
- Trolex Ltd
- City Technology Ltd
- Renesas Electronics Corporation
- Sensirion AG
- Robert Bosch GmbH
- Amphenol Advanced Sensors
- AMS AG
Notable Milestones in USA Oil & Gas Sensors Industry Sector
- November 2022: Energous Corporation and Sensirion announced the development of next-generation maintenance-free wireless CO2 sensors for IAQ improvement.
- August 2022: Emerson opened a gas analysis solutions center in Scotland, enhancing capabilities for sustainable plant operations.
In-Depth USA Oil & Gas Sensors Industry Market Outlook
The USA oil & gas sensors market is poised for sustained growth, driven by ongoing technological innovations, increasing automation, and the growing need for enhanced safety and environmental compliance. Strategic partnerships, investments in R&D, and expansion into new applications will unlock significant market potential. The market's future is bright, with opportunities for both established players and new entrants to capitalize on the rising demand for advanced sensor technologies.
USA Oil & Gas Sensors Industry Segmentation
-
1. Type
- 1.1. Wired
- 1.2. Wireless
-
2. Gas Type
- 2.1. Oxygen
- 2.2. Carbon Monoxide
- 2.3. Carbon Dioxide
- 2.4. Nitrogen Oxide
- 2.5. Hydrocarbon
- 2.6. Others (Ammonia, Methane, etc.)
-
3. Technology
- 3.1. Electrochemical
- 3.2. Photoionization Detectors (PID)
- 3.3. Solid State/Metal-Oxide-Semiconductor
- 3.4. Catalytic
- 3.5. Infrared
-
4. Application
- 4.1. Medical
- 4.2. Building Automation
- 4.3. Industrial
- 4.4. Food and Beverages
- 4.5. Automotive
- 4.6. Transportation and Logistics
- 4.7. Other Applications
USA Oil & Gas Sensors Industry Segmentation By Geography
-
1. North America
- 1.1. United States
- 1.2. Canada
- 1.3. Mexico
-
2. South America
- 2.1. Brazil
- 2.2. Argentina
- 2.3. Rest of South America
-
3. Europe
- 3.1. United Kingdom
- 3.2. Germany
- 3.3. France
- 3.4. Italy
- 3.5. Spain
- 3.6. Russia
- 3.7. Benelux
- 3.8. Nordics
- 3.9. Rest of Europe
-
4. Middle East & Africa
- 4.1. Turkey
- 4.2. Israel
- 4.3. GCC
- 4.4. North Africa
- 4.5. South Africa
- 4.6. Rest of Middle East & Africa
-
5. Asia Pacific
- 5.1. China
- 5.2. India
- 5.3. Japan
- 5.4. South Korea
- 5.5. ASEAN
- 5.6. Oceania
- 5.7. Rest of Asia Pacific
USA Oil & Gas Sensors Industry REPORT HIGHLIGHTS
| Aspects | Details |
|---|---|
| Study Period | 2019-2033 |
| Base Year | 2024 |
| Estimated Year | 2025 |
| Forecast Period | 2025-2033 |
| Historical Period | 2019-2024 |
| Growth Rate | CAGR of 4.94% from 2019-2033 |
| Segmentation |
|
Table of Contents
- 1. Introduction
- 1.1. Research Scope
- 1.2. Market Segmentation
- 1.3. Research Methodology
- 1.4. Definitions and Assumptions
- 2. Executive Summary
- 2.1. Introduction
- 3. Market Dynamics
- 3.1. Introduction
- 3.2. Market Drivers
- 3.2.1. Increased Demand for Gas Sensors in Automobiles for Compliance with Governmental Regulations; Growing Awareness on Occupational Hazards across Major Industries
- 3.3. Market Restrains
- 3.3.1. Technical (Operational) Issues Impending New Customer Adoption; Rising Costs and Lack of Product Differentiation
- 3.4. Market Trends
- 3.4.1. Increasing Health and Safety Regulations in Various Industries
- 4. Market Factor Analysis
- 4.1. Porters Five Forces
- 4.2. Supply/Value Chain
- 4.3. PESTEL analysis
- 4.4. Market Entropy
- 4.5. Patent/Trademark Analysis
- 5. Global USA Oil & Gas Sensors Industry Analysis, Insights and Forecast, 2019-2031
- 5.1. Market Analysis, Insights and Forecast - by Type
- 5.1.1. Wired
- 5.1.2. Wireless
- 5.2. Market Analysis, Insights and Forecast - by Gas Type
- 5.2.1. Oxygen
- 5.2.2. Carbon Monoxide
- 5.2.3. Carbon Dioxide
- 5.2.4. Nitrogen Oxide
- 5.2.5. Hydrocarbon
- 5.2.6. Others (Ammonia, Methane, etc.)
- 5.3. Market Analysis, Insights and Forecast - by Technology
- 5.3.1. Electrochemical
- 5.3.2. Photoionization Detectors (PID)
- 5.3.3. Solid State/Metal-Oxide-Semiconductor
- 5.3.4. Catalytic
- 5.3.5. Infrared
- 5.4. Market Analysis, Insights and Forecast - by Application
- 5.4.1. Medical
- 5.4.2. Building Automation
- 5.4.3. Industrial
- 5.4.4. Food and Beverages
- 5.4.5. Automotive
- 5.4.6. Transportation and Logistics
- 5.4.7. Other Applications
- 5.5. Market Analysis, Insights and Forecast - by Region
- 5.5.1. North America
- 5.5.2. South America
- 5.5.3. Europe
- 5.5.4. Middle East & Africa
- 5.5.5. Asia Pacific
- 5.1. Market Analysis, Insights and Forecast - by Type
- 6. North America USA Oil & Gas Sensors Industry Analysis, Insights and Forecast, 2019-2031
- 6.1. Market Analysis, Insights and Forecast - by Type
- 6.1.1. Wired
- 6.1.2. Wireless
- 6.2. Market Analysis, Insights and Forecast - by Gas Type
- 6.2.1. Oxygen
- 6.2.2. Carbon Monoxide
- 6.2.3. Carbon Dioxide
- 6.2.4. Nitrogen Oxide
- 6.2.5. Hydrocarbon
- 6.2.6. Others (Ammonia, Methane, etc.)
- 6.3. Market Analysis, Insights and Forecast - by Technology
- 6.3.1. Electrochemical
- 6.3.2. Photoionization Detectors (PID)
- 6.3.3. Solid State/Metal-Oxide-Semiconductor
- 6.3.4. Catalytic
- 6.3.5. Infrared
- 6.4. Market Analysis, Insights and Forecast - by Application
- 6.4.1. Medical
- 6.4.2. Building Automation
- 6.4.3. Industrial
- 6.4.4. Food and Beverages
- 6.4.5. Automotive
- 6.4.6. Transportation and Logistics
- 6.4.7. Other Applications
- 6.1. Market Analysis, Insights and Forecast - by Type
- 7. South America USA Oil & Gas Sensors Industry Analysis, Insights and Forecast, 2019-2031
- 7.1. Market Analysis, Insights and Forecast - by Type
- 7.1.1. Wired
- 7.1.2. Wireless
- 7.2. Market Analysis, Insights and Forecast - by Gas Type
- 7.2.1. Oxygen
- 7.2.2. Carbon Monoxide
- 7.2.3. Carbon Dioxide
- 7.2.4. Nitrogen Oxide
- 7.2.5. Hydrocarbon
- 7.2.6. Others (Ammonia, Methane, etc.)
- 7.3. Market Analysis, Insights and Forecast - by Technology
- 7.3.1. Electrochemical
- 7.3.2. Photoionization Detectors (PID)
- 7.3.3. Solid State/Metal-Oxide-Semiconductor
- 7.3.4. Catalytic
- 7.3.5. Infrared
- 7.4. Market Analysis, Insights and Forecast - by Application
- 7.4.1. Medical
- 7.4.2. Building Automation
- 7.4.3. Industrial
- 7.4.4. Food and Beverages
- 7.4.5. Automotive
- 7.4.6. Transportation and Logistics
- 7.4.7. Other Applications
- 7.1. Market Analysis, Insights and Forecast - by Type
- 8. Europe USA Oil & Gas Sensors Industry Analysis, Insights and Forecast, 2019-2031
- 8.1. Market Analysis, Insights and Forecast - by Type
- 8.1.1. Wired
- 8.1.2. Wireless
- 8.2. Market Analysis, Insights and Forecast - by Gas Type
- 8.2.1. Oxygen
- 8.2.2. Carbon Monoxide
- 8.2.3. Carbon Dioxide
- 8.2.4. Nitrogen Oxide
- 8.2.5. Hydrocarbon
- 8.2.6. Others (Ammonia, Methane, etc.)
- 8.3. Market Analysis, Insights and Forecast - by Technology
- 8.3.1. Electrochemical
- 8.3.2. Photoionization Detectors (PID)
- 8.3.3. Solid State/Metal-Oxide-Semiconductor
- 8.3.4. Catalytic
- 8.3.5. Infrared
- 8.4. Market Analysis, Insights and Forecast - by Application
- 8.4.1. Medical
- 8.4.2. Building Automation
- 8.4.3. Industrial
- 8.4.4. Food and Beverages
- 8.4.5. Automotive
- 8.4.6. Transportation and Logistics
- 8.4.7. Other Applications
- 8.1. Market Analysis, Insights and Forecast - by Type
- 9. Middle East & Africa USA Oil & Gas Sensors Industry Analysis, Insights and Forecast, 2019-2031
- 9.1. Market Analysis, Insights and Forecast - by Type
- 9.1.1. Wired
- 9.1.2. Wireless
- 9.2. Market Analysis, Insights and Forecast - by Gas Type
- 9.2.1. Oxygen
- 9.2.2. Carbon Monoxide
- 9.2.3. Carbon Dioxide
- 9.2.4. Nitrogen Oxide
- 9.2.5. Hydrocarbon
- 9.2.6. Others (Ammonia, Methane, etc.)
- 9.3. Market Analysis, Insights and Forecast - by Technology
- 9.3.1. Electrochemical
- 9.3.2. Photoionization Detectors (PID)
- 9.3.3. Solid State/Metal-Oxide-Semiconductor
- 9.3.4. Catalytic
- 9.3.5. Infrared
- 9.4. Market Analysis, Insights and Forecast - by Application
- 9.4.1. Medical
- 9.4.2. Building Automation
- 9.4.3. Industrial
- 9.4.4. Food and Beverages
- 9.4.5. Automotive
- 9.4.6. Transportation and Logistics
- 9.4.7. Other Applications
- 9.1. Market Analysis, Insights and Forecast - by Type
- 10. Asia Pacific USA Oil & Gas Sensors Industry Analysis, Insights and Forecast, 2019-2031
- 10.1. Market Analysis, Insights and Forecast - by Type
- 10.1.1. Wired
- 10.1.2. Wireless
- 10.2. Market Analysis, Insights and Forecast - by Gas Type
- 10.2.1. Oxygen
- 10.2.2. Carbon Monoxide
- 10.2.3. Carbon Dioxide
- 10.2.4. Nitrogen Oxide
- 10.2.5. Hydrocarbon
- 10.2.6. Others (Ammonia, Methane, etc.)
- 10.3. Market Analysis, Insights and Forecast - by Technology
- 10.3.1. Electrochemical
- 10.3.2. Photoionization Detectors (PID)
- 10.3.3. Solid State/Metal-Oxide-Semiconductor
- 10.3.4. Catalytic
- 10.3.5. Infrared
- 10.4. Market Analysis, Insights and Forecast - by Application
- 10.4.1. Medical
- 10.4.2. Building Automation
- 10.4.3. Industrial
- 10.4.4. Food and Beverages
- 10.4.5. Automotive
- 10.4.6. Transportation and Logistics
- 10.4.7. Other Applications
- 10.1. Market Analysis, Insights and Forecast - by Type
- 11. Northeast USA Oil & Gas Sensors Industry Analysis, Insights and Forecast, 2019-2031
- 12. Southeast USA Oil & Gas Sensors Industry Analysis, Insights and Forecast, 2019-2031
- 13. Midwest USA Oil & Gas Sensors Industry Analysis, Insights and Forecast, 2019-2031
- 14. Southwest USA Oil & Gas Sensors Industry Analysis, Insights and Forecast, 2019-2031
- 15. West USA Oil & Gas Sensors Industry Analysis, Insights and Forecast, 2019-2031
- 16. Competitive Analysis
- 16.1. Global Market Share Analysis 2024
- 16.2. Company Profiles
- 16.2.1 Honeywell International Inc
- 16.2.1.1. Overview
- 16.2.1.2. Products
- 16.2.1.3. SWOT Analysis
- 16.2.1.4. Recent Developments
- 16.2.1.5. Financials (Based on Availability)
- 16.2.2 Figaro Engineering Inc
- 16.2.2.1. Overview
- 16.2.2.2. Products
- 16.2.2.3. SWOT Analysis
- 16.2.2.4. Recent Developments
- 16.2.2.5. Financials (Based on Availability)
- 16.2.3 MSA Safety Incorporated
- 16.2.3.1. Overview
- 16.2.3.2. Products
- 16.2.3.3. SWOT Analysis
- 16.2.3.4. Recent Developments
- 16.2.3.5. Financials (Based on Availability)
- 16.2.4 Emerson Electric Co
- 16.2.4.1. Overview
- 16.2.4.2. Products
- 16.2.4.3. SWOT Analysis
- 16.2.4.4. Recent Developments
- 16.2.4.5. Financials (Based on Availability)
- 16.2.5 Trolex Ltd
- 16.2.5.1. Overview
- 16.2.5.2. Products
- 16.2.5.3. SWOT Analysis
- 16.2.5.4. Recent Developments
- 16.2.5.5. Financials (Based on Availability)
- 16.2.6 City Technology Ltd
- 16.2.6.1. Overview
- 16.2.6.2. Products
- 16.2.6.3. SWOT Analysis
- 16.2.6.4. Recent Developments
- 16.2.6.5. Financials (Based on Availability)
- 16.2.7 Renesas Electronics Corporation
- 16.2.7.1. Overview
- 16.2.7.2. Products
- 16.2.7.3. SWOT Analysis
- 16.2.7.4. Recent Developments
- 16.2.7.5. Financials (Based on Availability)
- 16.2.8 Sensirion AG
- 16.2.8.1. Overview
- 16.2.8.2. Products
- 16.2.8.3. SWOT Analysis
- 16.2.8.4. Recent Developments
- 16.2.8.5. Financials (Based on Availability)
- 16.2.9 Robert Bosch GmbH
- 16.2.9.1. Overview
- 16.2.9.2. Products
- 16.2.9.3. SWOT Analysis
- 16.2.9.4. Recent Developments
- 16.2.9.5. Financials (Based on Availability)
- 16.2.10 Amphenol Advanced Sensors
- 16.2.10.1. Overview
- 16.2.10.2. Products
- 16.2.10.3. SWOT Analysis
- 16.2.10.4. Recent Developments
- 16.2.10.5. Financials (Based on Availability)
- 16.2.11 AMS AG
- 16.2.11.1. Overview
- 16.2.11.2. Products
- 16.2.11.3. SWOT Analysis
- 16.2.11.4. Recent Developments
- 16.2.11.5. Financials (Based on Availability)
- 16.2.1 Honeywell International Inc
List of Figures
- Figure 1: Global USA Oil & Gas Sensors Industry Revenue Breakdown (Million, %) by Region 2024 & 2032
- Figure 2: United states USA Oil & Gas Sensors Industry Revenue (Million), by Country 2024 & 2032
- Figure 3: United states USA Oil & Gas Sensors Industry Revenue Share (%), by Country 2024 & 2032
- Figure 4: North America USA Oil & Gas Sensors Industry Revenue (Million), by Type 2024 & 2032
- Figure 5: North America USA Oil & Gas Sensors Industry Revenue Share (%), by Type 2024 & 2032
- Figure 6: North America USA Oil & Gas Sensors Industry Revenue (Million), by Gas Type 2024 & 2032
- Figure 7: North America USA Oil & Gas Sensors Industry Revenue Share (%), by Gas Type 2024 & 2032
- Figure 8: North America USA Oil & Gas Sensors Industry Revenue (Million), by Technology 2024 & 2032
- Figure 9: North America USA Oil & Gas Sensors Industry Revenue Share (%), by Technology 2024 & 2032
- Figure 10: North America USA Oil & Gas Sensors Industry Revenue (Million), by Application 2024 & 2032
- Figure 11: North America USA Oil & Gas Sensors Industry Revenue Share (%), by Application 2024 & 2032
- Figure 12: North America USA Oil & Gas Sensors Industry Revenue (Million), by Country 2024 & 2032
- Figure 13: North America USA Oil & Gas Sensors Industry Revenue Share (%), by Country 2024 & 2032
- Figure 14: South America USA Oil & Gas Sensors Industry Revenue (Million), by Type 2024 & 2032
- Figure 15: South America USA Oil & Gas Sensors Industry Revenue Share (%), by Type 2024 & 2032
- Figure 16: South America USA Oil & Gas Sensors Industry Revenue (Million), by Gas Type 2024 & 2032
- Figure 17: South America USA Oil & Gas Sensors Industry Revenue Share (%), by Gas Type 2024 & 2032
- Figure 18: South America USA Oil & Gas Sensors Industry Revenue (Million), by Technology 2024 & 2032
- Figure 19: South America USA Oil & Gas Sensors Industry Revenue Share (%), by Technology 2024 & 2032
- Figure 20: South America USA Oil & Gas Sensors Industry Revenue (Million), by Application 2024 & 2032
- Figure 21: South America USA Oil & Gas Sensors Industry Revenue Share (%), by Application 2024 & 2032
- Figure 22: South America USA Oil & Gas Sensors Industry Revenue (Million), by Country 2024 & 2032
- Figure 23: South America USA Oil & Gas Sensors Industry Revenue Share (%), by Country 2024 & 2032
- Figure 24: Europe USA Oil & Gas Sensors Industry Revenue (Million), by Type 2024 & 2032
- Figure 25: Europe USA Oil & Gas Sensors Industry Revenue Share (%), by Type 2024 & 2032
- Figure 26: Europe USA Oil & Gas Sensors Industry Revenue (Million), by Gas Type 2024 & 2032
- Figure 27: Europe USA Oil & Gas Sensors Industry Revenue Share (%), by Gas Type 2024 & 2032
- Figure 28: Europe USA Oil & Gas Sensors Industry Revenue (Million), by Technology 2024 & 2032
- Figure 29: Europe USA Oil & Gas Sensors Industry Revenue Share (%), by Technology 2024 & 2032
- Figure 30: Europe USA Oil & Gas Sensors Industry Revenue (Million), by Application 2024 & 2032
- Figure 31: Europe USA Oil & Gas Sensors Industry Revenue Share (%), by Application 2024 & 2032
- Figure 32: Europe USA Oil & Gas Sensors Industry Revenue (Million), by Country 2024 & 2032
- Figure 33: Europe USA Oil & Gas Sensors Industry Revenue Share (%), by Country 2024 & 2032
- Figure 34: Middle East & Africa USA Oil & Gas Sensors Industry Revenue (Million), by Type 2024 & 2032
- Figure 35: Middle East & Africa USA Oil & Gas Sensors Industry Revenue Share (%), by Type 2024 & 2032
- Figure 36: Middle East & Africa USA Oil & Gas Sensors Industry Revenue (Million), by Gas Type 2024 & 2032
- Figure 37: Middle East & Africa USA Oil & Gas Sensors Industry Revenue Share (%), by Gas Type 2024 & 2032
- Figure 38: Middle East & Africa USA Oil & Gas Sensors Industry Revenue (Million), by Technology 2024 & 2032
- Figure 39: Middle East & Africa USA Oil & Gas Sensors Industry Revenue Share (%), by Technology 2024 & 2032
- Figure 40: Middle East & Africa USA Oil & Gas Sensors Industry Revenue (Million), by Application 2024 & 2032
- Figure 41: Middle East & Africa USA Oil & Gas Sensors Industry Revenue Share (%), by Application 2024 & 2032
- Figure 42: Middle East & Africa USA Oil & Gas Sensors Industry Revenue (Million), by Country 2024 & 2032
- Figure 43: Middle East & Africa USA Oil & Gas Sensors Industry Revenue Share (%), by Country 2024 & 2032
- Figure 44: Asia Pacific USA Oil & Gas Sensors Industry Revenue (Million), by Type 2024 & 2032
- Figure 45: Asia Pacific USA Oil & Gas Sensors Industry Revenue Share (%), by Type 2024 & 2032
- Figure 46: Asia Pacific USA Oil & Gas Sensors Industry Revenue (Million), by Gas Type 2024 & 2032
- Figure 47: Asia Pacific USA Oil & Gas Sensors Industry Revenue Share (%), by Gas Type 2024 & 2032
- Figure 48: Asia Pacific USA Oil & Gas Sensors Industry Revenue (Million), by Technology 2024 & 2032
- Figure 49: Asia Pacific USA Oil & Gas Sensors Industry Revenue Share (%), by Technology 2024 & 2032
- Figure 50: Asia Pacific USA Oil & Gas Sensors Industry Revenue (Million), by Application 2024 & 2032
- Figure 51: Asia Pacific USA Oil & Gas Sensors Industry Revenue Share (%), by Application 2024 & 2032
- Figure 52: Asia Pacific USA Oil & Gas Sensors Industry Revenue (Million), by Country 2024 & 2032
- Figure 53: Asia Pacific USA Oil & Gas Sensors Industry Revenue Share (%), by Country 2024 & 2032
List of Tables
- Table 1: Global USA Oil & Gas Sensors Industry Revenue Million Forecast, by Region 2019 & 2032
- Table 2: Global USA Oil & Gas Sensors Industry Revenue Million Forecast, by Type 2019 & 2032
- Table 3: Global USA Oil & Gas Sensors Industry Revenue Million Forecast, by Gas Type 2019 & 2032
- Table 4: Global USA Oil & Gas Sensors Industry Revenue Million Forecast, by Technology 2019 & 2032
- Table 5: Global USA Oil & Gas Sensors Industry Revenue Million Forecast, by Application 2019 & 2032
- Table 6: Global USA Oil & Gas Sensors Industry Revenue Million Forecast, by Region 2019 & 2032
- Table 7: Global USA Oil & Gas Sensors Industry Revenue Million Forecast, by Country 2019 & 2032
- Table 8: Northeast USA Oil & Gas Sensors Industry Revenue (Million) Forecast, by Application 2019 & 2032
- Table 9: Southeast USA Oil & Gas Sensors Industry Revenue (Million) Forecast, by Application 2019 & 2032
- Table 10: Midwest USA Oil & Gas Sensors Industry Revenue (Million) Forecast, by Application 2019 & 2032
- Table 11: Southwest USA Oil & Gas Sensors Industry Revenue (Million) Forecast, by Application 2019 & 2032
- Table 12: West USA Oil & Gas Sensors Industry Revenue (Million) Forecast, by Application 2019 & 2032
- Table 13: Global USA Oil & Gas Sensors Industry Revenue Million Forecast, by Type 2019 & 2032
- Table 14: Global USA Oil & Gas Sensors Industry Revenue Million Forecast, by Gas Type 2019 & 2032
- Table 15: Global USA Oil & Gas Sensors Industry Revenue Million Forecast, by Technology 2019 & 2032
- Table 16: Global USA Oil & Gas Sensors Industry Revenue Million Forecast, by Application 2019 & 2032
- Table 17: Global USA Oil & Gas Sensors Industry Revenue Million Forecast, by Country 2019 & 2032
- Table 18: United States USA Oil & Gas Sensors Industry Revenue (Million) Forecast, by Application 2019 & 2032
- Table 19: Canada USA Oil & Gas Sensors Industry Revenue (Million) Forecast, by Application 2019 & 2032
- Table 20: Mexico USA Oil & Gas Sensors Industry Revenue (Million) Forecast, by Application 2019 & 2032
- Table 21: Global USA Oil & Gas Sensors Industry Revenue Million Forecast, by Type 2019 & 2032
- Table 22: Global USA Oil & Gas Sensors Industry Revenue Million Forecast, by Gas Type 2019 & 2032
- Table 23: Global USA Oil & Gas Sensors Industry Revenue Million Forecast, by Technology 2019 & 2032
- Table 24: Global USA Oil & Gas Sensors Industry Revenue Million Forecast, by Application 2019 & 2032
- Table 25: Global USA Oil & Gas Sensors Industry Revenue Million Forecast, by Country 2019 & 2032
- Table 26: Brazil USA Oil & Gas Sensors Industry Revenue (Million) Forecast, by Application 2019 & 2032
- Table 27: Argentina USA Oil & Gas Sensors Industry Revenue (Million) Forecast, by Application 2019 & 2032
- Table 28: Rest of South America USA Oil & Gas Sensors Industry Revenue (Million) Forecast, by Application 2019 & 2032
- Table 29: Global USA Oil & Gas Sensors Industry Revenue Million Forecast, by Type 2019 & 2032
- Table 30: Global USA Oil & Gas Sensors Industry Revenue Million Forecast, by Gas Type 2019 & 2032
- Table 31: Global USA Oil & Gas Sensors Industry Revenue Million Forecast, by Technology 2019 & 2032
- Table 32: Global USA Oil & Gas Sensors Industry Revenue Million Forecast, by Application 2019 & 2032
- Table 33: Global USA Oil & Gas Sensors Industry Revenue Million Forecast, by Country 2019 & 2032
- Table 34: United Kingdom USA Oil & Gas Sensors Industry Revenue (Million) Forecast, by Application 2019 & 2032
- Table 35: Germany USA Oil & Gas Sensors Industry Revenue (Million) Forecast, by Application 2019 & 2032
- Table 36: France USA Oil & Gas Sensors Industry Revenue (Million) Forecast, by Application 2019 & 2032
- Table 37: Italy USA Oil & Gas Sensors Industry Revenue (Million) Forecast, by Application 2019 & 2032
- Table 38: Spain USA Oil & Gas Sensors Industry Revenue (Million) Forecast, by Application 2019 & 2032
- Table 39: Russia USA Oil & Gas Sensors Industry Revenue (Million) Forecast, by Application 2019 & 2032
- Table 40: Benelux USA Oil & Gas Sensors Industry Revenue (Million) Forecast, by Application 2019 & 2032
- Table 41: Nordics USA Oil & Gas Sensors Industry Revenue (Million) Forecast, by Application 2019 & 2032
- Table 42: Rest of Europe USA Oil & Gas Sensors Industry Revenue (Million) Forecast, by Application 2019 & 2032
- Table 43: Global USA Oil & Gas Sensors Industry Revenue Million Forecast, by Type 2019 & 2032
- Table 44: Global USA Oil & Gas Sensors Industry Revenue Million Forecast, by Gas Type 2019 & 2032
- Table 45: Global USA Oil & Gas Sensors Industry Revenue Million Forecast, by Technology 2019 & 2032
- Table 46: Global USA Oil & Gas Sensors Industry Revenue Million Forecast, by Application 2019 & 2032
- Table 47: Global USA Oil & Gas Sensors Industry Revenue Million Forecast, by Country 2019 & 2032
- Table 48: Turkey USA Oil & Gas Sensors Industry Revenue (Million) Forecast, by Application 2019 & 2032
- Table 49: Israel USA Oil & Gas Sensors Industry Revenue (Million) Forecast, by Application 2019 & 2032
- Table 50: GCC USA Oil & Gas Sensors Industry Revenue (Million) Forecast, by Application 2019 & 2032
- Table 51: North Africa USA Oil & Gas Sensors Industry Revenue (Million) Forecast, by Application 2019 & 2032
- Table 52: South Africa USA Oil & Gas Sensors Industry Revenue (Million) Forecast, by Application 2019 & 2032
- Table 53: Rest of Middle East & Africa USA Oil & Gas Sensors Industry Revenue (Million) Forecast, by Application 2019 & 2032
- Table 54: Global USA Oil & Gas Sensors Industry Revenue Million Forecast, by Type 2019 & 2032
- Table 55: Global USA Oil & Gas Sensors Industry Revenue Million Forecast, by Gas Type 2019 & 2032
- Table 56: Global USA Oil & Gas Sensors Industry Revenue Million Forecast, by Technology 2019 & 2032
- Table 57: Global USA Oil & Gas Sensors Industry Revenue Million Forecast, by Application 2019 & 2032
- Table 58: Global USA Oil & Gas Sensors Industry Revenue Million Forecast, by Country 2019 & 2032
- Table 59: China USA Oil & Gas Sensors Industry Revenue (Million) Forecast, by Application 2019 & 2032
- Table 60: India USA Oil & Gas Sensors Industry Revenue (Million) Forecast, by Application 2019 & 2032
- Table 61: Japan USA Oil & Gas Sensors Industry Revenue (Million) Forecast, by Application 2019 & 2032
- Table 62: South Korea USA Oil & Gas Sensors Industry Revenue (Million) Forecast, by Application 2019 & 2032
- Table 63: ASEAN USA Oil & Gas Sensors Industry Revenue (Million) Forecast, by Application 2019 & 2032
- Table 64: Oceania USA Oil & Gas Sensors Industry Revenue (Million) Forecast, by Application 2019 & 2032
- Table 65: Rest of Asia Pacific USA Oil & Gas Sensors Industry Revenue (Million) Forecast, by Application 2019 & 2032
Frequently Asked Questions
1. What is the projected Compound Annual Growth Rate (CAGR) of the USA Oil & Gas Sensors Industry?
The projected CAGR is approximately 4.94%.
2. Which companies are prominent players in the USA Oil & Gas Sensors Industry?
Key companies in the market include Honeywell International Inc, Figaro Engineering Inc, MSA Safety Incorporated, Emerson Electric Co, Trolex Ltd, City Technology Ltd, Renesas Electronics Corporation, Sensirion AG, Robert Bosch GmbH, Amphenol Advanced Sensors, AMS AG.
3. What are the main segments of the USA Oil & Gas Sensors Industry?
The market segments include Type, Gas Type, Technology, Application.
4. Can you provide details about the market size?
The market size is estimated to be USD XX Million as of 2022.
5. What are some drivers contributing to market growth?
Increased Demand for Gas Sensors in Automobiles for Compliance with Governmental Regulations; Growing Awareness on Occupational Hazards across Major Industries.
6. What are the notable trends driving market growth?
Increasing Health and Safety Regulations in Various Industries.
7. Are there any restraints impacting market growth?
Technical (Operational) Issues Impending New Customer Adoption; Rising Costs and Lack of Product Differentiation.
8. Can you provide examples of recent developments in the market?
Nov 2022 - Energous Corporation, a developer of RF-based charging for wireless power networks, and Sensirion, a provider of CO2 sensor products, announced to develop next-generation maintenance-free CO2 sensors powered wirelessly over the air for Indoor Air Quality (IAQ) improvement in industrial and commercial applications.
9. What pricing options are available for accessing the report?
Pricing options include single-user, multi-user, and enterprise licenses priced at USD 3800, USD 4500, and USD 5800 respectively.
10. Is the market size provided in terms of value or volume?
The market size is provided in terms of value, measured in Million.
11. Are there any specific market keywords associated with the report?
Yes, the market keyword associated with the report is "USA Oil & Gas Sensors Industry," which aids in identifying and referencing the specific market segment covered.
12. How do I determine which pricing option suits my needs best?
The pricing options vary based on user requirements and access needs. Individual users may opt for single-user licenses, while businesses requiring broader access may choose multi-user or enterprise licenses for cost-effective access to the report.
13. Are there any additional resources or data provided in the USA Oil & Gas Sensors Industry report?
While the report offers comprehensive insights, it's advisable to review the specific contents or supplementary materials provided to ascertain if additional resources or data are available.
14. How can I stay updated on further developments or reports in the USA Oil & Gas Sensors Industry?
To stay informed about further developments, trends, and reports in the USA Oil & Gas Sensors Industry, consider subscribing to industry newsletters, following relevant companies and organizations, or regularly checking reputable industry news sources and publications.
Methodology
Step 1 - Identification of Relevant Samples Size from Population Database


Step 2 - Approaches for Defining Global Market Size (Value, Volume* & Price*)

Note*: In applicable scenarios
Step 3 - Data Sources
Primary Research
- Web Analytics
- Survey Reports
- Research Institute
- Latest Research Reports
- Opinion Leaders
Secondary Research
- Annual Reports
- White Paper
- Latest Press Release
- Industry Association
- Paid Database
- Investor Presentations

Step 4 - Data Triangulation
Involves using different sources of information in order to increase the validity of a study
These sources are likely to be stakeholders in a program - participants, other researchers, program staff, other community members, and so on.
Then we put all data in single framework & apply various statistical tools to find out the dynamic on the market.
During the analysis stage, feedback from the stakeholder groups would be compared to determine areas of agreement as well as areas of divergence


