
Key Insights
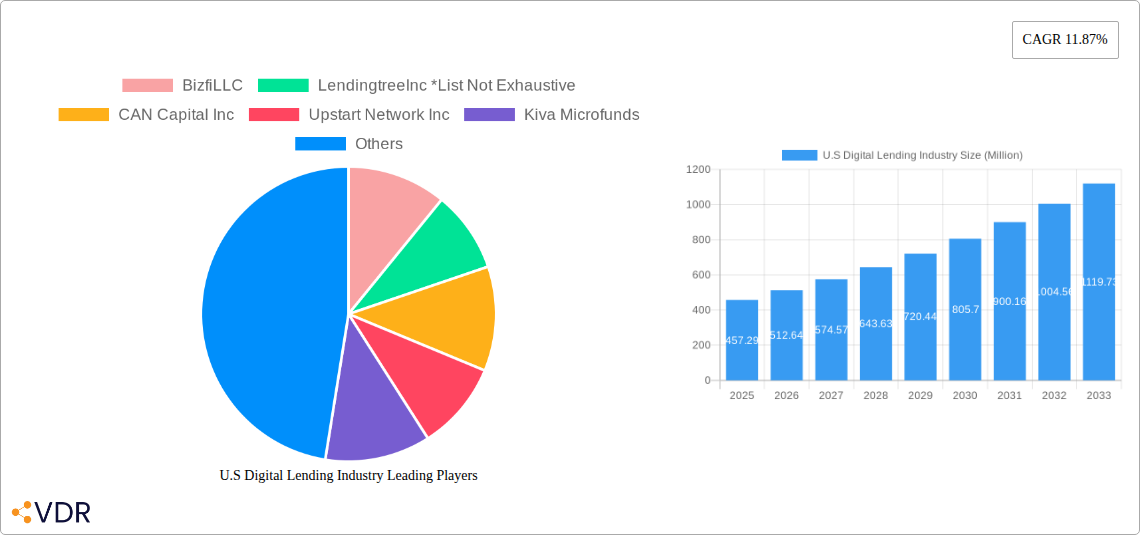
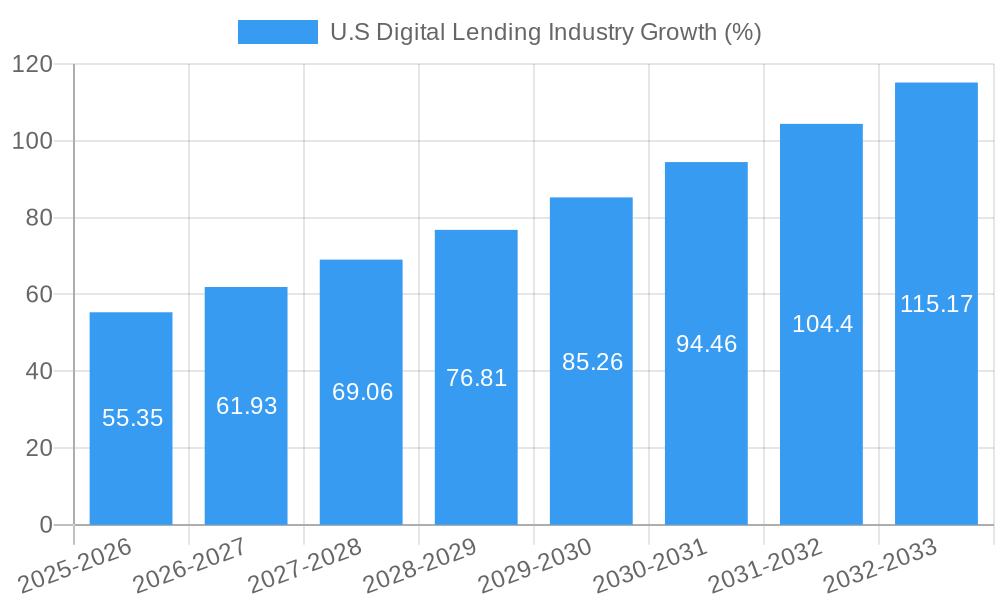
The U.S. digital lending industry is experiencing robust growth, projected to reach a market size of $457.29 million in 2025 and maintain a Compound Annual Growth Rate (CAGR) of 11.87% from 2025 to 2033. This expansion is fueled by several key drivers. Increased smartphone penetration and internet access have broadened the reach of digital lending platforms, making financial services more accessible to a wider demographic. Furthermore, the streamlining of the application process through automation and sophisticated algorithms leads to faster loan approvals and disbursement, significantly improving customer experience. The ongoing preference for contactless transactions, further amplified by recent events, has accelerated the adoption of digital lending solutions. Finally, the increasing availability of alternative data sources allows lenders to assess creditworthiness more effectively, expanding lending opportunities to previously underserved segments.
The industry's segmentation into business and consumer digital lending reflects distinct market dynamics. Business digital lending is driven by the need for quick and efficient financing solutions for small and medium-sized enterprises (SMEs), while consumer digital lending benefits from the convenience and accessibility it offers to individuals. However, challenges remain, including concerns about data security and privacy, the potential for increased debt levels among borrowers, and the need for robust regulatory frameworks to mitigate risks. Despite these restraints, the long-term outlook for the U.S. digital lending industry remains positive, driven by ongoing technological advancements and the persistent demand for accessible and efficient financial services. The continued innovation in AI-powered credit scoring, personalized lending products, and blockchain technology will likely shape the industry's trajectory in the coming years. The success of companies like LendingTree, Upstart, and SoFi underscore the significant market opportunity and ongoing investor interest.
U.S. Digital Lending Industry Market Report: 2019-2033
This comprehensive report provides an in-depth analysis of the U.S. digital lending industry, covering market dynamics, growth trends, key players, and future outlook. With a study period spanning 2019-2033, a base year of 2025, and a forecast period of 2025-2033, this report is an essential resource for industry professionals, investors, and strategic decision-makers. The report analyzes both parent markets (financial services) and child markets (business and consumer digital lending) to provide a holistic view. Market values are presented in millions of USD.
U.S Digital Lending Industry Market Dynamics & Structure
The U.S. digital lending market is characterized by intense competition, rapid technological advancements, and evolving regulatory landscapes. Market concentration is moderate, with a few large players alongside numerous smaller firms. Technological innovation, driven by AI, machine learning, and blockchain, is a key driver, while regulatory frameworks, including data privacy and consumer protection laws, significantly impact operations. Competitive product substitutes include traditional brick-and-mortar lending institutions. End-user demographics are diverse, encompassing both individuals and businesses of varying sizes. M&A activity has been significant, with deal volumes averaging xx in the past five years, reflecting consolidation and expansion efforts.
- Market Concentration: Moderately concentrated, with top 5 players holding xx% market share (2024).
- Technological Innovation: AI-driven credit scoring, automated loan processing, and blockchain for secure transactions are major drivers.
- Regulatory Framework: Compliance with Dodd-Frank Act, CCPA, and state-specific regulations is crucial.
- Competitive Substitutes: Traditional banks and credit unions.
- End-User Demographics: Individuals (consumer lending), SMEs, and large corporations (business lending).
- M&A Trends: Consolidation within the industry, with an average of xx M&A deals annually (2019-2024).
U.S Digital Lending Industry Growth Trends & Insights
The U.S. digital lending market has experienced substantial growth, expanding from xx million in 2019 to xx million in 2024. This reflects increased consumer adoption of digital platforms, driven by convenience, speed, and accessibility. Technological disruptions, particularly AI-powered lending platforms, have significantly improved efficiency and risk assessment. Consumer behavior shifts towards digital channels, fueled by smartphone penetration and online banking adoption, are further propelling market growth. The market is projected to achieve a CAGR of xx% during the forecast period (2025-2033), reaching xx million by 2033. Market penetration is expected to increase from xx% in 2024 to xx% in 2033. The shift towards open banking and embedded finance is further accelerating market expansion.
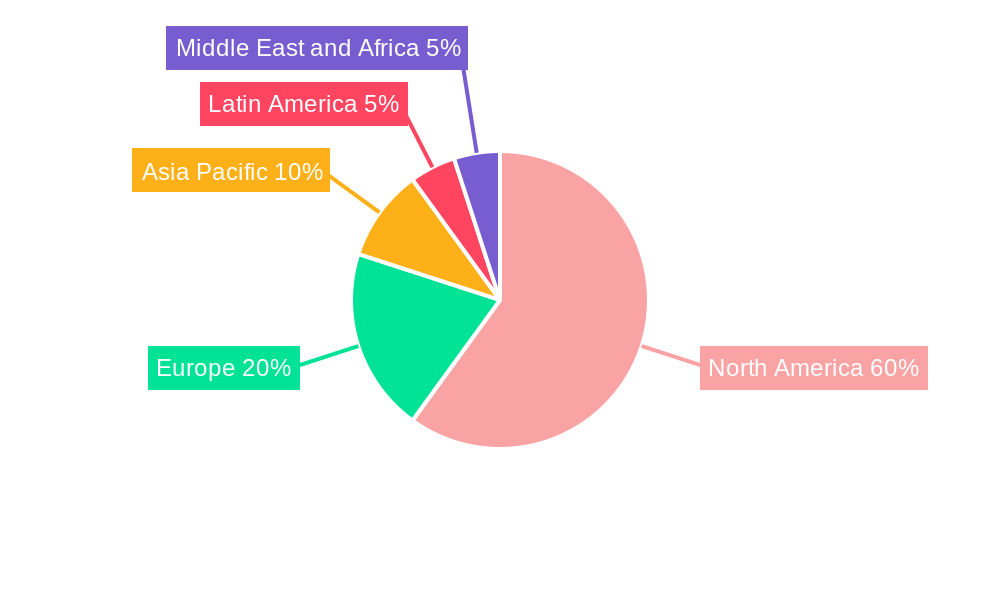
Dominant Regions, Countries, or Segments in U.S Digital Lending Industry
The Northeast and West Coast regions dominate the U.S. digital lending market, driven by higher concentrations of tech companies, venture capital funding, and digitally savvy populations. Within the segments, Consumer Digital Lending currently holds a larger market share (xx%) compared to Business Digital Lending (xx%) in 2024. However, Business Digital Lending is projected to experience faster growth due to the increasing adoption of digital financial solutions by SMEs.
- Key Drivers (Consumer Digital Lending): High smartphone penetration, online banking adoption, and favorable consumer sentiment towards digital services.
- Key Drivers (Business Digital Lending): Demand for faster loan processing, reduced administrative burden, and improved access to capital for SMEs.
- Dominance Factors: Geographic concentration of tech firms, strong venture capital investment, and favorable regulatory environments in certain regions.
- Growth Potential: Both segments have significant growth potential, particularly Business Digital Lending driven by the underserved SME sector.
U.S Digital Lending Industry Product Landscape
The product landscape is characterized by a diverse range of offerings tailored to specific needs, from personal loans and mortgages to business lines of credit and invoice financing. Innovation focuses on improving user experience, enhancing risk assessment accuracy, and offering personalized lending solutions using AI and machine learning. Key product features include streamlined application processes, instant loan decisions, and competitive interest rates. Unique selling propositions include features like flexible repayment options, personalized financial management tools, and integrated insurance solutions, like TruStage's Payment Guard.
Key Drivers, Barriers & Challenges in U.S Digital Lending Industry
Key Drivers: Technological advancements (AI, machine learning), rising smartphone and internet penetration, increasing demand for convenient financial services, and government initiatives promoting financial inclusion.
Challenges: Stringent regulatory compliance, cybersecurity threats, managing credit risk in a volatile economic environment, and competition from established financial institutions. Regulatory hurdles are expected to impact the industry's growth by xx% by 2030, representing a significant challenge.
Emerging Opportunities in U.S Digital Lending Industry
Untapped markets include underserved communities with limited access to traditional banking, and the expanding use of embedded finance in various sectors. Innovative applications include AI-powered loan underwriting and personalized financial advice integrated into lending platforms. Evolving consumer preferences are driving demand for customized lending solutions and seamless digital experiences.
Growth Accelerators in the U.S Digital Lending Industry
Technological advancements, particularly in AI and blockchain, are key growth accelerators. Strategic partnerships between fintech companies and traditional banks are fostering market expansion. Government initiatives promoting financial inclusion are driving the growth of lending to underserved populations.
Key Players Shaping the U.S Digital Lending Industry Market
- Bizfi LLC
- LendingTree Inc
- CAN Capital Inc
- Upstart Network Inc
- Kiva Microfunds
- LendingClub Corp
- Social Finance Inc (SoFi)
- On Deck Capital Inc
- Kabbage Inc
- Prosper Marketplace Inc
Notable Milestones in U.S Digital Lending Industry Sector
- September 2023: Launch of TruStage Payment Guard Insurance, an innovative insurance solution for digital lenders and borrowers.
- September 2023: Foro Holdings acquires Citi's Bridge platform, expanding access to capital for SMEs.
- August 2022: Arc Home selects Tavant to accelerate its digital transformation, enhancing customer experience.
- July 2022: Upstart partners with CDFIs to expand access to its AI lending platform, promoting financial inclusion.
In-Depth U.S Digital Lending Industry Market Outlook
The U.S. digital lending market is poised for continued robust growth, driven by technological innovations, increased adoption by both consumers and businesses, and expansion into underserved markets. Strategic partnerships and further regulatory clarity will be key factors influencing future market potential. The focus on personalized financial solutions and embedded finance will present significant opportunities for growth and market expansion in the coming years.
U.S Digital Lending Industry Segmentation
-
1. Type
-
1.1. Business
- 1.1.1. Business Digital Lending Market Dynamics
- 1.1.2. Business
- 1.1.3. Market Size Estimates and Forecasts
-
1.2. Consumer
- 1.2.1. Consumer Digital Lending Market Dynamics
- 1.2.2. Consumer
- 1.2.3. Consumer
-
1.1. Business
U.S Digital Lending Industry Segmentation By Geography
-
1. North America
- 1.1. United States
- 1.2. Canada
- 1.3. Mexico
-
2. South America
- 2.1. Brazil
- 2.2. Argentina
- 2.3. Rest of South America
-
3. Europe
- 3.1. United Kingdom
- 3.2. Germany
- 3.3. France
- 3.4. Italy
- 3.5. Spain
- 3.6. Russia
- 3.7. Benelux
- 3.8. Nordics
- 3.9. Rest of Europe
-
4. Middle East & Africa
- 4.1. Turkey
- 4.2. Israel
- 4.3. GCC
- 4.4. North Africa
- 4.5. South Africa
- 4.6. Rest of Middle East & Africa
-
5. Asia Pacific
- 5.1. China
- 5.2. India
- 5.3. Japan
- 5.4. South Korea
- 5.5. ASEAN
- 5.6. Oceania
- 5.7. Rest of Asia Pacific
U.S Digital Lending Industry REPORT HIGHLIGHTS
| Aspects | Details |
|---|---|
| Study Period | 2019-2033 |
| Base Year | 2024 |
| Estimated Year | 2025 |
| Forecast Period | 2025-2033 |
| Historical Period | 2019-2024 |
| Growth Rate | CAGR of 11.87% from 2019-2033 |
| Segmentation |
|
Table of Contents
- 1. Introduction
- 1.1. Research Scope
- 1.2. Market Segmentation
- 1.3. Research Methodology
- 1.4. Definitions and Assumptions
- 2. Executive Summary
- 2.1. Introduction
- 3. Market Dynamics
- 3.1. Introduction
- 3.2. Market Drivers
- 3.2.1. 5.1 Increasing Number of Potential Loan Purchasers with 'Digital Behavior'5.2 Increasing disposable income
- 3.3. Market Restrains
- 3.3.1. Low Light Sensing Capabilities Act as a Restraining Factor; Low-cost Sensors are Increasing the Threat to Scale Down the Quality
- 3.4. Market Trends
- 3.4.1. Increasing Number of Potential Loan Purchasers with Digital Behavior
- 4. Market Factor Analysis
- 4.1. Porters Five Forces
- 4.2. Supply/Value Chain
- 4.3. PESTEL analysis
- 4.4. Market Entropy
- 4.5. Patent/Trademark Analysis
- 5. Global U.S Digital Lending Industry Analysis, Insights and Forecast, 2019-2031
- 5.1. Market Analysis, Insights and Forecast - by Type
- 5.1.1. Business
- 5.1.1.1. Business Digital Lending Market Dynamics
- 5.1.1.2. Business
- 5.1.1.3. Market Size Estimates and Forecasts
- 5.1.2. Consumer
- 5.1.2.1. Consumer Digital Lending Market Dynamics
- 5.1.2.2. Consumer
- 5.1.2.3. Consumer
- 5.1.1. Business
- 5.2. Market Analysis, Insights and Forecast - by Region
- 5.2.1. North America
- 5.2.2. South America
- 5.2.3. Europe
- 5.2.4. Middle East & Africa
- 5.2.5. Asia Pacific
- 5.1. Market Analysis, Insights and Forecast - by Type
- 6. North America U.S Digital Lending Industry Analysis, Insights and Forecast, 2019-2031
- 6.1. Market Analysis, Insights and Forecast - by Type
- 6.1.1. Business
- 6.1.1.1. Business Digital Lending Market Dynamics
- 6.1.1.2. Business
- 6.1.1.3. Market Size Estimates and Forecasts
- 6.1.2. Consumer
- 6.1.2.1. Consumer Digital Lending Market Dynamics
- 6.1.2.2. Consumer
- 6.1.2.3. Consumer
- 6.1.1. Business
- 6.1. Market Analysis, Insights and Forecast - by Type
- 7. South America U.S Digital Lending Industry Analysis, Insights and Forecast, 2019-2031
- 7.1. Market Analysis, Insights and Forecast - by Type
- 7.1.1. Business
- 7.1.1.1. Business Digital Lending Market Dynamics
- 7.1.1.2. Business
- 7.1.1.3. Market Size Estimates and Forecasts
- 7.1.2. Consumer
- 7.1.2.1. Consumer Digital Lending Market Dynamics
- 7.1.2.2. Consumer
- 7.1.2.3. Consumer
- 7.1.1. Business
- 7.1. Market Analysis, Insights and Forecast - by Type
- 8. Europe U.S Digital Lending Industry Analysis, Insights and Forecast, 2019-2031
- 8.1. Market Analysis, Insights and Forecast - by Type
- 8.1.1. Business
- 8.1.1.1. Business Digital Lending Market Dynamics
- 8.1.1.2. Business
- 8.1.1.3. Market Size Estimates and Forecasts
- 8.1.2. Consumer
- 8.1.2.1. Consumer Digital Lending Market Dynamics
- 8.1.2.2. Consumer
- 8.1.2.3. Consumer
- 8.1.1. Business
- 8.1. Market Analysis, Insights and Forecast - by Type
- 9. Middle East & Africa U.S Digital Lending Industry Analysis, Insights and Forecast, 2019-2031
- 9.1. Market Analysis, Insights and Forecast - by Type
- 9.1.1. Business
- 9.1.1.1. Business Digital Lending Market Dynamics
- 9.1.1.2. Business
- 9.1.1.3. Market Size Estimates and Forecasts
- 9.1.2. Consumer
- 9.1.2.1. Consumer Digital Lending Market Dynamics
- 9.1.2.2. Consumer
- 9.1.2.3. Consumer
- 9.1.1. Business
- 9.1. Market Analysis, Insights and Forecast - by Type
- 10. Asia Pacific U.S Digital Lending Industry Analysis, Insights and Forecast, 2019-2031
- 10.1. Market Analysis, Insights and Forecast - by Type
- 10.1.1. Business
- 10.1.1.1. Business Digital Lending Market Dynamics
- 10.1.1.2. Business
- 10.1.1.3. Market Size Estimates and Forecasts
- 10.1.2. Consumer
- 10.1.2.1. Consumer Digital Lending Market Dynamics
- 10.1.2.2. Consumer
- 10.1.2.3. Consumer
- 10.1.1. Business
- 10.1. Market Analysis, Insights and Forecast - by Type
- 11. North America U.S Digital Lending Industry Analysis, Insights and Forecast, 2019-2031
- 11.1. Market Analysis, Insights and Forecast - By Country/Sub-region
- 11.1.1.
- 12. Europe U.S Digital Lending Industry Analysis, Insights and Forecast, 2019-2031
- 12.1. Market Analysis, Insights and Forecast - By Country/Sub-region
- 12.1.1.
- 13. Asia Pacific U.S Digital Lending Industry Analysis, Insights and Forecast, 2019-2031
- 13.1. Market Analysis, Insights and Forecast - By Country/Sub-region
- 13.1.1.
- 14. Latin America U.S Digital Lending Industry Analysis, Insights and Forecast, 2019-2031
- 14.1. Market Analysis, Insights and Forecast - By Country/Sub-region
- 14.1.1.
- 15. Middle East and Africa U.S Digital Lending Industry Analysis, Insights and Forecast, 2019-2031
- 15.1. Market Analysis, Insights and Forecast - By Country/Sub-region
- 15.1.1.
- 16. Competitive Analysis
- 16.1. Global Market Share Analysis 2024
- 16.2. Company Profiles
- 16.2.1 BizfiLLC
- 16.2.1.1. Overview
- 16.2.1.2. Products
- 16.2.1.3. SWOT Analysis
- 16.2.1.4. Recent Developments
- 16.2.1.5. Financials (Based on Availability)
- 16.2.2 LendingtreeInc *List Not Exhaustive
- 16.2.2.1. Overview
- 16.2.2.2. Products
- 16.2.2.3. SWOT Analysis
- 16.2.2.4. Recent Developments
- 16.2.2.5. Financials (Based on Availability)
- 16.2.3 CAN Capital Inc
- 16.2.3.1. Overview
- 16.2.3.2. Products
- 16.2.3.3. SWOT Analysis
- 16.2.3.4. Recent Developments
- 16.2.3.5. Financials (Based on Availability)
- 16.2.4 Upstart Network Inc
- 16.2.4.1. Overview
- 16.2.4.2. Products
- 16.2.4.3. SWOT Analysis
- 16.2.4.4. Recent Developments
- 16.2.4.5. Financials (Based on Availability)
- 16.2.5 Kiva Microfunds
- 16.2.5.1. Overview
- 16.2.5.2. Products
- 16.2.5.3. SWOT Analysis
- 16.2.5.4. Recent Developments
- 16.2.5.5. Financials (Based on Availability)
- 16.2.6 LendingClubCorp
- 16.2.6.1. Overview
- 16.2.6.2. Products
- 16.2.6.3. SWOT Analysis
- 16.2.6.4. Recent Developments
- 16.2.6.5. Financials (Based on Availability)
- 16.2.7 Social Finance Inc (SoFi)
- 16.2.7.1. Overview
- 16.2.7.2. Products
- 16.2.7.3. SWOT Analysis
- 16.2.7.4. Recent Developments
- 16.2.7.5. Financials (Based on Availability)
- 16.2.8 On Deck Capital Inc
- 16.2.8.1. Overview
- 16.2.8.2. Products
- 16.2.8.3. SWOT Analysis
- 16.2.8.4. Recent Developments
- 16.2.8.5. Financials (Based on Availability)
- 16.2.9 Kabbage Inc
- 16.2.9.1. Overview
- 16.2.9.2. Products
- 16.2.9.3. SWOT Analysis
- 16.2.9.4. Recent Developments
- 16.2.9.5. Financials (Based on Availability)
- 16.2.10 Prosper Marketplace Inc
- 16.2.10.1. Overview
- 16.2.10.2. Products
- 16.2.10.3. SWOT Analysis
- 16.2.10.4. Recent Developments
- 16.2.10.5. Financials (Based on Availability)
- 16.2.1 BizfiLLC
List of Figures
- Figure 1: Global U.S Digital Lending Industry Revenue Breakdown (Million, %) by Region 2024 & 2032
- Figure 2: North America U.S Digital Lending Industry Revenue (Million), by Country 2024 & 2032
- Figure 3: North America U.S Digital Lending Industry Revenue Share (%), by Country 2024 & 2032
- Figure 4: Europe U.S Digital Lending Industry Revenue (Million), by Country 2024 & 2032
- Figure 5: Europe U.S Digital Lending Industry Revenue Share (%), by Country 2024 & 2032
- Figure 6: Asia Pacific U.S Digital Lending Industry Revenue (Million), by Country 2024 & 2032
- Figure 7: Asia Pacific U.S Digital Lending Industry Revenue Share (%), by Country 2024 & 2032
- Figure 8: Latin America U.S Digital Lending Industry Revenue (Million), by Country 2024 & 2032
- Figure 9: Latin America U.S Digital Lending Industry Revenue Share (%), by Country 2024 & 2032
- Figure 10: Middle East and Africa U.S Digital Lending Industry Revenue (Million), by Country 2024 & 2032
- Figure 11: Middle East and Africa U.S Digital Lending Industry Revenue Share (%), by Country 2024 & 2032
- Figure 12: North America U.S Digital Lending Industry Revenue (Million), by Type 2024 & 2032
- Figure 13: North America U.S Digital Lending Industry Revenue Share (%), by Type 2024 & 2032
- Figure 14: North America U.S Digital Lending Industry Revenue (Million), by Country 2024 & 2032
- Figure 15: North America U.S Digital Lending Industry Revenue Share (%), by Country 2024 & 2032
- Figure 16: South America U.S Digital Lending Industry Revenue (Million), by Type 2024 & 2032
- Figure 17: South America U.S Digital Lending Industry Revenue Share (%), by Type 2024 & 2032
- Figure 18: South America U.S Digital Lending Industry Revenue (Million), by Country 2024 & 2032
- Figure 19: South America U.S Digital Lending Industry Revenue Share (%), by Country 2024 & 2032
- Figure 20: Europe U.S Digital Lending Industry Revenue (Million), by Type 2024 & 2032
- Figure 21: Europe U.S Digital Lending Industry Revenue Share (%), by Type 2024 & 2032
- Figure 22: Europe U.S Digital Lending Industry Revenue (Million), by Country 2024 & 2032
- Figure 23: Europe U.S Digital Lending Industry Revenue Share (%), by Country 2024 & 2032
- Figure 24: Middle East & Africa U.S Digital Lending Industry Revenue (Million), by Type 2024 & 2032
- Figure 25: Middle East & Africa U.S Digital Lending Industry Revenue Share (%), by Type 2024 & 2032
- Figure 26: Middle East & Africa U.S Digital Lending Industry Revenue (Million), by Country 2024 & 2032
- Figure 27: Middle East & Africa U.S Digital Lending Industry Revenue Share (%), by Country 2024 & 2032
- Figure 28: Asia Pacific U.S Digital Lending Industry Revenue (Million), by Type 2024 & 2032
- Figure 29: Asia Pacific U.S Digital Lending Industry Revenue Share (%), by Type 2024 & 2032
- Figure 30: Asia Pacific U.S Digital Lending Industry Revenue (Million), by Country 2024 & 2032
- Figure 31: Asia Pacific U.S Digital Lending Industry Revenue Share (%), by Country 2024 & 2032
List of Tables
- Table 1: Global U.S Digital Lending Industry Revenue Million Forecast, by Region 2019 & 2032
- Table 2: Global U.S Digital Lending Industry Revenue Million Forecast, by Type 2019 & 2032
- Table 3: Global U.S Digital Lending Industry Revenue Million Forecast, by Region 2019 & 2032
- Table 4: Global U.S Digital Lending Industry Revenue Million Forecast, by Country 2019 & 2032
- Table 5: U.S Digital Lending Industry Revenue (Million) Forecast, by Application 2019 & 2032
- Table 6: Global U.S Digital Lending Industry Revenue Million Forecast, by Country 2019 & 2032
- Table 7: U.S Digital Lending Industry Revenue (Million) Forecast, by Application 2019 & 2032
- Table 8: Global U.S Digital Lending Industry Revenue Million Forecast, by Country 2019 & 2032
- Table 9: U.S Digital Lending Industry Revenue (Million) Forecast, by Application 2019 & 2032
- Table 10: Global U.S Digital Lending Industry Revenue Million Forecast, by Country 2019 & 2032
- Table 11: U.S Digital Lending Industry Revenue (Million) Forecast, by Application 2019 & 2032
- Table 12: Global U.S Digital Lending Industry Revenue Million Forecast, by Country 2019 & 2032
- Table 13: U.S Digital Lending Industry Revenue (Million) Forecast, by Application 2019 & 2032
- Table 14: Global U.S Digital Lending Industry Revenue Million Forecast, by Type 2019 & 2032
- Table 15: Global U.S Digital Lending Industry Revenue Million Forecast, by Country 2019 & 2032
- Table 16: United States U.S Digital Lending Industry Revenue (Million) Forecast, by Application 2019 & 2032
- Table 17: Canada U.S Digital Lending Industry Revenue (Million) Forecast, by Application 2019 & 2032
- Table 18: Mexico U.S Digital Lending Industry Revenue (Million) Forecast, by Application 2019 & 2032
- Table 19: Global U.S Digital Lending Industry Revenue Million Forecast, by Type 2019 & 2032
- Table 20: Global U.S Digital Lending Industry Revenue Million Forecast, by Country 2019 & 2032
- Table 21: Brazil U.S Digital Lending Industry Revenue (Million) Forecast, by Application 2019 & 2032
- Table 22: Argentina U.S Digital Lending Industry Revenue (Million) Forecast, by Application 2019 & 2032
- Table 23: Rest of South America U.S Digital Lending Industry Revenue (Million) Forecast, by Application 2019 & 2032
- Table 24: Global U.S Digital Lending Industry Revenue Million Forecast, by Type 2019 & 2032
- Table 25: Global U.S Digital Lending Industry Revenue Million Forecast, by Country 2019 & 2032
- Table 26: United Kingdom U.S Digital Lending Industry Revenue (Million) Forecast, by Application 2019 & 2032
- Table 27: Germany U.S Digital Lending Industry Revenue (Million) Forecast, by Application 2019 & 2032
- Table 28: France U.S Digital Lending Industry Revenue (Million) Forecast, by Application 2019 & 2032
- Table 29: Italy U.S Digital Lending Industry Revenue (Million) Forecast, by Application 2019 & 2032
- Table 30: Spain U.S Digital Lending Industry Revenue (Million) Forecast, by Application 2019 & 2032
- Table 31: Russia U.S Digital Lending Industry Revenue (Million) Forecast, by Application 2019 & 2032
- Table 32: Benelux U.S Digital Lending Industry Revenue (Million) Forecast, by Application 2019 & 2032
- Table 33: Nordics U.S Digital Lending Industry Revenue (Million) Forecast, by Application 2019 & 2032
- Table 34: Rest of Europe U.S Digital Lending Industry Revenue (Million) Forecast, by Application 2019 & 2032
- Table 35: Global U.S Digital Lending Industry Revenue Million Forecast, by Type 2019 & 2032
- Table 36: Global U.S Digital Lending Industry Revenue Million Forecast, by Country 2019 & 2032
- Table 37: Turkey U.S Digital Lending Industry Revenue (Million) Forecast, by Application 2019 & 2032
- Table 38: Israel U.S Digital Lending Industry Revenue (Million) Forecast, by Application 2019 & 2032
- Table 39: GCC U.S Digital Lending Industry Revenue (Million) Forecast, by Application 2019 & 2032
- Table 40: North Africa U.S Digital Lending Industry Revenue (Million) Forecast, by Application 2019 & 2032
- Table 41: South Africa U.S Digital Lending Industry Revenue (Million) Forecast, by Application 2019 & 2032
- Table 42: Rest of Middle East & Africa U.S Digital Lending Industry Revenue (Million) Forecast, by Application 2019 & 2032
- Table 43: Global U.S Digital Lending Industry Revenue Million Forecast, by Type 2019 & 2032
- Table 44: Global U.S Digital Lending Industry Revenue Million Forecast, by Country 2019 & 2032
- Table 45: China U.S Digital Lending Industry Revenue (Million) Forecast, by Application 2019 & 2032
- Table 46: India U.S Digital Lending Industry Revenue (Million) Forecast, by Application 2019 & 2032
- Table 47: Japan U.S Digital Lending Industry Revenue (Million) Forecast, by Application 2019 & 2032
- Table 48: South Korea U.S Digital Lending Industry Revenue (Million) Forecast, by Application 2019 & 2032
- Table 49: ASEAN U.S Digital Lending Industry Revenue (Million) Forecast, by Application 2019 & 2032
- Table 50: Oceania U.S Digital Lending Industry Revenue (Million) Forecast, by Application 2019 & 2032
- Table 51: Rest of Asia Pacific U.S Digital Lending Industry Revenue (Million) Forecast, by Application 2019 & 2032
Frequently Asked Questions
1. What is the projected Compound Annual Growth Rate (CAGR) of the U.S Digital Lending Industry?
The projected CAGR is approximately 11.87%.
2. Which companies are prominent players in the U.S Digital Lending Industry?
Key companies in the market include BizfiLLC, LendingtreeInc *List Not Exhaustive, CAN Capital Inc, Upstart Network Inc, Kiva Microfunds, LendingClubCorp, Social Finance Inc (SoFi), On Deck Capital Inc, Kabbage Inc, Prosper Marketplace Inc.
3. What are the main segments of the U.S Digital Lending Industry?
The market segments include Type.
4. Can you provide details about the market size?
The market size is estimated to be USD 457.29 Million as of 2022.
5. What are some drivers contributing to market growth?
5.1 Increasing Number of Potential Loan Purchasers with 'Digital Behavior'5.2 Increasing disposable income.
6. What are the notable trends driving market growth?
Increasing Number of Potential Loan Purchasers with Digital Behavior.
7. Are there any restraints impacting market growth?
Low Light Sensing Capabilities Act as a Restraining Factor; Low-cost Sensors are Increasing the Threat to Scale Down the Quality.
8. Can you provide examples of recent developments in the market?
September 2023 - Payment Guard Insurance, a new lending solution offered by TruStage, a stable financial insurance, investment, and technology provider, was officially made available. As an inbuilt insurance solution for digital lenders and borrowers, the Payment Guard product is an innovative development in the insurance market for digital lending and was recently selected as a finalist for the Finovate Awards. It is intended to guard against sudden covered losses that can cause loan defaults. Borrowers are safeguarded in the case of a covered disability or job loss with TruStage Payment Guard Insurance.
9. What pricing options are available for accessing the report?
Pricing options include single-user, multi-user, and enterprise licenses priced at USD 3800, USD 4500, and USD 5800 respectively.
10. Is the market size provided in terms of value or volume?
The market size is provided in terms of value, measured in Million.
11. Are there any specific market keywords associated with the report?
Yes, the market keyword associated with the report is "U.S Digital Lending Industry," which aids in identifying and referencing the specific market segment covered.
12. How do I determine which pricing option suits my needs best?
The pricing options vary based on user requirements and access needs. Individual users may opt for single-user licenses, while businesses requiring broader access may choose multi-user or enterprise licenses for cost-effective access to the report.
13. Are there any additional resources or data provided in the U.S Digital Lending Industry report?
While the report offers comprehensive insights, it's advisable to review the specific contents or supplementary materials provided to ascertain if additional resources or data are available.
14. How can I stay updated on further developments or reports in the U.S Digital Lending Industry?
To stay informed about further developments, trends, and reports in the U.S Digital Lending Industry, consider subscribing to industry newsletters, following relevant companies and organizations, or regularly checking reputable industry news sources and publications.
Methodology
Step 1 - Identification of Relevant Samples Size from Population Database


Step 2 - Approaches for Defining Global Market Size (Value, Volume* & Price*)

Note*: In applicable scenarios
Step 3 - Data Sources
Primary Research
- Web Analytics
- Survey Reports
- Research Institute
- Latest Research Reports
- Opinion Leaders
Secondary Research
- Annual Reports
- White Paper
- Latest Press Release
- Industry Association
- Paid Database
- Investor Presentations

Step 4 - Data Triangulation
Involves using different sources of information in order to increase the validity of a study
These sources are likely to be stakeholders in a program - participants, other researchers, program staff, other community members, and so on.
Then we put all data in single framework & apply various statistical tools to find out the dynamic on the market.
During the analysis stage, feedback from the stakeholder groups would be compared to determine areas of agreement as well as areas of divergence


