
Key Insights
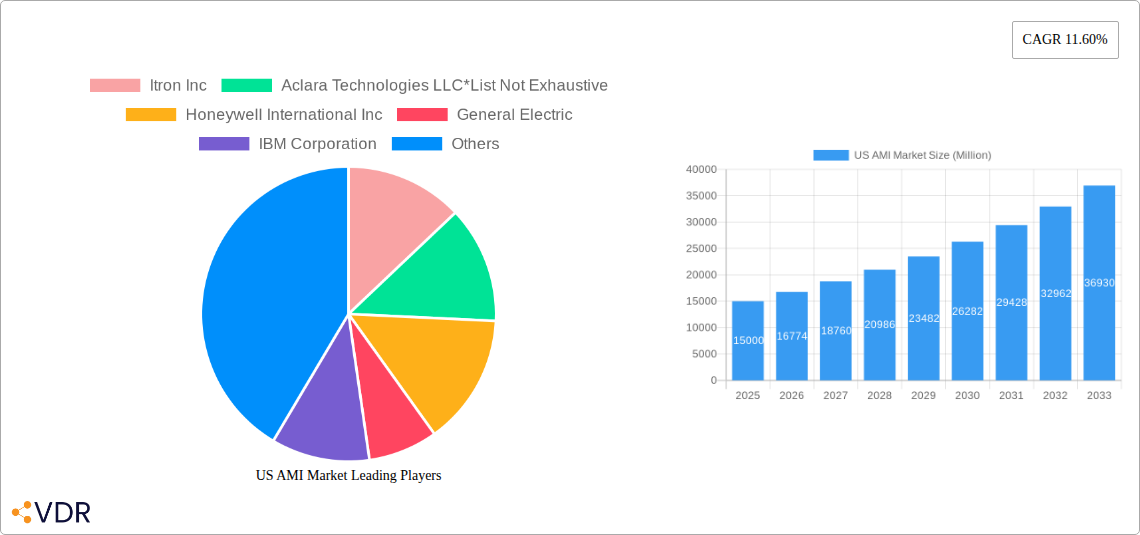
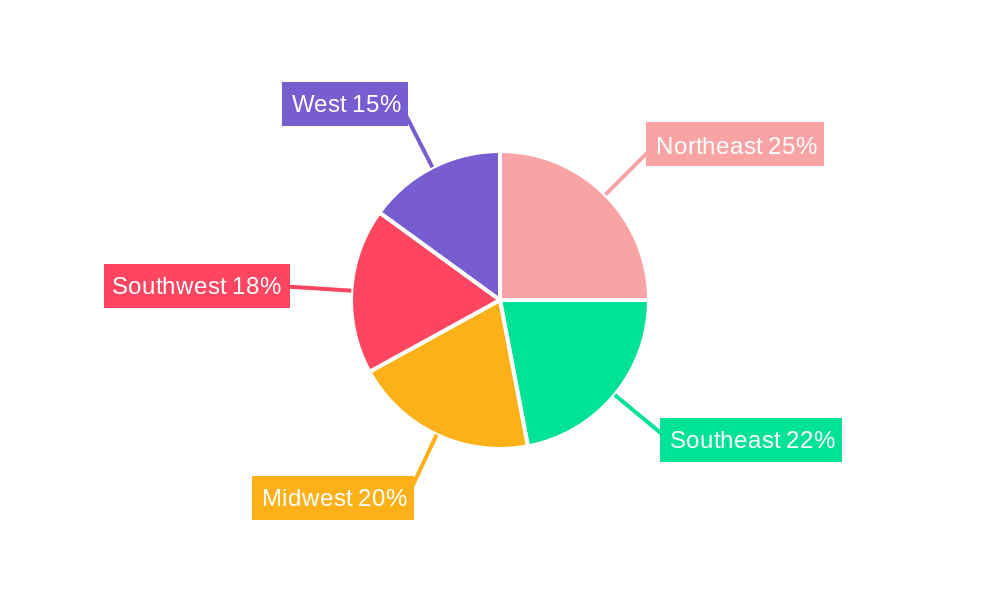
The US Advanced Metering Infrastructure (AMI) market is experiencing robust growth, driven by increasing demand for energy efficiency, improved grid management, and the rise of smart cities initiatives. The market, segmented by device type (electricity, water, and gas smart meters), solution (hardware, software, and services), and end-user (residential, commercial, and industrial), shows significant potential across all segments. The 11.60% CAGR indicates a strong upward trajectory, particularly in the smart electricity meter segment, which is anticipated to dominate due to government regulations promoting energy conservation and the integration of renewable energy sources. Software solutions, specifically Meter Data Management (MDM) and Meter Data Analytics (MDA), are witnessing accelerated adoption as utilities leverage data-driven insights for optimized grid operations and improved customer service. The services segment, encompassing professional services like program management, deployment, and consulting, is also expanding, reflecting the need for expert guidance in AMI implementation and integration. Major players like Itron, Aclara, Honeywell, and GE are leading the market, investing heavily in R&D and strategic partnerships to maintain their competitive edge. While the market faces certain restraints such as high initial investment costs and cybersecurity concerns, these challenges are being addressed through innovative financing models and enhanced security protocols. The regional breakdown across the US (Northeast, Southeast, Midwest, Southwest, and West) reveals varying adoption rates, influenced by factors like regulatory landscapes, population density, and the prevalence of smart city projects.
The forecast period of 2025-2033 anticipates continued market expansion, with significant growth projected in the commercial and industrial sectors as businesses seek to optimize energy consumption and reduce operational costs. The increasing adoption of smart city initiatives and the integration of AMI with other smart grid technologies like distributed generation and energy storage systems will further fuel market growth. The rise of Internet of Things (IoT) technologies and the increasing adoption of cloud-based solutions are also contributing factors. Continued innovation in meter technology, focusing on enhanced accuracy, durability, and communication capabilities, will be crucial in driving market expansion. The competitive landscape will likely remain dynamic, with mergers, acquisitions, and strategic collaborations shaping the future of the US AMI market.
US AMI Market Report: 2019-2033 Forecast
This comprehensive report provides an in-depth analysis of the US Advanced Metering Infrastructure (AMI) market, encompassing historical data (2019-2024), current estimates (2025), and future projections (2025-2033). The report segments the market by type (electricity, water, and gas smart metering devices), solution, software (meter data management, meter data analytics, other software), services (professional services, managed services), and end-user (residential, commercial, industrial). This detailed breakdown offers invaluable insights for industry professionals, investors, and strategic decision-makers. The market is expected to reach xx million units by 2033.
US AMI Market Dynamics & Structure
The US AMI market is characterized by a moderately concentrated landscape, with key players like Itron Inc, Aclara Technologies LLC, Honeywell International Inc, General Electric, and IBM Corporation holding significant market share. However, the presence of several smaller, specialized firms fosters competition. Technological innovation, driven by advancements in communication technologies (e.g., NB-IoT, LTE-M) and data analytics capabilities, is a major growth driver. Stringent regulatory frameworks promoting energy efficiency and grid modernization, coupled with government incentives, further propel market expansion. The market faces competition from traditional metering systems but the benefits of real-time data, improved grid management, and reduced operational costs outweigh the higher initial investment.
- Market Concentration: Moderately concentrated, with top 5 players holding approximately xx% market share (2025).
- Technological Innovation: Significant advancements in communication protocols, data analytics, and AI-driven solutions.
- Regulatory Framework: Supportive regulations promoting smart grid initiatives and energy efficiency.
- Competitive Substitutes: Traditional metering systems, but AMI's benefits are increasingly favored.
- End-User Demographics: Residential segment dominates, followed by commercial and industrial segments.
- M&A Trends: Consolidation expected, with larger players acquiring smaller firms to expand capabilities and market reach. xx M&A deals projected for 2025-2033.
US AMI Market Growth Trends & Insights
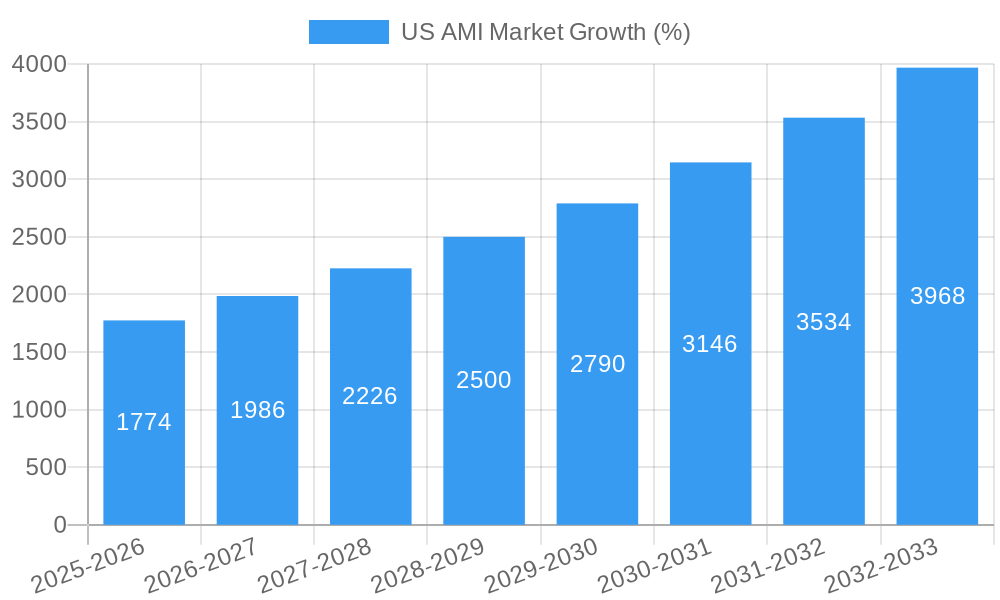
The US AMI market exhibits robust growth, driven by increasing demand for efficient energy management and grid modernization. The market size experienced significant growth during the historical period (2019-2024), with a CAGR of xx%. This trend is expected to continue during the forecast period (2025-2033), driven by factors such as rising energy costs, increasing adoption of smart grids, and improved data analytics capabilities. The residential segment is expected to witness the highest growth rate, fueled by government incentives and rising consumer awareness regarding energy conservation. Technological disruptions, like the adoption of advanced communication protocols and AI-powered solutions for meter data management, further contribute to market expansion. Consumer behavior shifts are reflected in growing demand for real-time energy monitoring and remote meter reading capabilities. Market penetration is expected to reach xx% by 2033.
Dominant Regions, Countries, or Segments in US AMI Market
The US AMI market demonstrates strong growth across various regions, with significant variation depending on the specific segment. The western and eastern coastal states, owing to the high population density and established smart grid infrastructure, are projected to display considerable market growth, followed by the southern states.
- Type: Smart electricity metering devices dominate the market, followed by water and gas meters, with xx million, yy million, and zz million units respectively in 2025.
- Solution: End-to-end AMI solutions are gaining popularity due to their comprehensive functionalities.
- Software: Meter Data Management (MDM) software segment dominates, given its critical role in data processing and analysis.
- Services: Professional services, particularly program management and deployment consulting, are essential for successful AMI implementation.
- End-user: The residential sector accounts for the largest market share, attributed to the extensive number of residential properties.
US AMI Market Product Landscape
The US AMI market presents a diverse range of products, from simple smart meters to sophisticated systems integrating various communication protocols, data analytics, and energy management functionalities. Innovative products incorporate advanced features such as two-way communication, real-time data monitoring, and remote meter reading, enhancing operational efficiency and customer experience. Continuous advancements in communication technologies (e.g., narrowband IoT, LTE-M) are enhancing the reliability and scalability of AMI networks. Key selling propositions revolve around reduced operational costs, improved energy efficiency, and enhanced grid management capabilities.
Key Drivers, Barriers & Challenges in US AMI Market
Key Drivers: Government initiatives promoting smart grid modernization, rising energy costs, and the need for improved grid management are major drivers. Technological advancements in communication technologies and data analytics also play a crucial role.
Key Barriers & Challenges: High initial investment costs for AMI deployment can be a barrier. Interoperability issues between different AMI systems and the need for robust cybersecurity measures present challenges. Regulatory hurdles and supply chain disruptions also influence market growth. The impact of these challenges is estimated to decrease the market growth by approximately xx% by 2033.
Emerging Opportunities in US AMI Market
Emerging opportunities lie in the growing adoption of advanced metering infrastructure in rural areas and expanding applications in the industrial sector. The integration of AMI with other smart city initiatives offers significant potential. Growing focus on cybersecurity and data privacy presents opportunities for specialized solutions. The increasing demand for real-time energy monitoring and predictive maintenance applications will drive market growth.
Growth Accelerators in the US AMI Market Industry
The US AMI market is expected to witness sustained growth fueled by technological advancements in artificial intelligence and machine learning, enabling predictive maintenance and optimized energy consumption. Strategic partnerships between AMI providers and utility companies will be instrumental in accelerating market expansion. Government support and funding for smart grid modernization initiatives will further bolster the market's trajectory. Expansion into underserved markets and the development of innovative applications will also drive growth.
Key Players Shaping the US AMI Market Market
- Itron Inc
- Aclara Technologies LLC
- Honeywell International Inc
- General Electric
- IBM Corporation
- Oncor Electric Delivery Company LLC
- NuriFlex Inc
- Cisco Systems Inc
- Mueller Systems LLC
- Eaton Corporation
Notable Milestones in US AMI Market Sector
- April 2022: Otter Tail Power Company selects TRC Companies for AMI system integration.
- April 2021: Austin Utilities deploys Aclara's AMI solution for electric, gas, and water meters.
- March 2021: Calaveras County Water District partners with Mueller Systems for AMI network deployment.
In-Depth US AMI Market Market Outlook
The US AMI market is poised for significant growth in the coming years, driven by increasing demand for efficient energy management, grid modernization, and the integration of AMI with other smart city initiatives. The continued advancements in communication technologies, data analytics, and AI-driven solutions will further accelerate market expansion. Strategic partnerships and government support will be key factors driving long-term growth and unlocking lucrative opportunities for companies in this sector. The focus on enhanced cybersecurity and data privacy will also shape future market trends.
US AMI Market Segmentation
-
1. Type
- 1.1. Smart Me
-
1.2. Solution
- 1.2.1. Meter Communication Infrastructure (Solution)
-
1.2.2. Software
- 1.2.2.1. Meter Data Management
- 1.2.2.2. Meter Data Analytics
- 1.2.2.3. Other Software Types
- 1.3. Services
-
2. End-user
- 2.1. Residential
- 2.2. Commercial
- 2.3. Industrial
US AMI Market Segmentation By Geography
-
1. North America
- 1.1. United States
- 1.2. Canada
- 1.3. Mexico
-
2. South America
- 2.1. Brazil
- 2.2. Argentina
- 2.3. Rest of South America
-
3. Europe
- 3.1. United Kingdom
- 3.2. Germany
- 3.3. France
- 3.4. Italy
- 3.5. Spain
- 3.6. Russia
- 3.7. Benelux
- 3.8. Nordics
- 3.9. Rest of Europe
-
4. Middle East & Africa
- 4.1. Turkey
- 4.2. Israel
- 4.3. GCC
- 4.4. North Africa
- 4.5. South Africa
- 4.6. Rest of Middle East & Africa
-
5. Asia Pacific
- 5.1. China
- 5.2. India
- 5.3. Japan
- 5.4. South Korea
- 5.5. ASEAN
- 5.6. Oceania
- 5.7. Rest of Asia Pacific
US AMI Market REPORT HIGHLIGHTS
| Aspects | Details |
|---|---|
| Study Period | 2019-2033 |
| Base Year | 2024 |
| Estimated Year | 2025 |
| Forecast Period | 2025-2033 |
| Historical Period | 2019-2024 |
| Growth Rate | CAGR of 11.60% from 2019-2033 |
| Segmentation |
|
Table of Contents
- 1. Introduction
- 1.1. Research Scope
- 1.2. Market Segmentation
- 1.3. Research Methodology
- 1.4. Definitions and Assumptions
- 2. Executive Summary
- 2.1. Introduction
- 3. Market Dynamics
- 3.1. Introduction
- 3.2. Market Drivers
- 3.2.1. Shift Toward Energy Efficient Alternatives; Favorable Governmental Initiatives Driving Adoption Initiatives
- 3.3. Market Restrains
- 3.3.1. Data Pricacy Concerns
- 3.4. Market Trends
- 3.4.1. Smart Metering Devices will Command a Significant Market Share
- 4. Market Factor Analysis
- 4.1. Porters Five Forces
- 4.2. Supply/Value Chain
- 4.3. PESTEL analysis
- 4.4. Market Entropy
- 4.5. Patent/Trademark Analysis
- 5. Global US AMI Market Analysis, Insights and Forecast, 2019-2031
- 5.1. Market Analysis, Insights and Forecast - by Type
- 5.1.1. Smart Me
- 5.1.2. Solution
- 5.1.2.1. Meter Communication Infrastructure (Solution)
- 5.1.2.2. Software
- 5.1.2.2.1. Meter Data Management
- 5.1.2.2.2. Meter Data Analytics
- 5.1.2.2.3. Other Software Types
- 5.1.3. Services
- 5.2. Market Analysis, Insights and Forecast - by End-user
- 5.2.1. Residential
- 5.2.2. Commercial
- 5.2.3. Industrial
- 5.3. Market Analysis, Insights and Forecast - by Region
- 5.3.1. North America
- 5.3.2. South America
- 5.3.3. Europe
- 5.3.4. Middle East & Africa
- 5.3.5. Asia Pacific
- 5.1. Market Analysis, Insights and Forecast - by Type
- 6. North America US AMI Market Analysis, Insights and Forecast, 2019-2031
- 6.1. Market Analysis, Insights and Forecast - by Type
- 6.1.1. Smart Me
- 6.1.2. Solution
- 6.1.2.1. Meter Communication Infrastructure (Solution)
- 6.1.2.2. Software
- 6.1.2.2.1. Meter Data Management
- 6.1.2.2.2. Meter Data Analytics
- 6.1.2.2.3. Other Software Types
- 6.1.3. Services
- 6.2. Market Analysis, Insights and Forecast - by End-user
- 6.2.1. Residential
- 6.2.2. Commercial
- 6.2.3. Industrial
- 6.1. Market Analysis, Insights and Forecast - by Type
- 7. South America US AMI Market Analysis, Insights and Forecast, 2019-2031
- 7.1. Market Analysis, Insights and Forecast - by Type
- 7.1.1. Smart Me
- 7.1.2. Solution
- 7.1.2.1. Meter Communication Infrastructure (Solution)
- 7.1.2.2. Software
- 7.1.2.2.1. Meter Data Management
- 7.1.2.2.2. Meter Data Analytics
- 7.1.2.2.3. Other Software Types
- 7.1.3. Services
- 7.2. Market Analysis, Insights and Forecast - by End-user
- 7.2.1. Residential
- 7.2.2. Commercial
- 7.2.3. Industrial
- 7.1. Market Analysis, Insights and Forecast - by Type
- 8. Europe US AMI Market Analysis, Insights and Forecast, 2019-2031
- 8.1. Market Analysis, Insights and Forecast - by Type
- 8.1.1. Smart Me
- 8.1.2. Solution
- 8.1.2.1. Meter Communication Infrastructure (Solution)
- 8.1.2.2. Software
- 8.1.2.2.1. Meter Data Management
- 8.1.2.2.2. Meter Data Analytics
- 8.1.2.2.3. Other Software Types
- 8.1.3. Services
- 8.2. Market Analysis, Insights and Forecast - by End-user
- 8.2.1. Residential
- 8.2.2. Commercial
- 8.2.3. Industrial
- 8.1. Market Analysis, Insights and Forecast - by Type
- 9. Middle East & Africa US AMI Market Analysis, Insights and Forecast, 2019-2031
- 9.1. Market Analysis, Insights and Forecast - by Type
- 9.1.1. Smart Me
- 9.1.2. Solution
- 9.1.2.1. Meter Communication Infrastructure (Solution)
- 9.1.2.2. Software
- 9.1.2.2.1. Meter Data Management
- 9.1.2.2.2. Meter Data Analytics
- 9.1.2.2.3. Other Software Types
- 9.1.3. Services
- 9.2. Market Analysis, Insights and Forecast - by End-user
- 9.2.1. Residential
- 9.2.2. Commercial
- 9.2.3. Industrial
- 9.1. Market Analysis, Insights and Forecast - by Type
- 10. Asia Pacific US AMI Market Analysis, Insights and Forecast, 2019-2031
- 10.1. Market Analysis, Insights and Forecast - by Type
- 10.1.1. Smart Me
- 10.1.2. Solution
- 10.1.2.1. Meter Communication Infrastructure (Solution)
- 10.1.2.2. Software
- 10.1.2.2.1. Meter Data Management
- 10.1.2.2.2. Meter Data Analytics
- 10.1.2.2.3. Other Software Types
- 10.1.3. Services
- 10.2. Market Analysis, Insights and Forecast - by End-user
- 10.2.1. Residential
- 10.2.2. Commercial
- 10.2.3. Industrial
- 10.1. Market Analysis, Insights and Forecast - by Type
- 11. Northeast US AMI Market Analysis, Insights and Forecast, 2019-2031
- 12. Southeast US AMI Market Analysis, Insights and Forecast, 2019-2031
- 13. Midwest US AMI Market Analysis, Insights and Forecast, 2019-2031
- 14. Southwest US AMI Market Analysis, Insights and Forecast, 2019-2031
- 15. West US AMI Market Analysis, Insights and Forecast, 2019-2031
- 16. Competitive Analysis
- 16.1. Global Market Share Analysis 2024
- 16.2. Company Profiles
- 16.2.1 Itron Inc
- 16.2.1.1. Overview
- 16.2.1.2. Products
- 16.2.1.3. SWOT Analysis
- 16.2.1.4. Recent Developments
- 16.2.1.5. Financials (Based on Availability)
- 16.2.2 Aclara Technologies LLC*List Not Exhaustive
- 16.2.2.1. Overview
- 16.2.2.2. Products
- 16.2.2.3. SWOT Analysis
- 16.2.2.4. Recent Developments
- 16.2.2.5. Financials (Based on Availability)
- 16.2.3 Honeywell International Inc
- 16.2.3.1. Overview
- 16.2.3.2. Products
- 16.2.3.3. SWOT Analysis
- 16.2.3.4. Recent Developments
- 16.2.3.5. Financials (Based on Availability)
- 16.2.4 General Electric
- 16.2.4.1. Overview
- 16.2.4.2. Products
- 16.2.4.3. SWOT Analysis
- 16.2.4.4. Recent Developments
- 16.2.4.5. Financials (Based on Availability)
- 16.2.5 IBM Corporation
- 16.2.5.1. Overview
- 16.2.5.2. Products
- 16.2.5.3. SWOT Analysis
- 16.2.5.4. Recent Developments
- 16.2.5.5. Financials (Based on Availability)
- 16.2.6 Oncor Electric Delivery Company LLC
- 16.2.6.1. Overview
- 16.2.6.2. Products
- 16.2.6.3. SWOT Analysis
- 16.2.6.4. Recent Developments
- 16.2.6.5. Financials (Based on Availability)
- 16.2.7 NuriFlex Inc
- 16.2.7.1. Overview
- 16.2.7.2. Products
- 16.2.7.3. SWOT Analysis
- 16.2.7.4. Recent Developments
- 16.2.7.5. Financials (Based on Availability)
- 16.2.8 Cisco Systems Inc
- 16.2.8.1. Overview
- 16.2.8.2. Products
- 16.2.8.3. SWOT Analysis
- 16.2.8.4. Recent Developments
- 16.2.8.5. Financials (Based on Availability)
- 16.2.9 Mueller Systems LLC
- 16.2.9.1. Overview
- 16.2.9.2. Products
- 16.2.9.3. SWOT Analysis
- 16.2.9.4. Recent Developments
- 16.2.9.5. Financials (Based on Availability)
- 16.2.10 Eaton Corporation
- 16.2.10.1. Overview
- 16.2.10.2. Products
- 16.2.10.3. SWOT Analysis
- 16.2.10.4. Recent Developments
- 16.2.10.5. Financials (Based on Availability)
- 16.2.1 Itron Inc
List of Figures
- Figure 1: Global US AMI Market Revenue Breakdown (Million, %) by Region 2024 & 2032
- Figure 2: United states US AMI Market Revenue (Million), by Country 2024 & 2032
- Figure 3: United states US AMI Market Revenue Share (%), by Country 2024 & 2032
- Figure 4: North America US AMI Market Revenue (Million), by Type 2024 & 2032
- Figure 5: North America US AMI Market Revenue Share (%), by Type 2024 & 2032
- Figure 6: North America US AMI Market Revenue (Million), by End-user 2024 & 2032
- Figure 7: North America US AMI Market Revenue Share (%), by End-user 2024 & 2032
- Figure 8: North America US AMI Market Revenue (Million), by Country 2024 & 2032
- Figure 9: North America US AMI Market Revenue Share (%), by Country 2024 & 2032
- Figure 10: South America US AMI Market Revenue (Million), by Type 2024 & 2032
- Figure 11: South America US AMI Market Revenue Share (%), by Type 2024 & 2032
- Figure 12: South America US AMI Market Revenue (Million), by End-user 2024 & 2032
- Figure 13: South America US AMI Market Revenue Share (%), by End-user 2024 & 2032
- Figure 14: South America US AMI Market Revenue (Million), by Country 2024 & 2032
- Figure 15: South America US AMI Market Revenue Share (%), by Country 2024 & 2032
- Figure 16: Europe US AMI Market Revenue (Million), by Type 2024 & 2032
- Figure 17: Europe US AMI Market Revenue Share (%), by Type 2024 & 2032
- Figure 18: Europe US AMI Market Revenue (Million), by End-user 2024 & 2032
- Figure 19: Europe US AMI Market Revenue Share (%), by End-user 2024 & 2032
- Figure 20: Europe US AMI Market Revenue (Million), by Country 2024 & 2032
- Figure 21: Europe US AMI Market Revenue Share (%), by Country 2024 & 2032
- Figure 22: Middle East & Africa US AMI Market Revenue (Million), by Type 2024 & 2032
- Figure 23: Middle East & Africa US AMI Market Revenue Share (%), by Type 2024 & 2032
- Figure 24: Middle East & Africa US AMI Market Revenue (Million), by End-user 2024 & 2032
- Figure 25: Middle East & Africa US AMI Market Revenue Share (%), by End-user 2024 & 2032
- Figure 26: Middle East & Africa US AMI Market Revenue (Million), by Country 2024 & 2032
- Figure 27: Middle East & Africa US AMI Market Revenue Share (%), by Country 2024 & 2032
- Figure 28: Asia Pacific US AMI Market Revenue (Million), by Type 2024 & 2032
- Figure 29: Asia Pacific US AMI Market Revenue Share (%), by Type 2024 & 2032
- Figure 30: Asia Pacific US AMI Market Revenue (Million), by End-user 2024 & 2032
- Figure 31: Asia Pacific US AMI Market Revenue Share (%), by End-user 2024 & 2032
- Figure 32: Asia Pacific US AMI Market Revenue (Million), by Country 2024 & 2032
- Figure 33: Asia Pacific US AMI Market Revenue Share (%), by Country 2024 & 2032
List of Tables
- Table 1: Global US AMI Market Revenue Million Forecast, by Region 2019 & 2032
- Table 2: Global US AMI Market Revenue Million Forecast, by Type 2019 & 2032
- Table 3: Global US AMI Market Revenue Million Forecast, by End-user 2019 & 2032
- Table 4: Global US AMI Market Revenue Million Forecast, by Region 2019 & 2032
- Table 5: Global US AMI Market Revenue Million Forecast, by Country 2019 & 2032
- Table 6: Northeast US AMI Market Revenue (Million) Forecast, by Application 2019 & 2032
- Table 7: Southeast US AMI Market Revenue (Million) Forecast, by Application 2019 & 2032
- Table 8: Midwest US AMI Market Revenue (Million) Forecast, by Application 2019 & 2032
- Table 9: Southwest US AMI Market Revenue (Million) Forecast, by Application 2019 & 2032
- Table 10: West US AMI Market Revenue (Million) Forecast, by Application 2019 & 2032
- Table 11: Global US AMI Market Revenue Million Forecast, by Type 2019 & 2032
- Table 12: Global US AMI Market Revenue Million Forecast, by End-user 2019 & 2032
- Table 13: Global US AMI Market Revenue Million Forecast, by Country 2019 & 2032
- Table 14: United States US AMI Market Revenue (Million) Forecast, by Application 2019 & 2032
- Table 15: Canada US AMI Market Revenue (Million) Forecast, by Application 2019 & 2032
- Table 16: Mexico US AMI Market Revenue (Million) Forecast, by Application 2019 & 2032
- Table 17: Global US AMI Market Revenue Million Forecast, by Type 2019 & 2032
- Table 18: Global US AMI Market Revenue Million Forecast, by End-user 2019 & 2032
- Table 19: Global US AMI Market Revenue Million Forecast, by Country 2019 & 2032
- Table 20: Brazil US AMI Market Revenue (Million) Forecast, by Application 2019 & 2032
- Table 21: Argentina US AMI Market Revenue (Million) Forecast, by Application 2019 & 2032
- Table 22: Rest of South America US AMI Market Revenue (Million) Forecast, by Application 2019 & 2032
- Table 23: Global US AMI Market Revenue Million Forecast, by Type 2019 & 2032
- Table 24: Global US AMI Market Revenue Million Forecast, by End-user 2019 & 2032
- Table 25: Global US AMI Market Revenue Million Forecast, by Country 2019 & 2032
- Table 26: United Kingdom US AMI Market Revenue (Million) Forecast, by Application 2019 & 2032
- Table 27: Germany US AMI Market Revenue (Million) Forecast, by Application 2019 & 2032
- Table 28: France US AMI Market Revenue (Million) Forecast, by Application 2019 & 2032
- Table 29: Italy US AMI Market Revenue (Million) Forecast, by Application 2019 & 2032
- Table 30: Spain US AMI Market Revenue (Million) Forecast, by Application 2019 & 2032
- Table 31: Russia US AMI Market Revenue (Million) Forecast, by Application 2019 & 2032
- Table 32: Benelux US AMI Market Revenue (Million) Forecast, by Application 2019 & 2032
- Table 33: Nordics US AMI Market Revenue (Million) Forecast, by Application 2019 & 2032
- Table 34: Rest of Europe US AMI Market Revenue (Million) Forecast, by Application 2019 & 2032
- Table 35: Global US AMI Market Revenue Million Forecast, by Type 2019 & 2032
- Table 36: Global US AMI Market Revenue Million Forecast, by End-user 2019 & 2032
- Table 37: Global US AMI Market Revenue Million Forecast, by Country 2019 & 2032
- Table 38: Turkey US AMI Market Revenue (Million) Forecast, by Application 2019 & 2032
- Table 39: Israel US AMI Market Revenue (Million) Forecast, by Application 2019 & 2032
- Table 40: GCC US AMI Market Revenue (Million) Forecast, by Application 2019 & 2032
- Table 41: North Africa US AMI Market Revenue (Million) Forecast, by Application 2019 & 2032
- Table 42: South Africa US AMI Market Revenue (Million) Forecast, by Application 2019 & 2032
- Table 43: Rest of Middle East & Africa US AMI Market Revenue (Million) Forecast, by Application 2019 & 2032
- Table 44: Global US AMI Market Revenue Million Forecast, by Type 2019 & 2032
- Table 45: Global US AMI Market Revenue Million Forecast, by End-user 2019 & 2032
- Table 46: Global US AMI Market Revenue Million Forecast, by Country 2019 & 2032
- Table 47: China US AMI Market Revenue (Million) Forecast, by Application 2019 & 2032
- Table 48: India US AMI Market Revenue (Million) Forecast, by Application 2019 & 2032
- Table 49: Japan US AMI Market Revenue (Million) Forecast, by Application 2019 & 2032
- Table 50: South Korea US AMI Market Revenue (Million) Forecast, by Application 2019 & 2032
- Table 51: ASEAN US AMI Market Revenue (Million) Forecast, by Application 2019 & 2032
- Table 52: Oceania US AMI Market Revenue (Million) Forecast, by Application 2019 & 2032
- Table 53: Rest of Asia Pacific US AMI Market Revenue (Million) Forecast, by Application 2019 & 2032
Frequently Asked Questions
1. What is the projected Compound Annual Growth Rate (CAGR) of the US AMI Market?
The projected CAGR is approximately 11.60%.
2. Which companies are prominent players in the US AMI Market?
Key companies in the market include Itron Inc, Aclara Technologies LLC*List Not Exhaustive, Honeywell International Inc, General Electric, IBM Corporation, Oncor Electric Delivery Company LLC, NuriFlex Inc, Cisco Systems Inc, Mueller Systems LLC, Eaton Corporation.
3. What are the main segments of the US AMI Market?
The market segments include Type, End-user.
4. Can you provide details about the market size?
The market size is estimated to be USD XX Million as of 2022.
5. What are some drivers contributing to market growth?
Shift Toward Energy Efficient Alternatives; Favorable Governmental Initiatives Driving Adoption Initiatives.
6. What are the notable trends driving market growth?
Smart Metering Devices will Command a Significant Market Share.
7. Are there any restraints impacting market growth?
Data Pricacy Concerns.
8. Can you provide examples of recent developments in the market?
April 2022 - Otter Tail Power Company chose TRC Companies (TRC) to serve as a systems integrator for their advanced metering infrastructure (AMI) program. The project serves a large area in northwestern Minnesota, eastern North Dakota, and northeastern South Dakota. TRC will assist program management with system integration while collaborating with software and hardware providers across Otter Tail Power's AMI, meter data management (MDM), and customer information systems.
9. What pricing options are available for accessing the report?
Pricing options include single-user, multi-user, and enterprise licenses priced at USD 3800, USD 4500, and USD 5800 respectively.
10. Is the market size provided in terms of value or volume?
The market size is provided in terms of value, measured in Million.
11. Are there any specific market keywords associated with the report?
Yes, the market keyword associated with the report is "US AMI Market," which aids in identifying and referencing the specific market segment covered.
12. How do I determine which pricing option suits my needs best?
The pricing options vary based on user requirements and access needs. Individual users may opt for single-user licenses, while businesses requiring broader access may choose multi-user or enterprise licenses for cost-effective access to the report.
13. Are there any additional resources or data provided in the US AMI Market report?
While the report offers comprehensive insights, it's advisable to review the specific contents or supplementary materials provided to ascertain if additional resources or data are available.
14. How can I stay updated on further developments or reports in the US AMI Market?
To stay informed about further developments, trends, and reports in the US AMI Market, consider subscribing to industry newsletters, following relevant companies and organizations, or regularly checking reputable industry news sources and publications.
Methodology
Step 1 - Identification of Relevant Samples Size from Population Database


Step 2 - Approaches for Defining Global Market Size (Value, Volume* & Price*)

Note*: In applicable scenarios
Step 3 - Data Sources
Primary Research
- Web Analytics
- Survey Reports
- Research Institute
- Latest Research Reports
- Opinion Leaders
Secondary Research
- Annual Reports
- White Paper
- Latest Press Release
- Industry Association
- Paid Database
- Investor Presentations

Step 4 - Data Triangulation
Involves using different sources of information in order to increase the validity of a study
These sources are likely to be stakeholders in a program - participants, other researchers, program staff, other community members, and so on.
Then we put all data in single framework & apply various statistical tools to find out the dynamic on the market.
During the analysis stage, feedback from the stakeholder groups would be compared to determine areas of agreement as well as areas of divergence


