
Key Insights
The United States proximity sensor market is experiencing robust growth, driven by increasing automation across diverse sectors. The market's Compound Annual Growth Rate (CAGR) of 7.10% from 2019 to 2024 suggests a strong trajectory, projected to continue through 2033. Key drivers include the rising adoption of automation in industrial settings (particularly automotive and industrial automation), the expanding consumer electronics market demanding more sophisticated sensing technologies, and the growing need for enhanced safety and efficiency in sectors like aerospace and defense. The market is segmented by technology (inductive, capacitive, photoelectric, magnetic, ultrasonic, others), channel type (single and multi-channel), and end-user industry. While inductive and capacitive sensors currently dominate, the increasing demand for higher precision and longer-range detection is fueling the growth of photoelectric and ultrasonic sensors. Multi-channel sensors are gaining traction due to their ability to provide more comprehensive data, leading to improved process control and automation. Within the end-user segment, the automotive industry is a significant contributor to market expansion due to the increasing integration of advanced driver-assistance systems (ADAS) and autonomous driving technologies. The industrial automation sector is also a major driver, as manufacturers leverage proximity sensors for robotic control, process monitoring, and quality assurance. While supply chain constraints and potential economic downturns pose some challenges, the long-term outlook for the US proximity sensor market remains positive, fueled by continuous technological advancements and increasing demand for automation across various industries.
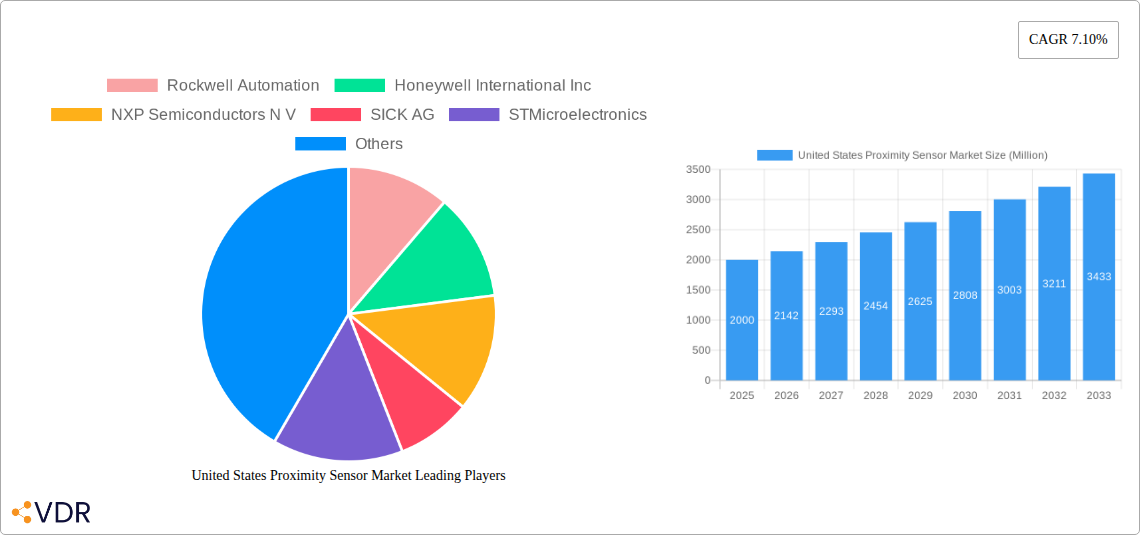
The substantial growth in the US proximity sensor market reflects a broader global trend. Considering the 7.10% CAGR and a reasonably estimated 2025 US market size of $2 billion (this is an estimate based on global market size data and the significant US market share typically seen in advanced technology sectors), we can expect continued expansion. The market is highly competitive, with major players like Rockwell Automation, Honeywell, NXP Semiconductors, SICK AG, and others vying for market share through innovation and strategic partnerships. The future will likely see greater integration of proximity sensors with other technologies, such as artificial intelligence and the Internet of Things (IoT), to enable more sophisticated applications and data analytics. Further diversification within the end-user segments, particularly in areas like renewable energy and smart infrastructure, is expected to create new growth opportunities. The focus on miniaturization, improved accuracy, and increased robustness of proximity sensors will continue to drive adoption across a wider range of applications.
This comprehensive report provides an in-depth analysis of the United States proximity sensor market, encompassing market dynamics, growth trends, dominant segments, and key players. The report covers the period from 2019 to 2033, with a focus on the base year 2025 and a forecast period of 2025-2033. It utilizes rigorous data analysis and industry expertise to deliver actionable insights for industry professionals, investors, and strategic decision-makers. The market is segmented by technology (Inductive, Capacitive, Photoelectric, Magnetic, Ultrasonic, Other), channel type (Single Channel, Multi-Channel), and end-user (Aerospace & Defense, Automotive, Industrial Automation, Consumer Electronics, Food & Beverage, Pharmaceutical, Construction, Energy, Other). The report projects a market value of XX Million units by 2033.
United States Proximity Sensor Market Market Dynamics & Structure
This section analyzes the competitive landscape, technological advancements, regulatory influences, and market trends within the US proximity sensor market. The market exhibits a moderately concentrated structure, with key players holding significant market share. Technological innovation, particularly in areas like miniaturization and improved accuracy, is a primary growth driver. Government regulations regarding safety and efficiency in various end-user industries also influence market dynamics. The presence of substitute technologies, such as vision systems, presents a competitive challenge. Mergers and acquisitions (M&A) activity within the sector, while moderate, is expected to intensify as companies seek to expand their market reach and product portfolios.
- Market Concentration: Moderately concentrated, with top 5 players holding approximately xx% market share in 2025.
- Technological Innovation: Strong driver, focused on miniaturization, enhanced accuracy, and improved power efficiency.
- Regulatory Framework: Compliance with safety standards (e.g., OSHA, UL) influences product development and adoption.
- Competitive Substitutes: Vision systems and other sensing technologies pose a competitive threat.
- M&A Activity: Moderate activity observed in recent years, with xx M&A deals recorded between 2019 and 2024.
- End-User Demographics: Industrial automation and automotive sectors are dominant end-users, followed by consumer electronics and aerospace & defense.
United States Proximity Sensor Market Growth Trends & Insights
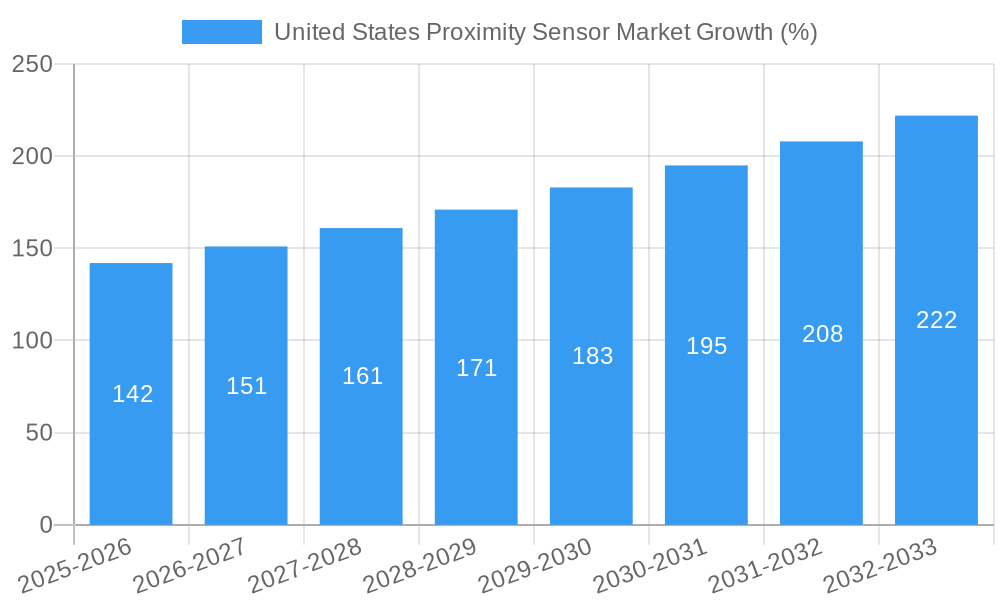
The US proximity sensor market has witnessed steady growth over the historical period (2019-2024), driven by increasing automation across various industries, rising demand for advanced sensor technologies in automotive applications (ADAS), and the growth of smart factories. The market is expected to maintain a healthy CAGR of xx% during the forecast period (2025-2033), reaching XX Million units by 2033. This growth is fueled by technological advancements leading to higher performance and lower costs, as well as the expansion of applications in emerging sectors like robotics and smart homes. Adoption rates are particularly high in industrial automation and automotive segments, with growing penetration in consumer electronics and other end-user markets. Technological disruptions, such as the emergence of IoT-enabled sensors and AI-powered solutions, will further shape market dynamics in the coming years. Consumer behavior shifts towards smart and automated systems are also driving increased demand.
Dominant Regions, Countries, or Segments in United States Proximity Sensor Market
The industrial automation sector holds the largest market share within the US proximity sensor market, followed by the automotive industry. Within technology segments, Inductive and Capacitive sensors dominate, owing to their wide applicability and cost-effectiveness. Geographically, the Midwest and Northeast regions of the US exhibit strong growth due to a high concentration of manufacturing and automotive facilities.
- Key Drivers (Industrial Automation): Increased automation, higher production efficiency demands, and the adoption of Industry 4.0 principles.
- Key Drivers (Automotive): Growth in Advanced Driver-Assistance Systems (ADAS) and the increasing integration of sensors in vehicles.
- Dominance Factors: High demand from key end-user industries, technological advancements, and government support for automation initiatives.
- Growth Potential: Significant potential exists in emerging sectors like robotics, smart homes, and healthcare.
United States Proximity Sensor Market Product Landscape
Proximity sensors are constantly evolving, with innovations focused on miniaturization, improved accuracy, enhanced durability, and wider operating temperature ranges. New products feature integrated signal processing, advanced communication protocols, and improved resistance to harsh environmental conditions. These advancements enable broader applications across various industries. Unique selling propositions often include enhanced sensing capabilities, customized solutions, and integration with other IoT devices.
Key Drivers, Barriers & Challenges in United States Proximity Sensor Market
Key Drivers:
- Increasing automation across various industries
- Growing demand for advanced sensor technologies in automotive applications
- Expansion of the IoT market and smart devices
Challenges and Restraints:
- Intense competition among established and emerging players
- Supply chain disruptions impacting component availability and costs
- Regulatory hurdles and compliance requirements in specific industries
Emerging Opportunities in United States Proximity Sensor Market
Emerging opportunities lie in integrating proximity sensors with IoT platforms for real-time data analysis and predictive maintenance. The growing adoption of robotics and automation in diverse sectors presents further market expansion. The development of specialized sensors for niche applications in healthcare, logistics, and agriculture also presents significant opportunities.
Growth Accelerators in the United States Proximity Sensor Market Industry
Technological advancements, particularly in AI and machine learning capabilities integrated into sensor technologies, will fuel significant market growth. Strategic partnerships between sensor manufacturers and system integrators will expand market reach and facilitate faster adoption. Market expansion into new applications, including smart homes and wearable technology, offers further growth potential.
Key Players Shaping the United States Proximity Sensor Market Market
- Rockwell Automation
- Honeywell International Inc
- NXP Semiconductors N V
- SICK AG
- STMicroelectronics
- Schneider Electric
- OMRON Corporation
- Panasonic Corporation
- General Electric *List Not Exhaustive
Notable Milestones in United States Proximity Sensor Market Sector
- 2022 (Q3): Launch of a new high-precision proximity sensor by SICK AG, expanding applications in precision manufacturing.
- 2021 (Q4): Acquisition of a smaller sensor company by Honeywell, strengthening their product portfolio.
- 2020 (Q1): Introduction of a new long-range ultrasonic sensor by OMRON, expanding market reach in logistics and robotics. (Further milestones will be added in the final report)
In-Depth United States Proximity Sensor Market Market Outlook
The US proximity sensor market is poised for sustained growth, driven by technological innovation, increasing automation across various industries, and the expanding adoption of smart technologies. Strategic partnerships, mergers and acquisitions, and expansion into new applications will further accelerate market expansion. The market is expected to witness significant growth in the forecast period, creating ample opportunities for both established players and new entrants.
United States Proximity Sensor Market Segmentation
-
1. Technology
- 1.1. Inductive
- 1.2. Capacitive
- 1.3. Photoelectric
- 1.4. Magnetic
- 1.5. Ultrasonic
- 1.6. Other Technology
-
2. Channel Type
- 2.1. Single Channel
- 2.2. Multi-Channel
-
3. End-User
- 3.1. Aerospace and Defense
- 3.2. Automotive
- 3.3. Industrial Automation
- 3.4. Consumer Electronics
- 3.5. Food & Beverage
- 3.6. Pharmaceutical
- 3.7. Construction
- 3.8. Energy
- 3.9. Other End-users
United States Proximity Sensor Market Segmentation By Geography
- 1. United States
United States Proximity Sensor Market REPORT HIGHLIGHTS
| Aspects | Details |
|---|---|
| Study Period | 2019-2033 |
| Base Year | 2024 |
| Estimated Year | 2025 |
| Forecast Period | 2025-2033 |
| Historical Period | 2019-2024 |
| Growth Rate | CAGR of 7.10% from 2019-2033 |
| Segmentation |
|
Table of Contents
- 1. Introduction
- 1.1. Research Scope
- 1.2. Market Segmentation
- 1.3. Research Methodology
- 1.4. Definitions and Assumptions
- 2. Executive Summary
- 2.1. Introduction
- 3. Market Dynamics
- 3.1. Introduction
- 3.2. Market Drivers
- 3.2.1. ; Growth in Industrial Automation; Increase in the Demand for Inductive Sensing Technology; Expansion of Automotive Sensing Applications
- 3.3. Market Restrains
- 3.3.1. Design Comlexity & Reliability
- 3.4. Market Trends
- 3.4.1. The Automotive Segment is Expected to Drive the Market's Growth
- 4. Market Factor Analysis
- 4.1. Porters Five Forces
- 4.2. Supply/Value Chain
- 4.3. PESTEL analysis
- 4.4. Market Entropy
- 4.5. Patent/Trademark Analysis
- 5. United States Proximity Sensor Market Analysis, Insights and Forecast, 2019-2031
- 5.1. Market Analysis, Insights and Forecast - by Technology
- 5.1.1. Inductive
- 5.1.2. Capacitive
- 5.1.3. Photoelectric
- 5.1.4. Magnetic
- 5.1.5. Ultrasonic
- 5.1.6. Other Technology
- 5.2. Market Analysis, Insights and Forecast - by Channel Type
- 5.2.1. Single Channel
- 5.2.2. Multi-Channel
- 5.3. Market Analysis, Insights and Forecast - by End-User
- 5.3.1. Aerospace and Defense
- 5.3.2. Automotive
- 5.3.3. Industrial Automation
- 5.3.4. Consumer Electronics
- 5.3.5. Food & Beverage
- 5.3.6. Pharmaceutical
- 5.3.7. Construction
- 5.3.8. Energy
- 5.3.9. Other End-users
- 5.4. Market Analysis, Insights and Forecast - by Region
- 5.4.1. United States
- 5.1. Market Analysis, Insights and Forecast - by Technology
- 6. North America United States Proximity Sensor Market Analysis, Insights and Forecast, 2019-2031
- 6.1. Market Analysis, Insights and Forecast - By Country/Sub-region
- 6.1.1.
- 7. Europe United States Proximity Sensor Market Analysis, Insights and Forecast, 2019-2031
- 7.1. Market Analysis, Insights and Forecast - By Country/Sub-region
- 7.1.1.
- 8. Asia Pacific United States Proximity Sensor Market Analysis, Insights and Forecast, 2019-2031
- 8.1. Market Analysis, Insights and Forecast - By Country/Sub-region
- 8.1.1.
- 9. Latin America United States Proximity Sensor Market Analysis, Insights and Forecast, 2019-2031
- 9.1. Market Analysis, Insights and Forecast - By Country/Sub-region
- 9.1.1.
- 10. Middle East and Africa United States Proximity Sensor Market Analysis, Insights and Forecast, 2019-2031
- 10.1. Market Analysis, Insights and Forecast - By Country/Sub-region
- 10.1.1.
- 11. Competitive Analysis
- 11.1. Market Share Analysis 2024
- 11.2. Company Profiles
- 11.2.1 Rockwell Automation
- 11.2.1.1. Overview
- 11.2.1.2. Products
- 11.2.1.3. SWOT Analysis
- 11.2.1.4. Recent Developments
- 11.2.1.5. Financials (Based on Availability)
- 11.2.2 Honeywell International Inc
- 11.2.2.1. Overview
- 11.2.2.2. Products
- 11.2.2.3. SWOT Analysis
- 11.2.2.4. Recent Developments
- 11.2.2.5. Financials (Based on Availability)
- 11.2.3 NXP Semiconductors N V
- 11.2.3.1. Overview
- 11.2.3.2. Products
- 11.2.3.3. SWOT Analysis
- 11.2.3.4. Recent Developments
- 11.2.3.5. Financials (Based on Availability)
- 11.2.4 SICK AG
- 11.2.4.1. Overview
- 11.2.4.2. Products
- 11.2.4.3. SWOT Analysis
- 11.2.4.4. Recent Developments
- 11.2.4.5. Financials (Based on Availability)
- 11.2.5 STMicroelectronics
- 11.2.5.1. Overview
- 11.2.5.2. Products
- 11.2.5.3. SWOT Analysis
- 11.2.5.4. Recent Developments
- 11.2.5.5. Financials (Based on Availability)
- 11.2.6 Schneider Electric
- 11.2.6.1. Overview
- 11.2.6.2. Products
- 11.2.6.3. SWOT Analysis
- 11.2.6.4. Recent Developments
- 11.2.6.5. Financials (Based on Availability)
- 11.2.7 OMRON Corporation
- 11.2.7.1. Overview
- 11.2.7.2. Products
- 11.2.7.3. SWOT Analysis
- 11.2.7.4. Recent Developments
- 11.2.7.5. Financials (Based on Availability)
- 11.2.8 Panasonic Corporation
- 11.2.8.1. Overview
- 11.2.8.2. Products
- 11.2.8.3. SWOT Analysis
- 11.2.8.4. Recent Developments
- 11.2.8.5. Financials (Based on Availability)
- 11.2.9 General Electric*List Not Exhaustive
- 11.2.9.1. Overview
- 11.2.9.2. Products
- 11.2.9.3. SWOT Analysis
- 11.2.9.4. Recent Developments
- 11.2.9.5. Financials (Based on Availability)
- 11.2.1 Rockwell Automation
List of Figures
- Figure 1: United States Proximity Sensor Market Revenue Breakdown (Million, %) by Product 2024 & 2032
- Figure 2: United States Proximity Sensor Market Share (%) by Company 2024
List of Tables
- Table 1: United States Proximity Sensor Market Revenue Million Forecast, by Region 2019 & 2032
- Table 2: United States Proximity Sensor Market Revenue Million Forecast, by Technology 2019 & 2032
- Table 3: United States Proximity Sensor Market Revenue Million Forecast, by Channel Type 2019 & 2032
- Table 4: United States Proximity Sensor Market Revenue Million Forecast, by End-User 2019 & 2032
- Table 5: United States Proximity Sensor Market Revenue Million Forecast, by Region 2019 & 2032
- Table 6: United States Proximity Sensor Market Revenue Million Forecast, by Country 2019 & 2032
- Table 7: United States Proximity Sensor Market Revenue (Million) Forecast, by Application 2019 & 2032
- Table 8: United States Proximity Sensor Market Revenue Million Forecast, by Country 2019 & 2032
- Table 9: United States Proximity Sensor Market Revenue (Million) Forecast, by Application 2019 & 2032
- Table 10: United States Proximity Sensor Market Revenue Million Forecast, by Country 2019 & 2032
- Table 11: United States Proximity Sensor Market Revenue (Million) Forecast, by Application 2019 & 2032
- Table 12: United States Proximity Sensor Market Revenue Million Forecast, by Country 2019 & 2032
- Table 13: United States Proximity Sensor Market Revenue (Million) Forecast, by Application 2019 & 2032
- Table 14: United States Proximity Sensor Market Revenue Million Forecast, by Country 2019 & 2032
- Table 15: United States Proximity Sensor Market Revenue (Million) Forecast, by Application 2019 & 2032
- Table 16: United States Proximity Sensor Market Revenue Million Forecast, by Technology 2019 & 2032
- Table 17: United States Proximity Sensor Market Revenue Million Forecast, by Channel Type 2019 & 2032
- Table 18: United States Proximity Sensor Market Revenue Million Forecast, by End-User 2019 & 2032
- Table 19: United States Proximity Sensor Market Revenue Million Forecast, by Country 2019 & 2032
Frequently Asked Questions
1. What is the projected Compound Annual Growth Rate (CAGR) of the United States Proximity Sensor Market?
The projected CAGR is approximately 7.10%.
2. Which companies are prominent players in the United States Proximity Sensor Market?
Key companies in the market include Rockwell Automation, Honeywell International Inc, NXP Semiconductors N V, SICK AG, STMicroelectronics, Schneider Electric, OMRON Corporation, Panasonic Corporation, General Electric*List Not Exhaustive.
3. What are the main segments of the United States Proximity Sensor Market?
The market segments include Technology, Channel Type, End-User.
4. Can you provide details about the market size?
The market size is estimated to be USD XX Million as of 2022.
5. What are some drivers contributing to market growth?
; Growth in Industrial Automation; Increase in the Demand for Inductive Sensing Technology; Expansion of Automotive Sensing Applications.
6. What are the notable trends driving market growth?
The Automotive Segment is Expected to Drive the Market's Growth.
7. Are there any restraints impacting market growth?
Design Comlexity & Reliability.
8. Can you provide examples of recent developments in the market?
N/A
9. What pricing options are available for accessing the report?
Pricing options include single-user, multi-user, and enterprise licenses priced at USD 3800, USD 4500, and USD 5800 respectively.
10. Is the market size provided in terms of value or volume?
The market size is provided in terms of value, measured in Million.
11. Are there any specific market keywords associated with the report?
Yes, the market keyword associated with the report is "United States Proximity Sensor Market," which aids in identifying and referencing the specific market segment covered.
12. How do I determine which pricing option suits my needs best?
The pricing options vary based on user requirements and access needs. Individual users may opt for single-user licenses, while businesses requiring broader access may choose multi-user or enterprise licenses for cost-effective access to the report.
13. Are there any additional resources or data provided in the United States Proximity Sensor Market report?
While the report offers comprehensive insights, it's advisable to review the specific contents or supplementary materials provided to ascertain if additional resources or data are available.
14. How can I stay updated on further developments or reports in the United States Proximity Sensor Market?
To stay informed about further developments, trends, and reports in the United States Proximity Sensor Market, consider subscribing to industry newsletters, following relevant companies and organizations, or regularly checking reputable industry news sources and publications.
Methodology
Step 1 - Identification of Relevant Samples Size from Population Database


Step 2 - Approaches for Defining Global Market Size (Value, Volume* & Price*)

Note*: In applicable scenarios
Step 3 - Data Sources
Primary Research
- Web Analytics
- Survey Reports
- Research Institute
- Latest Research Reports
- Opinion Leaders
Secondary Research
- Annual Reports
- White Paper
- Latest Press Release
- Industry Association
- Paid Database
- Investor Presentations

Step 4 - Data Triangulation
Involves using different sources of information in order to increase the validity of a study
These sources are likely to be stakeholders in a program - participants, other researchers, program staff, other community members, and so on.
Then we put all data in single framework & apply various statistical tools to find out the dynamic on the market.
During the analysis stage, feedback from the stakeholder groups would be compared to determine areas of agreement as well as areas of divergence


