
Key Insights
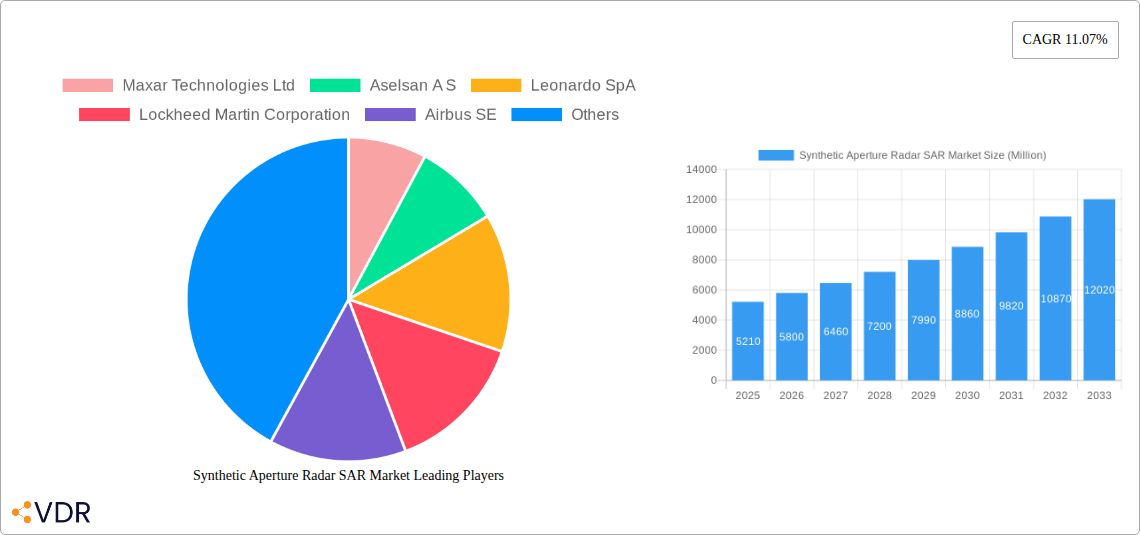
The Synthetic Aperture Radar (SAR) market is experiencing robust growth, projected to reach \$5.21 billion in 2025 and expand at a Compound Annual Growth Rate (CAGR) of 11.07% from 2025 to 2033. This expansion is driven by increasing demand for high-resolution imagery across various sectors. Military and defense applications remain a significant driver, fueled by the need for advanced surveillance and reconnaissance capabilities. The growing adoption of SAR technology in monitoring and exploration, particularly for environmental monitoring (e.g., deforestation, disaster assessment), resource management (e.g., precision agriculture, mineral exploration), and infrastructure inspection, further contributes to market growth. Technological advancements, such as improved sensor technology, enhanced processing algorithms, and the integration of SAR data with other geospatial information, are also key catalysts. While challenges such as high initial investment costs and the need for specialized expertise may present some restraints, the overall market outlook remains positive. The market is segmented geographically, with North America and Europe currently holding significant shares, but the Asia-Pacific region is expected to witness substantial growth due to increasing infrastructure development and government investments in defense and surveillance. Key players in the market include established aerospace and defense companies, alongside specialized SAR technology providers, driving innovation and competition.
The forecast for the SAR market indicates continued strong growth throughout the forecast period (2025-2033). The market is likely to see further diversification in applications, with increased adoption in areas like autonomous vehicles, urban planning, and scientific research. This necessitates ongoing advancements in data processing and analytics to effectively utilize the high volumes of data generated by SAR systems. The competitive landscape will likely continue to evolve, with mergers, acquisitions, and strategic partnerships shaping the future of the industry. Companies are focusing on developing cost-effective, user-friendly SAR solutions and expanding their service offerings to cater to a wider range of applications and user needs. The integration of SAR technology with other sensing technologies, such as LiDAR and hyperspectral imaging, is anticipated to create new opportunities for value-added services and innovative applications, driving market expansion further.
Synthetic Aperture Radar (SAR) Market: A Comprehensive Report (2019-2033)
This in-depth report provides a comprehensive analysis of the Synthetic Aperture Radar (SAR) market, encompassing market dynamics, growth trends, regional segmentation, product landscape, key players, and future outlook. The study period covers 2019-2033, with 2025 as the base and estimated year. This report is invaluable for industry professionals, investors, and researchers seeking a clear understanding of this rapidly evolving market. The parent market is the Earth Observation market, and the child market is the Remote Sensing market.
Synthetic Aperture Radar SAR Market Market Dynamics & Structure
The Synthetic Aperture Radar (SAR) market is characterized by a moderately concentrated landscape, with several major players vying for market share. Technological innovation, particularly in areas like miniaturization, higher resolution imaging, and improved data processing, are key drivers. Regulatory frameworks concerning data privacy and satellite operation influence market access. The emergence of alternative technologies for remote sensing, such as LiDAR, poses some competitive pressure. However, SAR's unique capabilities, especially in all-weather imaging, ensure its continued relevance. M&A activity has been relatively high in recent years, reflecting consolidation and expansion strategies.
- Market Concentration: Moderately concentrated, with the top 5 players holding approximately xx% of the market share in 2025.
- Technological Innovation: Focus on miniaturization (e.g., microsatellites), improved resolution, and advanced processing algorithms.
- Regulatory Landscape: Varying regulations across countries regarding satellite operations and data usage.
- Competitive Substitutes: LiDAR and other remote sensing technologies present some competitive pressure.
- End-User Demographics: Primarily government agencies (military and civil), commercial organizations (e.g., mining, agriculture), and research institutions.
- M&A Trends: Significant M&A activity in recent years, with xx deals recorded between 2019 and 2024, indicating consolidation and expansion within the sector.
Synthetic Aperture Radar SAR Market Growth Trends & Insights
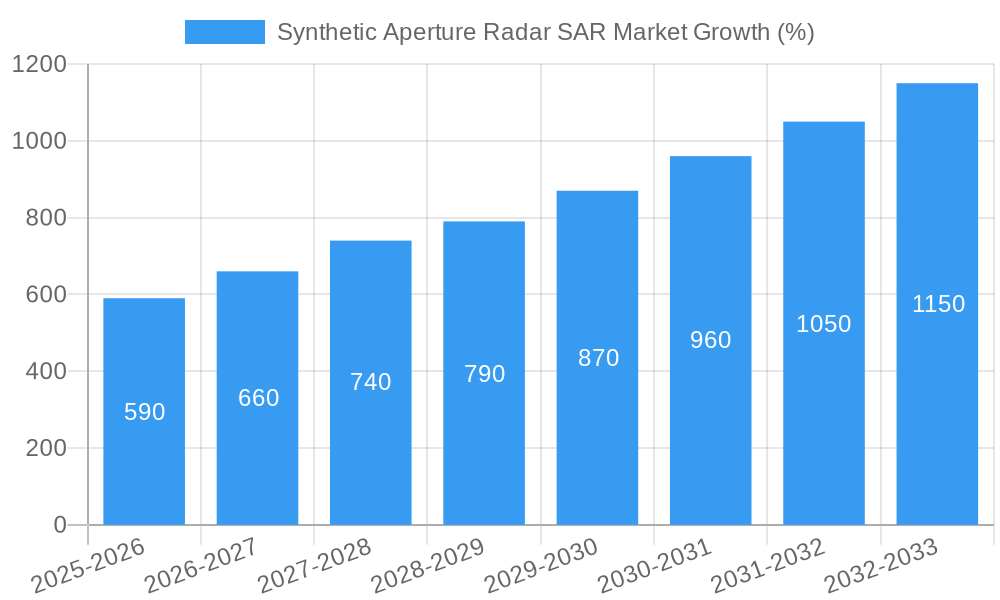
The global SAR market is experiencing robust growth, driven by increasing demand for high-resolution imagery across various applications. The market size was valued at xx Million in 2024 and is projected to reach xx Million by 2033, exhibiting a CAGR of xx% during the forecast period (2025-2033). This growth is fueled by technological advancements, rising adoption across diverse sectors (military, environmental monitoring, infrastructure management), and favorable government policies promoting space-based technologies. Consumer behavior is shifting towards data-driven decision-making, further enhancing the demand for SAR data and analytics. Increased focus on environmental monitoring and disaster management is also boosting market adoption rates. Market penetration in emerging economies remains comparatively low, presenting significant untapped potential.
Dominant Regions, Countries, or Segments in Synthetic Aperture Radar SAR Market
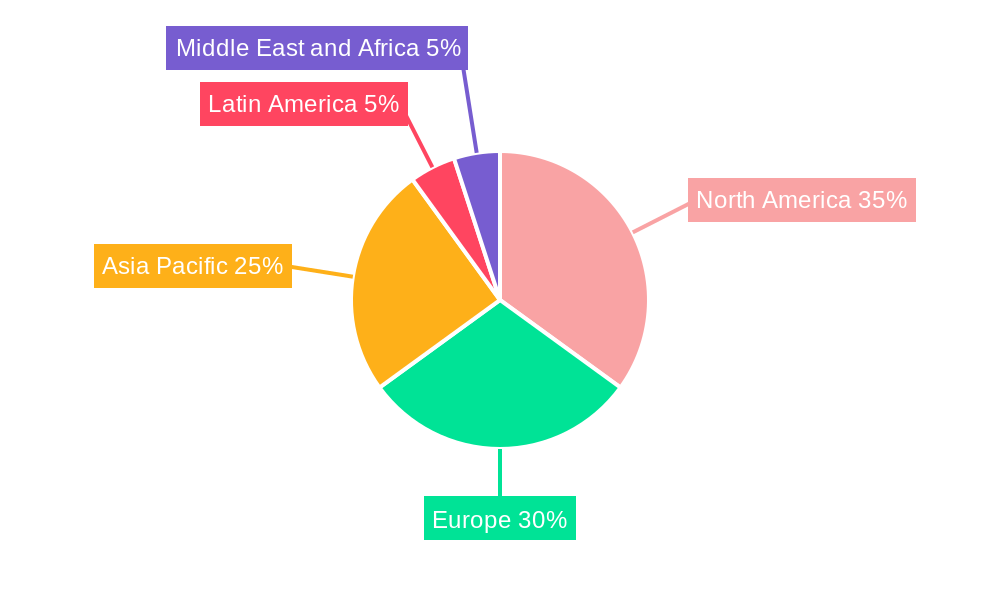
The North American region currently holds a significant share of the global SAR market, driven by strong government spending on defense and aerospace technologies. The military and defense segment is the largest application area, accounting for approximately xx% of the total market revenue in 2025. Europe and Asia-Pacific regions are witnessing rapid growth driven by rising infrastructure development, environmental monitoring needs, and increasing investment in space technology.
- North America: High government spending on defense and aerospace, robust technological innovation.
- Europe: Growing adoption in environmental monitoring and disaster management.
- Asia-Pacific: Rapid infrastructure development, increasing investment in space-based technology.
- Military and Defense Segment: Largest application area due to high demand for surveillance and reconnaissance.
- Monitoring and Exploration Segment: Rapid growth due to increasing environmental concerns and resource exploration needs.
- Other Applications: Steady growth across agriculture, urban planning, and other sectors.
Synthetic Aperture Radar SAR Market Product Landscape
The SAR market offers a diverse range of products, including airborne SAR systems, spaceborne SAR systems, and ground-based SAR systems. Innovations include higher-resolution sensors, improved data processing algorithms, and the development of compact and cost-effective systems such as microsatellite-based SAR. These advancements enhance the accuracy, efficiency, and affordability of SAR technology. Unique selling propositions often center on resolution, data acquisition speed, and the ability to penetrate cloud cover.
Key Drivers, Barriers & Challenges in Synthetic Aperture Radar SAR Market
Key Drivers:
- Increasing demand for high-resolution imagery in various sectors.
- Technological advancements leading to improved system performance and reduced costs.
- Growing awareness of the benefits of SAR data for environmental monitoring and disaster management.
- Government initiatives and funding supporting space-based technologies.
Key Barriers & Challenges:
- High initial investment costs for SAR systems.
- Complexity of data processing and analysis.
- Potential regulatory hurdles and data privacy concerns.
- Competition from other remote sensing technologies.
- Supply chain disruptions potentially impacting the availability of crucial components. (Estimated impact: xx% reduction in production during Qx 2023)
Emerging Opportunities in Synthetic Aperture Radar SAR Market
- Expanding applications in precision agriculture and forestry.
- Growing demand for SAR data in urban planning and infrastructure monitoring.
- Development of new SAR applications in disaster response and humanitarian aid.
- Exploring potential in the untapped markets of developing economies.
- Advancements in AI and Machine Learning for automated data analysis.
Growth Accelerators in the Synthetic Aperture Radar SAR Market Industry
The long-term growth of the SAR market will be significantly influenced by continued technological innovation, particularly in areas such as improved sensor technology, advanced data processing techniques, and integration with AI/ML for automated interpretation. Strategic partnerships between SAR providers and data analytics companies are also expected to drive market expansion. Furthermore, government initiatives promoting space technology adoption and increased investment in space infrastructure will further accelerate growth.
Key Players Shaping the Synthetic Aperture Radar SAR Market Market
- Maxar Technologies Ltd
- Aselsan A S
- Leonardo SpA
- Lockheed Martin Corporation
- Airbus SE
- IMSAR LLC
- Raytheon Company
- SRC Inc
- MetaSensing Group
- Israel Aerospace Industries Ltd
- General Atomics Aeronautical Systems Inc
- SAR AERO
- BAE Systems Plc
- Cobham Plc (Advent)
- Northrop Grumman Corporation
- Saab AB
- Thales Group
- L3Harris Technologies
- (List Not Exhaustive)
Notable Milestones in Synthetic Aperture Radar SAR Market Sector
- May 2022: ICEYE partners with the European Space Agency to provide flood information to Copernicus Emergency Services.
- November 2022: Synspective and Geo Climate Risk Solutions Pvt. Ltd. (GCRS) partner for SAR-based analysis solutions in India and South Asia.
In-Depth Synthetic Aperture Radar SAR Market Market Outlook
The future of the SAR market looks bright, with significant growth potential driven by continued technological innovation, expanding applications, and increased investment in space-based technologies. Strategic partnerships and collaborations within the industry will further accelerate market expansion. The focus on developing cost-effective, high-performance SAR systems will open up new market opportunities, particularly in emerging economies. The integration of AI/ML capabilities will significantly enhance the value proposition of SAR data, driving broader adoption and creating new applications. This, combined with the growing need for precise and timely Earth observation data across various sectors, suggests a strong and sustainable future for the SAR market.
Synthetic Aperture Radar SAR Market Segmentation
-
1. Application
- 1.1. Military and Defense
- 1.2. Monitoring and Exploration
- 1.3. Other Applications
Synthetic Aperture Radar SAR Market Segmentation By Geography
- 1. North America
- 2. Europe
- 3. Asia Pacific
- 4. Latin America
- 5. Middle East and Africa
Synthetic Aperture Radar SAR Market REPORT HIGHLIGHTS
| Aspects | Details |
|---|---|
| Study Period | 2019-2033 |
| Base Year | 2024 |
| Estimated Year | 2025 |
| Forecast Period | 2025-2033 |
| Historical Period | 2019-2024 |
| Growth Rate | CAGR of 11.07% from 2019-2033 |
| Segmentation |
|
Table of Contents
- 1. Introduction
- 1.1. Research Scope
- 1.2. Market Segmentation
- 1.3. Research Methodology
- 1.4. Definitions and Assumptions
- 2. Executive Summary
- 2.1. Introduction
- 3. Market Dynamics
- 3.1. Introduction
- 3.2. Market Drivers
- 3.2.1 Increasing Demand for Enhanced Imaging Technology for Remote Sensing; Increasing Geopolitical Instabilities in the Middle East and Asia-Pacific Regions
- 3.2.2 Leading to Surveillance Demand; Growing Demand of Synthetic Aperture Radar in Military and Defense Sector
- 3.3. Market Restrains
- 3.3.1. Performance Limitations of Synthetic Aperture Radar Systems
- 3.4. Market Trends
- 3.4.1. Growing Demand of Synthetic Aperture Radar in Military and Defense Sector is Driving the Market
- 4. Market Factor Analysis
- 4.1. Porters Five Forces
- 4.2. Supply/Value Chain
- 4.3. PESTEL analysis
- 4.4. Market Entropy
- 4.5. Patent/Trademark Analysis
- 5. Global Synthetic Aperture Radar SAR Market Analysis, Insights and Forecast, 2019-2031
- 5.1. Market Analysis, Insights and Forecast - by Application
- 5.1.1. Military and Defense
- 5.1.2. Monitoring and Exploration
- 5.1.3. Other Applications
- 5.2. Market Analysis, Insights and Forecast - by Region
- 5.2.1. North America
- 5.2.2. Europe
- 5.2.3. Asia Pacific
- 5.2.4. Latin America
- 5.2.5. Middle East and Africa
- 5.1. Market Analysis, Insights and Forecast - by Application
- 6. North America Synthetic Aperture Radar SAR Market Analysis, Insights and Forecast, 2019-2031
- 6.1. Market Analysis, Insights and Forecast - by Application
- 6.1.1. Military and Defense
- 6.1.2. Monitoring and Exploration
- 6.1.3. Other Applications
- 6.1. Market Analysis, Insights and Forecast - by Application
- 7. Europe Synthetic Aperture Radar SAR Market Analysis, Insights and Forecast, 2019-2031
- 7.1. Market Analysis, Insights and Forecast - by Application
- 7.1.1. Military and Defense
- 7.1.2. Monitoring and Exploration
- 7.1.3. Other Applications
- 7.1. Market Analysis, Insights and Forecast - by Application
- 8. Asia Pacific Synthetic Aperture Radar SAR Market Analysis, Insights and Forecast, 2019-2031
- 8.1. Market Analysis, Insights and Forecast - by Application
- 8.1.1. Military and Defense
- 8.1.2. Monitoring and Exploration
- 8.1.3. Other Applications
- 8.1. Market Analysis, Insights and Forecast - by Application
- 9. Latin America Synthetic Aperture Radar SAR Market Analysis, Insights and Forecast, 2019-2031
- 9.1. Market Analysis, Insights and Forecast - by Application
- 9.1.1. Military and Defense
- 9.1.2. Monitoring and Exploration
- 9.1.3. Other Applications
- 9.1. Market Analysis, Insights and Forecast - by Application
- 10. Middle East and Africa Synthetic Aperture Radar SAR Market Analysis, Insights and Forecast, 2019-2031
- 10.1. Market Analysis, Insights and Forecast - by Application
- 10.1.1. Military and Defense
- 10.1.2. Monitoring and Exploration
- 10.1.3. Other Applications
- 10.1. Market Analysis, Insights and Forecast - by Application
- 11. North America Synthetic Aperture Radar SAR Market Analysis, Insights and Forecast, 2019-2031
- 11.1. Market Analysis, Insights and Forecast - By Country/Sub-region
- 11.1.1.
- 12. Europe Synthetic Aperture Radar SAR Market Analysis, Insights and Forecast, 2019-2031
- 12.1. Market Analysis, Insights and Forecast - By Country/Sub-region
- 12.1.1.
- 13. Asia Pacific Synthetic Aperture Radar SAR Market Analysis, Insights and Forecast, 2019-2031
- 13.1. Market Analysis, Insights and Forecast - By Country/Sub-region
- 13.1.1.
- 14. Latin America Synthetic Aperture Radar SAR Market Analysis, Insights and Forecast, 2019-2031
- 14.1. Market Analysis, Insights and Forecast - By Country/Sub-region
- 14.1.1.
- 15. Middle East and Africa Synthetic Aperture Radar SAR Market Analysis, Insights and Forecast, 2019-2031
- 15.1. Market Analysis, Insights and Forecast - By Country/Sub-region
- 15.1.1.
- 16. Competitive Analysis
- 16.1. Global Market Share Analysis 2024
- 16.2. Company Profiles
- 16.2.1 Maxar Technologies Ltd
- 16.2.1.1. Overview
- 16.2.1.2. Products
- 16.2.1.3. SWOT Analysis
- 16.2.1.4. Recent Developments
- 16.2.1.5. Financials (Based on Availability)
- 16.2.2 Aselsan A S
- 16.2.2.1. Overview
- 16.2.2.2. Products
- 16.2.2.3. SWOT Analysis
- 16.2.2.4. Recent Developments
- 16.2.2.5. Financials (Based on Availability)
- 16.2.3 Leonardo SpA
- 16.2.3.1. Overview
- 16.2.3.2. Products
- 16.2.3.3. SWOT Analysis
- 16.2.3.4. Recent Developments
- 16.2.3.5. Financials (Based on Availability)
- 16.2.4 Lockheed Martin Corporation
- 16.2.4.1. Overview
- 16.2.4.2. Products
- 16.2.4.3. SWOT Analysis
- 16.2.4.4. Recent Developments
- 16.2.4.5. Financials (Based on Availability)
- 16.2.5 Airbus SE
- 16.2.5.1. Overview
- 16.2.5.2. Products
- 16.2.5.3. SWOT Analysis
- 16.2.5.4. Recent Developments
- 16.2.5.5. Financials (Based on Availability)
- 16.2.6 IMSAR LLC
- 16.2.6.1. Overview
- 16.2.6.2. Products
- 16.2.6.3. SWOT Analysis
- 16.2.6.4. Recent Developments
- 16.2.6.5. Financials (Based on Availability)
- 16.2.7 Raytheon Company
- 16.2.7.1. Overview
- 16.2.7.2. Products
- 16.2.7.3. SWOT Analysis
- 16.2.7.4. Recent Developments
- 16.2.7.5. Financials (Based on Availability)
- 16.2.8 SRC Inc
- 16.2.8.1. Overview
- 16.2.8.2. Products
- 16.2.8.3. SWOT Analysis
- 16.2.8.4. Recent Developments
- 16.2.8.5. Financials (Based on Availability)
- 16.2.9 MetaSensing Group
- 16.2.9.1. Overview
- 16.2.9.2. Products
- 16.2.9.3. SWOT Analysis
- 16.2.9.4. Recent Developments
- 16.2.9.5. Financials (Based on Availability)
- 16.2.10 Israel Aerospace Industries Ltd
- 16.2.10.1. Overview
- 16.2.10.2. Products
- 16.2.10.3. SWOT Analysis
- 16.2.10.4. Recent Developments
- 16.2.10.5. Financials (Based on Availability)
- 16.2.11 General Atomics Aeronautical Systems Inc
- 16.2.11.1. Overview
- 16.2.11.2. Products
- 16.2.11.3. SWOT Analysis
- 16.2.11.4. Recent Developments
- 16.2.11.5. Financials (Based on Availability)
- 16.2.12 SAR AERO
- 16.2.12.1. Overview
- 16.2.12.2. Products
- 16.2.12.3. SWOT Analysis
- 16.2.12.4. Recent Developments
- 16.2.12.5. Financials (Based on Availability)
- 16.2.13 BAE Systems Plc
- 16.2.13.1. Overview
- 16.2.13.2. Products
- 16.2.13.3. SWOT Analysis
- 16.2.13.4. Recent Developments
- 16.2.13.5. Financials (Based on Availability)
- 16.2.14 Cobham Plc (Advent)
- 16.2.14.1. Overview
- 16.2.14.2. Products
- 16.2.14.3. SWOT Analysis
- 16.2.14.4. Recent Developments
- 16.2.14.5. Financials (Based on Availability)
- 16.2.15 Northrop Grumman Corporation
- 16.2.15.1. Overview
- 16.2.15.2. Products
- 16.2.15.3. SWOT Analysis
- 16.2.15.4. Recent Developments
- 16.2.15.5. Financials (Based on Availability)
- 16.2.16 Saab AB
- 16.2.16.1. Overview
- 16.2.16.2. Products
- 16.2.16.3. SWOT Analysis
- 16.2.16.4. Recent Developments
- 16.2.16.5. Financials (Based on Availability)
- 16.2.17 Thales Group*List Not Exhaustive
- 16.2.17.1. Overview
- 16.2.17.2. Products
- 16.2.17.3. SWOT Analysis
- 16.2.17.4. Recent Developments
- 16.2.17.5. Financials (Based on Availability)
- 16.2.18 L3Harris Technologies
- 16.2.18.1. Overview
- 16.2.18.2. Products
- 16.2.18.3. SWOT Analysis
- 16.2.18.4. Recent Developments
- 16.2.18.5. Financials (Based on Availability)
- 16.2.1 Maxar Technologies Ltd
List of Figures
- Figure 1: Global Synthetic Aperture Radar SAR Market Revenue Breakdown (Million, %) by Region 2024 & 2032
- Figure 2: North America Synthetic Aperture Radar SAR Market Revenue (Million), by Country 2024 & 2032
- Figure 3: North America Synthetic Aperture Radar SAR Market Revenue Share (%), by Country 2024 & 2032
- Figure 4: Europe Synthetic Aperture Radar SAR Market Revenue (Million), by Country 2024 & 2032
- Figure 5: Europe Synthetic Aperture Radar SAR Market Revenue Share (%), by Country 2024 & 2032
- Figure 6: Asia Pacific Synthetic Aperture Radar SAR Market Revenue (Million), by Country 2024 & 2032
- Figure 7: Asia Pacific Synthetic Aperture Radar SAR Market Revenue Share (%), by Country 2024 & 2032
- Figure 8: Latin America Synthetic Aperture Radar SAR Market Revenue (Million), by Country 2024 & 2032
- Figure 9: Latin America Synthetic Aperture Radar SAR Market Revenue Share (%), by Country 2024 & 2032
- Figure 10: Middle East and Africa Synthetic Aperture Radar SAR Market Revenue (Million), by Country 2024 & 2032
- Figure 11: Middle East and Africa Synthetic Aperture Radar SAR Market Revenue Share (%), by Country 2024 & 2032
- Figure 12: North America Synthetic Aperture Radar SAR Market Revenue (Million), by Application 2024 & 2032
- Figure 13: North America Synthetic Aperture Radar SAR Market Revenue Share (%), by Application 2024 & 2032
- Figure 14: North America Synthetic Aperture Radar SAR Market Revenue (Million), by Country 2024 & 2032
- Figure 15: North America Synthetic Aperture Radar SAR Market Revenue Share (%), by Country 2024 & 2032
- Figure 16: Europe Synthetic Aperture Radar SAR Market Revenue (Million), by Application 2024 & 2032
- Figure 17: Europe Synthetic Aperture Radar SAR Market Revenue Share (%), by Application 2024 & 2032
- Figure 18: Europe Synthetic Aperture Radar SAR Market Revenue (Million), by Country 2024 & 2032
- Figure 19: Europe Synthetic Aperture Radar SAR Market Revenue Share (%), by Country 2024 & 2032
- Figure 20: Asia Pacific Synthetic Aperture Radar SAR Market Revenue (Million), by Application 2024 & 2032
- Figure 21: Asia Pacific Synthetic Aperture Radar SAR Market Revenue Share (%), by Application 2024 & 2032
- Figure 22: Asia Pacific Synthetic Aperture Radar SAR Market Revenue (Million), by Country 2024 & 2032
- Figure 23: Asia Pacific Synthetic Aperture Radar SAR Market Revenue Share (%), by Country 2024 & 2032
- Figure 24: Latin America Synthetic Aperture Radar SAR Market Revenue (Million), by Application 2024 & 2032
- Figure 25: Latin America Synthetic Aperture Radar SAR Market Revenue Share (%), by Application 2024 & 2032
- Figure 26: Latin America Synthetic Aperture Radar SAR Market Revenue (Million), by Country 2024 & 2032
- Figure 27: Latin America Synthetic Aperture Radar SAR Market Revenue Share (%), by Country 2024 & 2032
- Figure 28: Middle East and Africa Synthetic Aperture Radar SAR Market Revenue (Million), by Application 2024 & 2032
- Figure 29: Middle East and Africa Synthetic Aperture Radar SAR Market Revenue Share (%), by Application 2024 & 2032
- Figure 30: Middle East and Africa Synthetic Aperture Radar SAR Market Revenue (Million), by Country 2024 & 2032
- Figure 31: Middle East and Africa Synthetic Aperture Radar SAR Market Revenue Share (%), by Country 2024 & 2032
List of Tables
- Table 1: Global Synthetic Aperture Radar SAR Market Revenue Million Forecast, by Region 2019 & 2032
- Table 2: Global Synthetic Aperture Radar SAR Market Revenue Million Forecast, by Application 2019 & 2032
- Table 3: Global Synthetic Aperture Radar SAR Market Revenue Million Forecast, by Region 2019 & 2032
- Table 4: Global Synthetic Aperture Radar SAR Market Revenue Million Forecast, by Country 2019 & 2032
- Table 5: Synthetic Aperture Radar SAR Market Revenue (Million) Forecast, by Application 2019 & 2032
- Table 6: Global Synthetic Aperture Radar SAR Market Revenue Million Forecast, by Country 2019 & 2032
- Table 7: Synthetic Aperture Radar SAR Market Revenue (Million) Forecast, by Application 2019 & 2032
- Table 8: Global Synthetic Aperture Radar SAR Market Revenue Million Forecast, by Country 2019 & 2032
- Table 9: Synthetic Aperture Radar SAR Market Revenue (Million) Forecast, by Application 2019 & 2032
- Table 10: Global Synthetic Aperture Radar SAR Market Revenue Million Forecast, by Country 2019 & 2032
- Table 11: Synthetic Aperture Radar SAR Market Revenue (Million) Forecast, by Application 2019 & 2032
- Table 12: Global Synthetic Aperture Radar SAR Market Revenue Million Forecast, by Country 2019 & 2032
- Table 13: Synthetic Aperture Radar SAR Market Revenue (Million) Forecast, by Application 2019 & 2032
- Table 14: Global Synthetic Aperture Radar SAR Market Revenue Million Forecast, by Application 2019 & 2032
- Table 15: Global Synthetic Aperture Radar SAR Market Revenue Million Forecast, by Country 2019 & 2032
- Table 16: Global Synthetic Aperture Radar SAR Market Revenue Million Forecast, by Application 2019 & 2032
- Table 17: Global Synthetic Aperture Radar SAR Market Revenue Million Forecast, by Country 2019 & 2032
- Table 18: Global Synthetic Aperture Radar SAR Market Revenue Million Forecast, by Application 2019 & 2032
- Table 19: Global Synthetic Aperture Radar SAR Market Revenue Million Forecast, by Country 2019 & 2032
- Table 20: Global Synthetic Aperture Radar SAR Market Revenue Million Forecast, by Application 2019 & 2032
- Table 21: Global Synthetic Aperture Radar SAR Market Revenue Million Forecast, by Country 2019 & 2032
- Table 22: Global Synthetic Aperture Radar SAR Market Revenue Million Forecast, by Application 2019 & 2032
- Table 23: Global Synthetic Aperture Radar SAR Market Revenue Million Forecast, by Country 2019 & 2032
Frequently Asked Questions
1. What is the projected Compound Annual Growth Rate (CAGR) of the Synthetic Aperture Radar SAR Market?
The projected CAGR is approximately 11.07%.
2. Which companies are prominent players in the Synthetic Aperture Radar SAR Market?
Key companies in the market include Maxar Technologies Ltd, Aselsan A S, Leonardo SpA, Lockheed Martin Corporation, Airbus SE, IMSAR LLC, Raytheon Company, SRC Inc, MetaSensing Group, Israel Aerospace Industries Ltd, General Atomics Aeronautical Systems Inc, SAR AERO, BAE Systems Plc, Cobham Plc (Advent), Northrop Grumman Corporation, Saab AB, Thales Group*List Not Exhaustive, L3Harris Technologies.
3. What are the main segments of the Synthetic Aperture Radar SAR Market?
The market segments include Application.
4. Can you provide details about the market size?
The market size is estimated to be USD 5.21 Million as of 2022.
5. What are some drivers contributing to market growth?
Increasing Demand for Enhanced Imaging Technology for Remote Sensing; Increasing Geopolitical Instabilities in the Middle East and Asia-Pacific Regions. Leading to Surveillance Demand; Growing Demand of Synthetic Aperture Radar in Military and Defense Sector.
6. What are the notable trends driving market growth?
Growing Demand of Synthetic Aperture Radar in Military and Defense Sector is Driving the Market.
7. Are there any restraints impacting market growth?
Performance Limitations of Synthetic Aperture Radar Systems.
8. Can you provide examples of recent developments in the market?
In May 2022- ICEYE, a microsatellite manufacturer, recently announced a partnership with the European Space Agency to provide flood information to Copernicus Emergency Services. Important flood impact data from ICEYE that demonstrates the depth and scope of the flood will be provided.
9. What pricing options are available for accessing the report?
Pricing options include single-user, multi-user, and enterprise licenses priced at USD 4750, USD 5250, and USD 8750 respectively.
10. Is the market size provided in terms of value or volume?
The market size is provided in terms of value, measured in Million.
11. Are there any specific market keywords associated with the report?
Yes, the market keyword associated with the report is "Synthetic Aperture Radar SAR Market," which aids in identifying and referencing the specific market segment covered.
12. How do I determine which pricing option suits my needs best?
The pricing options vary based on user requirements and access needs. Individual users may opt for single-user licenses, while businesses requiring broader access may choose multi-user or enterprise licenses for cost-effective access to the report.
13. Are there any additional resources or data provided in the Synthetic Aperture Radar SAR Market report?
While the report offers comprehensive insights, it's advisable to review the specific contents or supplementary materials provided to ascertain if additional resources or data are available.
14. How can I stay updated on further developments or reports in the Synthetic Aperture Radar SAR Market?
To stay informed about further developments, trends, and reports in the Synthetic Aperture Radar SAR Market, consider subscribing to industry newsletters, following relevant companies and organizations, or regularly checking reputable industry news sources and publications.
Methodology
Step 1 - Identification of Relevant Samples Size from Population Database


Step 2 - Approaches for Defining Global Market Size (Value, Volume* & Price*)

Note*: In applicable scenarios
Step 3 - Data Sources
Primary Research
- Web Analytics
- Survey Reports
- Research Institute
- Latest Research Reports
- Opinion Leaders
Secondary Research
- Annual Reports
- White Paper
- Latest Press Release
- Industry Association
- Paid Database
- Investor Presentations

Step 4 - Data Triangulation
Involves using different sources of information in order to increase the validity of a study
These sources are likely to be stakeholders in a program - participants, other researchers, program staff, other community members, and so on.
Then we put all data in single framework & apply various statistical tools to find out the dynamic on the market.
During the analysis stage, feedback from the stakeholder groups would be compared to determine areas of agreement as well as areas of divergence


