
Key Insights
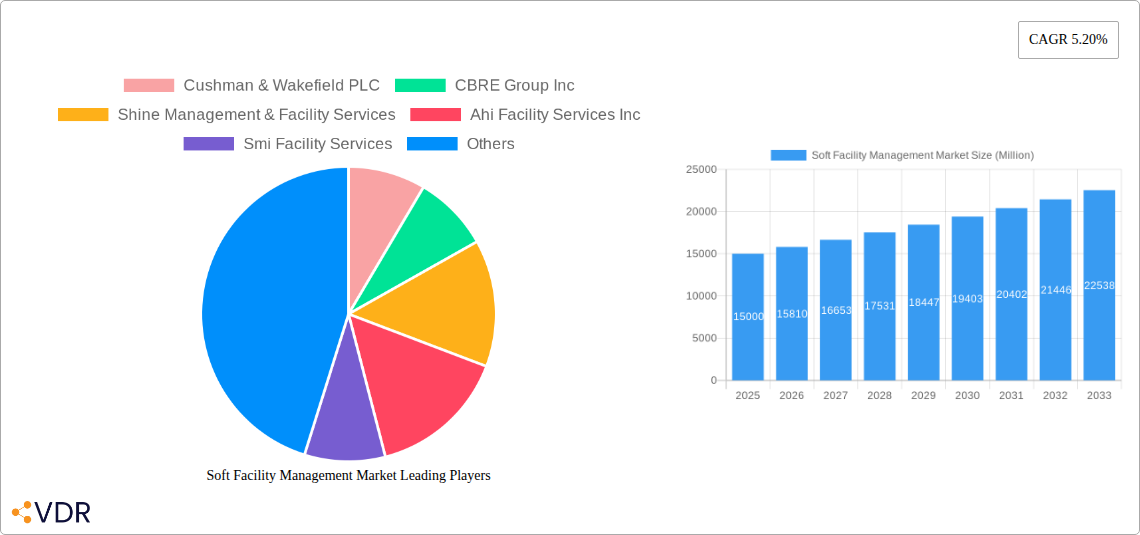
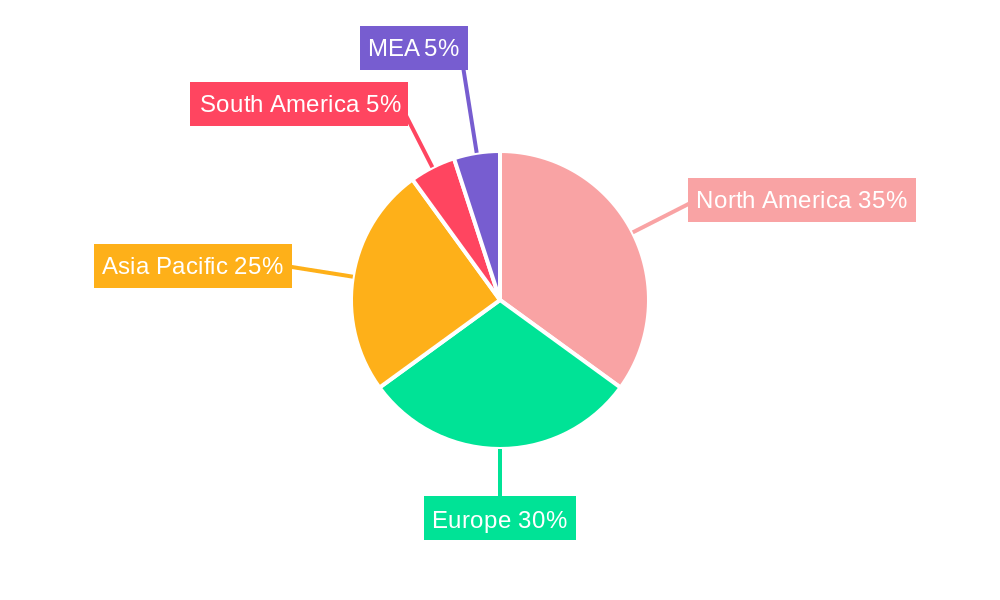
The Soft Facility Management (SFM) market, encompassing services like cleaning, catering, security, and landscaping, is experiencing robust growth, projected at a 5.20% CAGR from 2025 to 2033. This expansion is fueled by several key drivers. Increasing urbanization and the growth of commercial and industrial sectors are creating a higher demand for reliable and efficient SFM services. Businesses are increasingly outsourcing non-core functions like facility maintenance to focus on their core competencies, boosting market demand. Furthermore, a heightened emphasis on workplace safety and hygiene, particularly post-pandemic, is driving demand for robust cleaning and security services. Technological advancements, such as smart building management systems and IoT-enabled cleaning equipment, are improving efficiency and service delivery, further stimulating growth. The market is segmented by service type (office support, landscaping, cleaning, catering, security, and others) and end-user (commercial, institutional, public/infrastructure, industrial, and others). North America and Europe currently hold significant market share, driven by established industries and high adoption rates of outsourced services. However, the Asia-Pacific region is expected to witness significant growth in the coming years, fueled by rapid economic expansion and urbanization in countries like China and India. Competitive pressures are increasing as established players like Cushman & Wakefield, CBRE, and Sodexo compete with regional players for market share.
The competitive landscape is dynamic, with both large multinational corporations and smaller specialized firms vying for contracts. Market restraints include fluctuating raw material costs, labor shortages in certain regions, and economic downturns that could temporarily impact client spending on non-essential services. Nevertheless, the long-term outlook for the SFM market remains positive, driven by sustained growth in key sectors and ongoing technological innovations. The ongoing focus on sustainability and environmentally friendly practices within the industry is also expected to influence future market trends, driving demand for green cleaning solutions and sustainable facility management practices. Market players are adapting their strategies to leverage these trends and capitalize on the growing opportunities within the SFM sector. Strategic partnerships, mergers, and acquisitions are likely to become more prevalent as companies seek to expand their service offerings and geographic reach.
Soft Facility Management Market Report: 2019-2033
This comprehensive report provides an in-depth analysis of the Soft Facility Management (SFM) market, encompassing its current state, future trajectory, and key players. With a detailed examination of market segments – including cleaning services, catering services, security services and landscaping – and end-users such as commercial, institutional and industrial sectors, this report is an essential resource for industry professionals, investors, and strategic decision-makers. The study period covers 2019-2033, with a base year of 2025 and a forecast period of 2025-2033. The market size is presented in million units.
Soft Facility Management Market Dynamics & Structure
The Soft Facility Management market is characterized by a moderately concentrated landscape, with a few large global players and numerous smaller, regional firms. Market concentration is estimated at xx%, with the top 5 players holding approximately xx% of the market share in 2025. Technological innovation, particularly in areas like smart building technologies and data analytics, is a key driver, increasing efficiency and reducing costs. However, integration challenges and high upfront investment represent significant barriers. Regulatory frameworks, varying by region, impact service offerings and compliance costs. Competitive product substitutes, like self-service cleaning solutions, pose a challenge to traditional SFM providers. The end-user demographic is diverse, encompassing commercial, institutional, and industrial sectors, with growing demand from the public/infrastructure sector. M&A activity is relatively frequent, with xx deals recorded in the historical period (2019-2024), driven by expansion strategies and the pursuit of synergies.
- Market Concentration: xx% (2025), top 5 players holding xx%
- Technological Innovation Drivers: Smart building technologies, data analytics, IoT integration.
- Regulatory Frameworks: Varying regional regulations influence service offerings and compliance.
- Competitive Substitutes: Self-service cleaning solutions, automated security systems.
- End-User Demographics: Diverse, with growth in public/infrastructure sector.
- M&A Trends: xx deals (2019-2024), driven by expansion and synergy creation.
Soft Facility Management Market Growth Trends & Insights
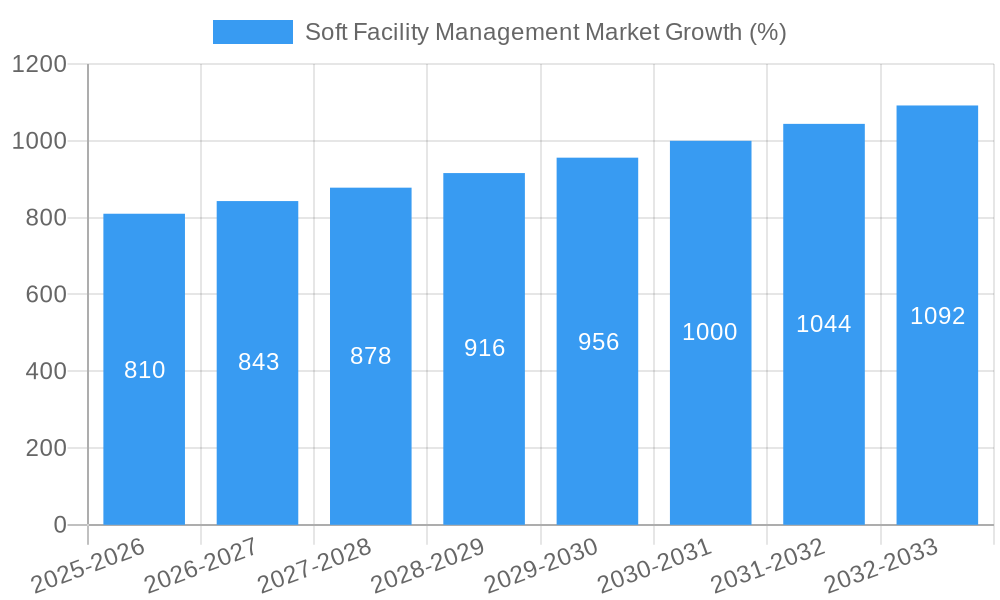
The Soft Facility Management market exhibited a CAGR of xx% during the historical period (2019-2024), reaching a market size of xx million units in 2024. This growth is fueled by increasing demand for outsourced services, rising awareness of hygiene and security, and the adoption of smart building technologies. The market is expected to maintain a strong growth trajectory, with a projected CAGR of xx% from 2025 to 2033, driven by factors like technological advancements, increasing urbanization, and evolving consumer preferences for enhanced workplace experiences. Market penetration currently stands at xx% and is projected to reach xx% by 2033. The adoption rate of integrated soft FM solutions is increasing, further fueling market growth. Shifts in consumer behavior, such as a greater emphasis on sustainability and workplace wellbeing, are also influencing the market.
Dominant Regions, Countries, or Segments in Soft Facility Management Market
North America currently dominates the Soft Facility Management market, holding approximately xx% market share in 2025, followed by Europe with xx%. This dominance is attributed to high levels of commercial real estate development, robust economic conditions, and a greater propensity for outsourcing facility services. Within the segments, Cleaning Services and Security Services represent the largest shares, driven by consistent demand across various end-users. The Commercial sector is the largest end-user segment, contributing xx% of total market revenue in 2025.
- Key Drivers (North America): High commercial real estate development, strong outsourcing culture.
- Key Drivers (Europe): Growing focus on sustainability, stringent regulations.
- Dominant Segments: Cleaning Services, Security Services (by type) and Commercial sector (by end-user).
- Growth Potential: Public/Infrastructure and Industrial sectors show promising growth opportunities.
Soft Facility Management Market Product Landscape
The SFM market offers a wide range of services, from basic cleaning and security to integrated facilities management solutions incorporating technology such as smart sensors, data analytics, and predictive maintenance. The unique selling propositions (USPs) of leading providers include specialized expertise, technological integration, and customized service packages tailored to individual client needs. Technological advancements, particularly in areas such as AI-powered cleaning robots and predictive maintenance software, are enhancing service efficiency and creating new market opportunities.
Key Drivers, Barriers & Challenges in Soft Facility Management Market
Key Drivers:
- Increasing demand for outsourced services.
- Growing awareness of hygiene and workplace safety.
- Technological advancements (smart building technologies, IoT, AI).
- Stringent regulations promoting compliance and sustainability.
Key Challenges & Restraints:
- Competition from smaller, local providers.
- High labor costs and workforce shortages.
- Economic downturns impacting client spending.
- Integrating new technologies can be complex and costly (estimated cost increase of xx%).
Emerging Opportunities in Soft Facility Management Market
Emerging opportunities include the expansion into untapped markets, such as emerging economies, and developing innovative service offerings, such as incorporating wellness and sustainability initiatives into SFM packages. The growing adoption of smart building technologies and the rise of data-driven decision-making also present significant opportunities for SFM providers to enhance service delivery and increase efficiency. A focus on customization and personalized service offerings will also appeal to clients.
Growth Accelerators in the Soft Facility Management Market Industry
Technological breakthroughs in areas such as AI, IoT, and robotics will significantly accelerate market growth by enhancing service efficiency, reducing costs, and enabling predictive maintenance. Strategic partnerships between SFM providers and technology companies will lead to the development of innovative integrated solutions. Market expansion into emerging economies with growing demand for outsourcing services will create significant growth opportunities.
Key Players Shaping the Soft Facility Management Market Market
- Cushman & Wakefield PLC
- CBRE Group Inc
- Shine Management & Facility Services
- Ahi Facility Services Inc
- Smi Facility Services
- Guaridan Service Industries Inc
- Jones Lang LaSalle Ip Inc
- Iss A/s
- Sodexo Inc
- Emeric Facility Services
Notable Milestones in Soft Facility Management Market Sector
- June 2022: ISS A/S secures a 5-year contract with a major US retailer for integrated facilities management services.
- April 2022: Tarem Services Limited signs a new cleaning services contract with CBRE.
- April 2022: SOS International re-awarded a USD 17.9 million contract for secure facility management.
In-Depth Soft Facility Management Market Market Outlook
The Soft Facility Management market is poised for sustained growth driven by the convergence of technology and increasing demand for efficient, sustainable, and integrated facility solutions. Strategic opportunities for growth include expanding service offerings, leveraging data analytics to optimize operations, and forming strategic partnerships to access new markets and technologies. The focus on sustainability and the growing adoption of smart building technologies will shape the future landscape of the SFM market, presenting significant opportunities for innovative companies.
Soft Facility Management Market Segmentation
-
1. Type
- 1.1. Office Support and Landscaping Services
- 1.2. Cleaning Services
- 1.3. Catering Services
- 1.4. Security Services
- 1.5. Other Soft FM Services
-
2. End User
- 2.1. Commercial
- 2.2. Institutional
- 2.3. Public/Infrastructure
- 2.4. Industrial
- 2.5. Other End Users
Soft Facility Management Market Segmentation By Geography
- 1. North America
- 2. Europe
- 3. Asia Pacific
- 4. Latin America
- 5. Middle East and Africa
Soft Facility Management Market REPORT HIGHLIGHTS
| Aspects | Details |
|---|---|
| Study Period | 2019-2033 |
| Base Year | 2024 |
| Estimated Year | 2025 |
| Forecast Period | 2025-2033 |
| Historical Period | 2019-2024 |
| Growth Rate | CAGR of 5.20% from 2019-2033 |
| Segmentation |
|
Table of Contents
- 1. Introduction
- 1.1. Research Scope
- 1.2. Market Segmentation
- 1.3. Research Methodology
- 1.4. Definitions and Assumptions
- 2. Executive Summary
- 2.1. Introduction
- 3. Market Dynamics
- 3.1. Introduction
- 3.2. Market Drivers
- 3.2.1 Megaprojects in Pipeline is Expected to Boost the Construction Sector
- 3.2.2 Driving the Need for Facility Management Services; Increasing Investment in Healthcare Infrastructure and the Construction of Healthcare Facilities
- 3.3. Market Restrains
- 3.3.1. Increased Instance of Data Breaches and Security Threats
- 3.4. Market Trends
- 3.4.1. Infrastructural Development Continue to Open Up New Opportunities for SFM Vendors
- 4. Market Factor Analysis
- 4.1. Porters Five Forces
- 4.2. Supply/Value Chain
- 4.3. PESTEL analysis
- 4.4. Market Entropy
- 4.5. Patent/Trademark Analysis
- 5. Global Soft Facility Management Market Analysis, Insights and Forecast, 2019-2031
- 5.1. Market Analysis, Insights and Forecast - by Type
- 5.1.1. Office Support and Landscaping Services
- 5.1.2. Cleaning Services
- 5.1.3. Catering Services
- 5.1.4. Security Services
- 5.1.5. Other Soft FM Services
- 5.2. Market Analysis, Insights and Forecast - by End User
- 5.2.1. Commercial
- 5.2.2. Institutional
- 5.2.3. Public/Infrastructure
- 5.2.4. Industrial
- 5.2.5. Other End Users
- 5.3. Market Analysis, Insights and Forecast - by Region
- 5.3.1. North America
- 5.3.2. Europe
- 5.3.3. Asia Pacific
- 5.3.4. Latin America
- 5.3.5. Middle East and Africa
- 5.1. Market Analysis, Insights and Forecast - by Type
- 6. North America Soft Facility Management Market Analysis, Insights and Forecast, 2019-2031
- 6.1. Market Analysis, Insights and Forecast - by Type
- 6.1.1. Office Support and Landscaping Services
- 6.1.2. Cleaning Services
- 6.1.3. Catering Services
- 6.1.4. Security Services
- 6.1.5. Other Soft FM Services
- 6.2. Market Analysis, Insights and Forecast - by End User
- 6.2.1. Commercial
- 6.2.2. Institutional
- 6.2.3. Public/Infrastructure
- 6.2.4. Industrial
- 6.2.5. Other End Users
- 6.1. Market Analysis, Insights and Forecast - by Type
- 7. Europe Soft Facility Management Market Analysis, Insights and Forecast, 2019-2031
- 7.1. Market Analysis, Insights and Forecast - by Type
- 7.1.1. Office Support and Landscaping Services
- 7.1.2. Cleaning Services
- 7.1.3. Catering Services
- 7.1.4. Security Services
- 7.1.5. Other Soft FM Services
- 7.2. Market Analysis, Insights and Forecast - by End User
- 7.2.1. Commercial
- 7.2.2. Institutional
- 7.2.3. Public/Infrastructure
- 7.2.4. Industrial
- 7.2.5. Other End Users
- 7.1. Market Analysis, Insights and Forecast - by Type
- 8. Asia Pacific Soft Facility Management Market Analysis, Insights and Forecast, 2019-2031
- 8.1. Market Analysis, Insights and Forecast - by Type
- 8.1.1. Office Support and Landscaping Services
- 8.1.2. Cleaning Services
- 8.1.3. Catering Services
- 8.1.4. Security Services
- 8.1.5. Other Soft FM Services
- 8.2. Market Analysis, Insights and Forecast - by End User
- 8.2.1. Commercial
- 8.2.2. Institutional
- 8.2.3. Public/Infrastructure
- 8.2.4. Industrial
- 8.2.5. Other End Users
- 8.1. Market Analysis, Insights and Forecast - by Type
- 9. Latin America Soft Facility Management Market Analysis, Insights and Forecast, 2019-2031
- 9.1. Market Analysis, Insights and Forecast - by Type
- 9.1.1. Office Support and Landscaping Services
- 9.1.2. Cleaning Services
- 9.1.3. Catering Services
- 9.1.4. Security Services
- 9.1.5. Other Soft FM Services
- 9.2. Market Analysis, Insights and Forecast - by End User
- 9.2.1. Commercial
- 9.2.2. Institutional
- 9.2.3. Public/Infrastructure
- 9.2.4. Industrial
- 9.2.5. Other End Users
- 9.1. Market Analysis, Insights and Forecast - by Type
- 10. Middle East and Africa Soft Facility Management Market Analysis, Insights and Forecast, 2019-2031
- 10.1. Market Analysis, Insights and Forecast - by Type
- 10.1.1. Office Support and Landscaping Services
- 10.1.2. Cleaning Services
- 10.1.3. Catering Services
- 10.1.4. Security Services
- 10.1.5. Other Soft FM Services
- 10.2. Market Analysis, Insights and Forecast - by End User
- 10.2.1. Commercial
- 10.2.2. Institutional
- 10.2.3. Public/Infrastructure
- 10.2.4. Industrial
- 10.2.5. Other End Users
- 10.1. Market Analysis, Insights and Forecast - by Type
- 11. North America Soft Facility Management Market Analysis, Insights and Forecast, 2019-2031
- 11.1. Market Analysis, Insights and Forecast - By Country/Sub-region
- 11.1.1 United States
- 11.1.2 Canada
- 11.1.3 Mexico
- 12. Europe Soft Facility Management Market Analysis, Insights and Forecast, 2019-2031
- 12.1. Market Analysis, Insights and Forecast - By Country/Sub-region
- 12.1.1 Germany
- 12.1.2 United Kingdom
- 12.1.3 France
- 12.1.4 Spain
- 12.1.5 Italy
- 12.1.6 Spain
- 12.1.7 Belgium
- 12.1.8 Netherland
- 12.1.9 Nordics
- 12.1.10 Rest of Europe
- 13. Asia Pacific Soft Facility Management Market Analysis, Insights and Forecast, 2019-2031
- 13.1. Market Analysis, Insights and Forecast - By Country/Sub-region
- 13.1.1 China
- 13.1.2 Japan
- 13.1.3 India
- 13.1.4 South Korea
- 13.1.5 Southeast Asia
- 13.1.6 Australia
- 13.1.7 Indonesia
- 13.1.8 Phillipes
- 13.1.9 Singapore
- 13.1.10 Thailandc
- 13.1.11 Rest of Asia Pacific
- 14. South America Soft Facility Management Market Analysis, Insights and Forecast, 2019-2031
- 14.1. Market Analysis, Insights and Forecast - By Country/Sub-region
- 14.1.1 Brazil
- 14.1.2 Argentina
- 14.1.3 Peru
- 14.1.4 Chile
- 14.1.5 Colombia
- 14.1.6 Ecuador
- 14.1.7 Venezuela
- 14.1.8 Rest of South America
- 15. North America Soft Facility Management Market Analysis, Insights and Forecast, 2019-2031
- 15.1. Market Analysis, Insights and Forecast - By Country/Sub-region
- 15.1.1 United States
- 15.1.2 Canada
- 15.1.3 Mexico
- 16. MEA Soft Facility Management Market Analysis, Insights and Forecast, 2019-2031
- 16.1. Market Analysis, Insights and Forecast - By Country/Sub-region
- 16.1.1 United Arab Emirates
- 16.1.2 Saudi Arabia
- 16.1.3 South Africa
- 16.1.4 Rest of Middle East and Africa
- 17. Competitive Analysis
- 17.1. Global Market Share Analysis 2024
- 17.2. Company Profiles
- 17.2.1 Cushman & Wakefield PLC
- 17.2.1.1. Overview
- 17.2.1.2. Products
- 17.2.1.3. SWOT Analysis
- 17.2.1.4. Recent Developments
- 17.2.1.5. Financials (Based on Availability)
- 17.2.2 CBRE Group Inc
- 17.2.2.1. Overview
- 17.2.2.2. Products
- 17.2.2.3. SWOT Analysis
- 17.2.2.4. Recent Developments
- 17.2.2.5. Financials (Based on Availability)
- 17.2.3 Shine Management & Facility Services
- 17.2.3.1. Overview
- 17.2.3.2. Products
- 17.2.3.3. SWOT Analysis
- 17.2.3.4. Recent Developments
- 17.2.3.5. Financials (Based on Availability)
- 17.2.4 Ahi Facility Services Inc
- 17.2.4.1. Overview
- 17.2.4.2. Products
- 17.2.4.3. SWOT Analysis
- 17.2.4.4. Recent Developments
- 17.2.4.5. Financials (Based on Availability)
- 17.2.5 Smi Facility Services
- 17.2.5.1. Overview
- 17.2.5.2. Products
- 17.2.5.3. SWOT Analysis
- 17.2.5.4. Recent Developments
- 17.2.5.5. Financials (Based on Availability)
- 17.2.6 Guaridan Service Industries Inc
- 17.2.6.1. Overview
- 17.2.6.2. Products
- 17.2.6.3. SWOT Analysis
- 17.2.6.4. Recent Developments
- 17.2.6.5. Financials (Based on Availability)
- 17.2.7 Jones Lang LaSalle Ip Inc
- 17.2.7.1. Overview
- 17.2.7.2. Products
- 17.2.7.3. SWOT Analysis
- 17.2.7.4. Recent Developments
- 17.2.7.5. Financials (Based on Availability)
- 17.2.8 Iss A/s
- 17.2.8.1. Overview
- 17.2.8.2. Products
- 17.2.8.3. SWOT Analysis
- 17.2.8.4. Recent Developments
- 17.2.8.5. Financials (Based on Availability)
- 17.2.9 Sodexo Inc
- 17.2.9.1. Overview
- 17.2.9.2. Products
- 17.2.9.3. SWOT Analysis
- 17.2.9.4. Recent Developments
- 17.2.9.5. Financials (Based on Availability)
- 17.2.10 Emeric Facility Services
- 17.2.10.1. Overview
- 17.2.10.2. Products
- 17.2.10.3. SWOT Analysis
- 17.2.10.4. Recent Developments
- 17.2.10.5. Financials (Based on Availability)
- 17.2.1 Cushman & Wakefield PLC
List of Figures
- Figure 1: Global Soft Facility Management Market Revenue Breakdown (Million, %) by Region 2024 & 2032
- Figure 2: North America Soft Facility Management Market Revenue (Million), by Country 2024 & 2032
- Figure 3: North America Soft Facility Management Market Revenue Share (%), by Country 2024 & 2032
- Figure 4: Europe Soft Facility Management Market Revenue (Million), by Country 2024 & 2032
- Figure 5: Europe Soft Facility Management Market Revenue Share (%), by Country 2024 & 2032
- Figure 6: Asia Pacific Soft Facility Management Market Revenue (Million), by Country 2024 & 2032
- Figure 7: Asia Pacific Soft Facility Management Market Revenue Share (%), by Country 2024 & 2032
- Figure 8: South America Soft Facility Management Market Revenue (Million), by Country 2024 & 2032
- Figure 9: South America Soft Facility Management Market Revenue Share (%), by Country 2024 & 2032
- Figure 10: North America Soft Facility Management Market Revenue (Million), by Country 2024 & 2032
- Figure 11: North America Soft Facility Management Market Revenue Share (%), by Country 2024 & 2032
- Figure 12: MEA Soft Facility Management Market Revenue (Million), by Country 2024 & 2032
- Figure 13: MEA Soft Facility Management Market Revenue Share (%), by Country 2024 & 2032
- Figure 14: North America Soft Facility Management Market Revenue (Million), by Type 2024 & 2032
- Figure 15: North America Soft Facility Management Market Revenue Share (%), by Type 2024 & 2032
- Figure 16: North America Soft Facility Management Market Revenue (Million), by End User 2024 & 2032
- Figure 17: North America Soft Facility Management Market Revenue Share (%), by End User 2024 & 2032
- Figure 18: North America Soft Facility Management Market Revenue (Million), by Country 2024 & 2032
- Figure 19: North America Soft Facility Management Market Revenue Share (%), by Country 2024 & 2032
- Figure 20: Europe Soft Facility Management Market Revenue (Million), by Type 2024 & 2032
- Figure 21: Europe Soft Facility Management Market Revenue Share (%), by Type 2024 & 2032
- Figure 22: Europe Soft Facility Management Market Revenue (Million), by End User 2024 & 2032
- Figure 23: Europe Soft Facility Management Market Revenue Share (%), by End User 2024 & 2032
- Figure 24: Europe Soft Facility Management Market Revenue (Million), by Country 2024 & 2032
- Figure 25: Europe Soft Facility Management Market Revenue Share (%), by Country 2024 & 2032
- Figure 26: Asia Pacific Soft Facility Management Market Revenue (Million), by Type 2024 & 2032
- Figure 27: Asia Pacific Soft Facility Management Market Revenue Share (%), by Type 2024 & 2032
- Figure 28: Asia Pacific Soft Facility Management Market Revenue (Million), by End User 2024 & 2032
- Figure 29: Asia Pacific Soft Facility Management Market Revenue Share (%), by End User 2024 & 2032
- Figure 30: Asia Pacific Soft Facility Management Market Revenue (Million), by Country 2024 & 2032
- Figure 31: Asia Pacific Soft Facility Management Market Revenue Share (%), by Country 2024 & 2032
- Figure 32: Latin America Soft Facility Management Market Revenue (Million), by Type 2024 & 2032
- Figure 33: Latin America Soft Facility Management Market Revenue Share (%), by Type 2024 & 2032
- Figure 34: Latin America Soft Facility Management Market Revenue (Million), by End User 2024 & 2032
- Figure 35: Latin America Soft Facility Management Market Revenue Share (%), by End User 2024 & 2032
- Figure 36: Latin America Soft Facility Management Market Revenue (Million), by Country 2024 & 2032
- Figure 37: Latin America Soft Facility Management Market Revenue Share (%), by Country 2024 & 2032
- Figure 38: Middle East and Africa Soft Facility Management Market Revenue (Million), by Type 2024 & 2032
- Figure 39: Middle East and Africa Soft Facility Management Market Revenue Share (%), by Type 2024 & 2032
- Figure 40: Middle East and Africa Soft Facility Management Market Revenue (Million), by End User 2024 & 2032
- Figure 41: Middle East and Africa Soft Facility Management Market Revenue Share (%), by End User 2024 & 2032
- Figure 42: Middle East and Africa Soft Facility Management Market Revenue (Million), by Country 2024 & 2032
- Figure 43: Middle East and Africa Soft Facility Management Market Revenue Share (%), by Country 2024 & 2032
List of Tables
- Table 1: Global Soft Facility Management Market Revenue Million Forecast, by Region 2019 & 2032
- Table 2: Global Soft Facility Management Market Revenue Million Forecast, by Type 2019 & 2032
- Table 3: Global Soft Facility Management Market Revenue Million Forecast, by End User 2019 & 2032
- Table 4: Global Soft Facility Management Market Revenue Million Forecast, by Region 2019 & 2032
- Table 5: Global Soft Facility Management Market Revenue Million Forecast, by Country 2019 & 2032
- Table 6: United States Soft Facility Management Market Revenue (Million) Forecast, by Application 2019 & 2032
- Table 7: Canada Soft Facility Management Market Revenue (Million) Forecast, by Application 2019 & 2032
- Table 8: Mexico Soft Facility Management Market Revenue (Million) Forecast, by Application 2019 & 2032
- Table 9: Global Soft Facility Management Market Revenue Million Forecast, by Country 2019 & 2032
- Table 10: Germany Soft Facility Management Market Revenue (Million) Forecast, by Application 2019 & 2032
- Table 11: United Kingdom Soft Facility Management Market Revenue (Million) Forecast, by Application 2019 & 2032
- Table 12: France Soft Facility Management Market Revenue (Million) Forecast, by Application 2019 & 2032
- Table 13: Spain Soft Facility Management Market Revenue (Million) Forecast, by Application 2019 & 2032
- Table 14: Italy Soft Facility Management Market Revenue (Million) Forecast, by Application 2019 & 2032
- Table 15: Spain Soft Facility Management Market Revenue (Million) Forecast, by Application 2019 & 2032
- Table 16: Belgium Soft Facility Management Market Revenue (Million) Forecast, by Application 2019 & 2032
- Table 17: Netherland Soft Facility Management Market Revenue (Million) Forecast, by Application 2019 & 2032
- Table 18: Nordics Soft Facility Management Market Revenue (Million) Forecast, by Application 2019 & 2032
- Table 19: Rest of Europe Soft Facility Management Market Revenue (Million) Forecast, by Application 2019 & 2032
- Table 20: Global Soft Facility Management Market Revenue Million Forecast, by Country 2019 & 2032
- Table 21: China Soft Facility Management Market Revenue (Million) Forecast, by Application 2019 & 2032
- Table 22: Japan Soft Facility Management Market Revenue (Million) Forecast, by Application 2019 & 2032
- Table 23: India Soft Facility Management Market Revenue (Million) Forecast, by Application 2019 & 2032
- Table 24: South Korea Soft Facility Management Market Revenue (Million) Forecast, by Application 2019 & 2032
- Table 25: Southeast Asia Soft Facility Management Market Revenue (Million) Forecast, by Application 2019 & 2032
- Table 26: Australia Soft Facility Management Market Revenue (Million) Forecast, by Application 2019 & 2032
- Table 27: Indonesia Soft Facility Management Market Revenue (Million) Forecast, by Application 2019 & 2032
- Table 28: Phillipes Soft Facility Management Market Revenue (Million) Forecast, by Application 2019 & 2032
- Table 29: Singapore Soft Facility Management Market Revenue (Million) Forecast, by Application 2019 & 2032
- Table 30: Thailandc Soft Facility Management Market Revenue (Million) Forecast, by Application 2019 & 2032
- Table 31: Rest of Asia Pacific Soft Facility Management Market Revenue (Million) Forecast, by Application 2019 & 2032
- Table 32: Global Soft Facility Management Market Revenue Million Forecast, by Country 2019 & 2032
- Table 33: Brazil Soft Facility Management Market Revenue (Million) Forecast, by Application 2019 & 2032
- Table 34: Argentina Soft Facility Management Market Revenue (Million) Forecast, by Application 2019 & 2032
- Table 35: Peru Soft Facility Management Market Revenue (Million) Forecast, by Application 2019 & 2032
- Table 36: Chile Soft Facility Management Market Revenue (Million) Forecast, by Application 2019 & 2032
- Table 37: Colombia Soft Facility Management Market Revenue (Million) Forecast, by Application 2019 & 2032
- Table 38: Ecuador Soft Facility Management Market Revenue (Million) Forecast, by Application 2019 & 2032
- Table 39: Venezuela Soft Facility Management Market Revenue (Million) Forecast, by Application 2019 & 2032
- Table 40: Rest of South America Soft Facility Management Market Revenue (Million) Forecast, by Application 2019 & 2032
- Table 41: Global Soft Facility Management Market Revenue Million Forecast, by Country 2019 & 2032
- Table 42: United States Soft Facility Management Market Revenue (Million) Forecast, by Application 2019 & 2032
- Table 43: Canada Soft Facility Management Market Revenue (Million) Forecast, by Application 2019 & 2032
- Table 44: Mexico Soft Facility Management Market Revenue (Million) Forecast, by Application 2019 & 2032
- Table 45: Global Soft Facility Management Market Revenue Million Forecast, by Country 2019 & 2032
- Table 46: United Arab Emirates Soft Facility Management Market Revenue (Million) Forecast, by Application 2019 & 2032
- Table 47: Saudi Arabia Soft Facility Management Market Revenue (Million) Forecast, by Application 2019 & 2032
- Table 48: South Africa Soft Facility Management Market Revenue (Million) Forecast, by Application 2019 & 2032
- Table 49: Rest of Middle East and Africa Soft Facility Management Market Revenue (Million) Forecast, by Application 2019 & 2032
- Table 50: Global Soft Facility Management Market Revenue Million Forecast, by Type 2019 & 2032
- Table 51: Global Soft Facility Management Market Revenue Million Forecast, by End User 2019 & 2032
- Table 52: Global Soft Facility Management Market Revenue Million Forecast, by Country 2019 & 2032
- Table 53: Global Soft Facility Management Market Revenue Million Forecast, by Type 2019 & 2032
- Table 54: Global Soft Facility Management Market Revenue Million Forecast, by End User 2019 & 2032
- Table 55: Global Soft Facility Management Market Revenue Million Forecast, by Country 2019 & 2032
- Table 56: Global Soft Facility Management Market Revenue Million Forecast, by Type 2019 & 2032
- Table 57: Global Soft Facility Management Market Revenue Million Forecast, by End User 2019 & 2032
- Table 58: Global Soft Facility Management Market Revenue Million Forecast, by Country 2019 & 2032
- Table 59: Global Soft Facility Management Market Revenue Million Forecast, by Type 2019 & 2032
- Table 60: Global Soft Facility Management Market Revenue Million Forecast, by End User 2019 & 2032
- Table 61: Global Soft Facility Management Market Revenue Million Forecast, by Country 2019 & 2032
- Table 62: Global Soft Facility Management Market Revenue Million Forecast, by Type 2019 & 2032
- Table 63: Global Soft Facility Management Market Revenue Million Forecast, by End User 2019 & 2032
- Table 64: Global Soft Facility Management Market Revenue Million Forecast, by Country 2019 & 2032
Frequently Asked Questions
1. What is the projected Compound Annual Growth Rate (CAGR) of the Soft Facility Management Market?
The projected CAGR is approximately 5.20%.
2. Which companies are prominent players in the Soft Facility Management Market?
Key companies in the market include Cushman & Wakefield PLC, CBRE Group Inc, Shine Management & Facility Services, Ahi Facility Services Inc, Smi Facility Services, Guaridan Service Industries Inc , Jones Lang LaSalle Ip Inc, Iss A/s, Sodexo Inc, Emeric Facility Services.
3. What are the main segments of the Soft Facility Management Market?
The market segments include Type, End User.
4. Can you provide details about the market size?
The market size is estimated to be USD XX Million as of 2022.
5. What are some drivers contributing to market growth?
Megaprojects in Pipeline is Expected to Boost the Construction Sector. Driving the Need for Facility Management Services; Increasing Investment in Healthcare Infrastructure and the Construction of Healthcare Facilities.
6. What are the notable trends driving market growth?
Infrastructural Development Continue to Open Up New Opportunities for SFM Vendors .
7. Are there any restraints impacting market growth?
Increased Instance of Data Breaches and Security Threats.
8. Can you provide examples of recent developments in the market?
June 2022: ISS A/S, a global facility management service provider, bagged a 5-year contract with a major retailer in the US. The company will provide integrated facilities management services across the retail, office, and industrial spaces.
9. What pricing options are available for accessing the report?
Pricing options include single-user, multi-user, and enterprise licenses priced at USD 4750, USD 5250, and USD 8750 respectively.
10. Is the market size provided in terms of value or volume?
The market size is provided in terms of value, measured in Million.
11. Are there any specific market keywords associated with the report?
Yes, the market keyword associated with the report is "Soft Facility Management Market," which aids in identifying and referencing the specific market segment covered.
12. How do I determine which pricing option suits my needs best?
The pricing options vary based on user requirements and access needs. Individual users may opt for single-user licenses, while businesses requiring broader access may choose multi-user or enterprise licenses for cost-effective access to the report.
13. Are there any additional resources or data provided in the Soft Facility Management Market report?
While the report offers comprehensive insights, it's advisable to review the specific contents or supplementary materials provided to ascertain if additional resources or data are available.
14. How can I stay updated on further developments or reports in the Soft Facility Management Market?
To stay informed about further developments, trends, and reports in the Soft Facility Management Market, consider subscribing to industry newsletters, following relevant companies and organizations, or regularly checking reputable industry news sources and publications.
Methodology
Step 1 - Identification of Relevant Samples Size from Population Database


Step 2 - Approaches for Defining Global Market Size (Value, Volume* & Price*)

Note*: In applicable scenarios
Step 3 - Data Sources
Primary Research
- Web Analytics
- Survey Reports
- Research Institute
- Latest Research Reports
- Opinion Leaders
Secondary Research
- Annual Reports
- White Paper
- Latest Press Release
- Industry Association
- Paid Database
- Investor Presentations

Step 4 - Data Triangulation
Involves using different sources of information in order to increase the validity of a study
These sources are likely to be stakeholders in a program - participants, other researchers, program staff, other community members, and so on.
Then we put all data in single framework & apply various statistical tools to find out the dynamic on the market.
During the analysis stage, feedback from the stakeholder groups would be compared to determine areas of agreement as well as areas of divergence


