
Key Insights
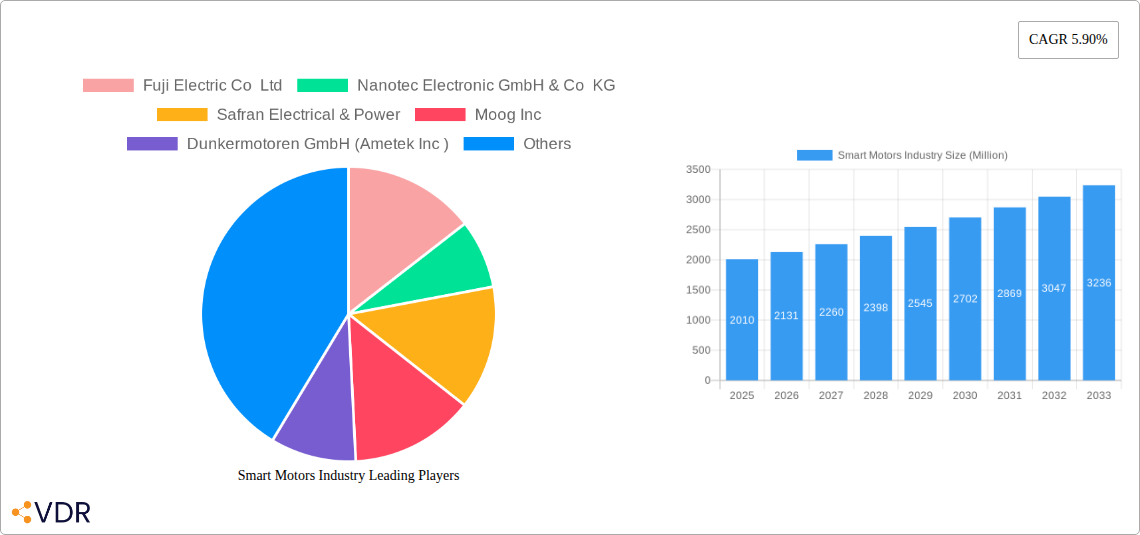
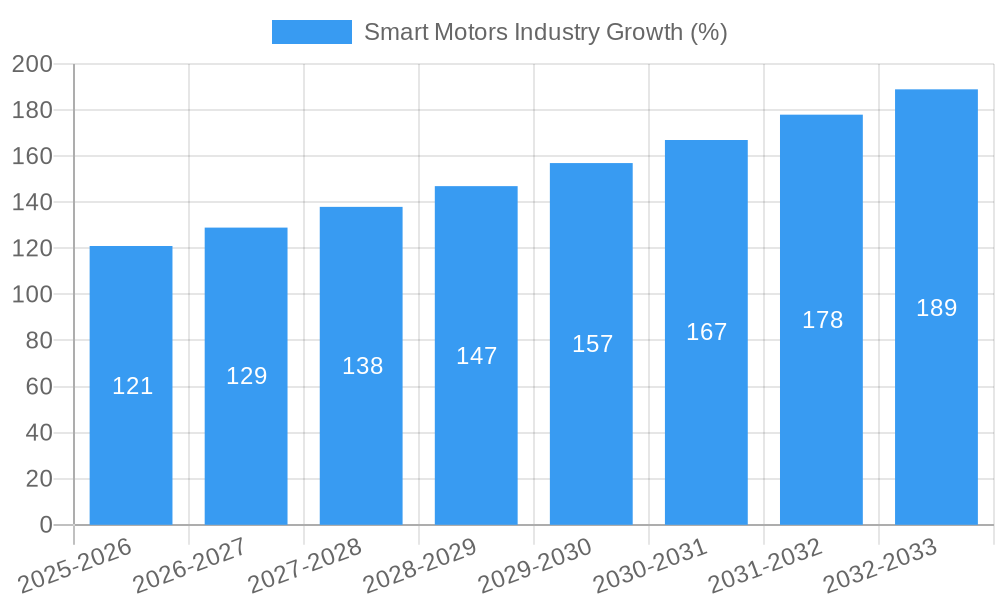
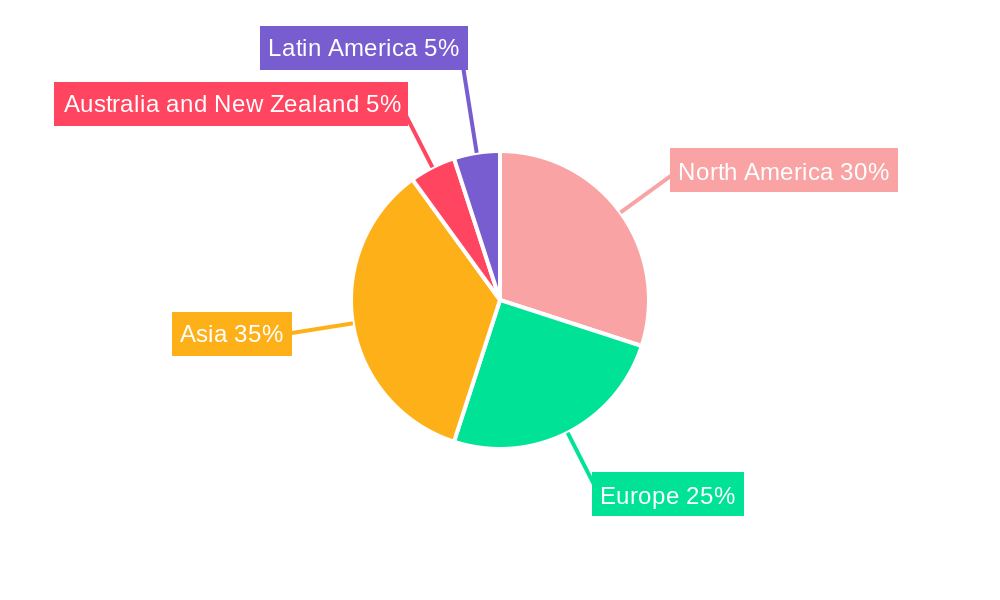
The global smart motors market, valued at approximately $2.01 billion in 2025, is projected to experience robust growth, driven by the increasing adoption of automation and Industry 4.0 technologies across diverse sectors. A compound annual growth rate (CAGR) of 5.90% is anticipated from 2025 to 2033, indicating a significant expansion of the market. Key drivers include the rising demand for energy-efficient solutions, the need for enhanced precision and control in industrial processes, and the growing integration of smart motors in electric vehicles and renewable energy systems. The market is segmented by component (variable speed drives, motors) and application (industrial, commercial, automotive, aerospace & defense, oil & gas, metal & mining, water & wastewater, and other applications). Industrial applications currently dominate, fueled by the automation of manufacturing processes and the increasing adoption of robotics. However, significant growth is expected in the automotive and renewable energy sectors due to the rising demand for electric vehicles and smart grids. The competitive landscape is characterized by a mix of established players like Siemens AG, Nidec Motion Control, and Schneider Electric, alongside emerging technology companies such as Turntide Technologies. Geographical growth is expected across all regions, with Asia predicted to lead the market due to its rapidly expanding manufacturing sector and investments in infrastructure development. However, North America and Europe will remain significant markets, driven by strong industrial automation adoption and focus on energy efficiency.
The restraints to market growth include the high initial investment costs associated with implementing smart motor technologies, the need for skilled labor to manage and maintain these systems, and potential concerns regarding data security and cyber vulnerabilities within interconnected industrial environments. Despite these challenges, the long-term benefits of improved efficiency, reduced operational costs, and enhanced productivity are expected to outweigh these limitations, contributing to continued market expansion throughout the forecast period. Further technological advancements, such as the integration of artificial intelligence and advanced analytics, will likely unlock new applications and accelerate market penetration across various sectors. The focus on sustainable manufacturing and green technologies will also play a significant role in propelling market growth, further solidifying the smart motor market's position as a vital component of the future of industrial automation and beyond.
Smart Motors Industry Market Report: 2019-2033
This comprehensive report provides a detailed analysis of the Smart Motors Industry, encompassing market dynamics, growth trends, regional dominance, product landscape, key players, and future outlook. The study period covers 2019-2033, with 2025 as the base and estimated year. The report segments the market by component (Variable Speed Drive, Motor) and application (Industrial, Commercial, Automotive, Aerospace & Defense, Oil & Gas, Metal & Mining, Water & Wastewater, Other Applications), offering granular insights for informed decision-making. The global smart motors market is projected to reach xx Million units by 2033.
Smart Motors Industry Market Dynamics & Structure
The smart motors market exhibits a moderately concentrated structure, with key players like Siemens AG, Nidec Motion Control, and Schneider Electric SE holding significant market share. Technological innovation, particularly in areas like AI-powered control systems and improved energy efficiency, is a major driver. Stringent environmental regulations and increasing demand for automation across various industries further fuel market growth. However, high initial investment costs and the complexity of integrating smart motor technologies present barriers to entry. Mergers and acquisitions are frequent, with xx deals recorded in the past five years, reflecting consolidation efforts within the sector.
- Market Concentration: Moderately concentrated, with top 5 players holding approximately xx% market share in 2024.
- Technological Innovation: Focus on AI, IoT integration, and energy-efficient designs.
- Regulatory Framework: Stringent emission norms and safety standards influence market dynamics.
- Competitive Substitutes: Traditional motors, but with declining market share due to increasing efficiency and features of smart motors.
- End-User Demographics: Growth driven by industrial automation, renewable energy adoption, and automotive electrification.
- M&A Trends: Consolidation through strategic acquisitions and partnerships.
Smart Motors Industry Growth Trends & Insights
The smart motors market experienced a CAGR of xx% during 2019-2024, driven primarily by the increasing adoption of automation across various industries and the growing demand for energy-efficient solutions. The market is expected to witness sustained growth during the forecast period (2025-2033), with a projected CAGR of xx%. This growth is fueled by technological advancements like the integration of artificial intelligence and improved connectivity, which are enhancing the efficiency and functionality of smart motors. The shift towards Industry 4.0 and the growing emphasis on sustainable practices are also contributing to the market expansion. Market penetration in key sectors like automotive and industrial automation is increasing steadily, further supporting growth projections. Consumer behavior is evolving towards preferring energy-efficient and technologically advanced motor solutions, boosting demand for smart motors.
Dominant Regions, Countries, or Segments in Smart Motors Industry
The Industrial segment dominates the smart motors market, accounting for approximately xx% of the total market share in 2024. This is due to the high demand for automation in manufacturing processes and the growing adoption of smart factories. North America and Europe are currently the leading regions, driven by robust industrial infrastructure and high levels of automation. However, Asia-Pacific is expected to experience significant growth in the coming years, fueled by rapid industrialization and increasing government support for technological advancements.
- Leading Segment: Industrial (xx Million units in 2024).
- Key Drivers (Industrial Segment): Automation, smart factory initiatives, increasing manufacturing output.
- Leading Region: North America (xx Million units in 2024).
- Key Drivers (North America): Robust industrial base, technological advancements, high adoption rates.
- High-Growth Region: Asia-Pacific (projected to reach xx Million units by 2033).
- Key Drivers (Asia-Pacific): Rapid industrialization, government investments in infrastructure.
Smart Motors Industry Product Landscape
Smart motors represent a significant advancement over traditional motors, offering enhanced efficiency, precise control, and improved monitoring capabilities through integrated sensors and advanced control algorithms. These features lead to reduced energy consumption, enhanced productivity, and better overall system performance. The integration of IoT connectivity enables real-time data monitoring and predictive maintenance, minimizing downtime and maximizing operational efficiency. Technological advancements, like the use of AI for optimized control and predictive maintenance, are constantly enhancing the capabilities of smart motors, creating new market opportunities.
Key Drivers, Barriers & Challenges in Smart Motors Industry
Key Drivers: Increasing automation across industries, stringent environmental regulations, rising demand for energy efficiency, and technological advancements such as AI and IoT integration are driving market growth.
Challenges: High initial investment costs, complexity of integration, supply chain disruptions (with an estimated xx% impact on production in 2023), and potential cybersecurity vulnerabilities pose significant challenges. Stringent regulatory compliance requirements also add to the complexity and cost of market entry, impacting smaller players disproportionately.
Emerging Opportunities in Smart Motors Industry
Untapped markets in developing economies, particularly in Asia and Africa, represent significant growth opportunities. Furthermore, the increasing demand for smart motors in emerging applications such as robotics, drones, and electric vehicles presents substantial potential. The evolving consumer preferences towards sustainable and energy-efficient technologies continue to fuel demand for smart motors across various sectors.
Growth Accelerators in the Smart Motors Industry Industry
Technological breakthroughs in areas like AI-powered control systems and advanced materials are key drivers. Strategic partnerships and collaborations between motor manufacturers, software providers, and system integrators accelerate innovation and market penetration. Government initiatives promoting industrial automation and energy efficiency further boost market growth. Expansion into new applications like electric mobility, renewable energy, and smart grids creates additional avenues for market expansion.
Key Players Shaping the Smart Motors Industry Market
- Fuji Electric Co Ltd
- Nanotec Electronic GmbH & Co KG
- Safran Electrical & Power
- Moog Inc
- Dunkermotoren GmbH (Ametek Inc )
- Siemens AG
- Nidec Motion Control (Nidec Corporation)
- Schneider Electric SE
- Shanghai Moons' Electric Co Lt
- Turntide Technologies Inc
Notable Milestones in Smart Motors Industry Sector
- August 2023: Torqeedo partners with c.technology to develop intelligent motors for electric boats, integrating cloud technology.
- June 2023: Moog Animatics' SmartMotor (SM23165DT) replaces stepper motors in Kelch products, improving efficiency and worker safety.
In-Depth Smart Motors Industry Market Outlook
The smart motors market is poised for substantial growth over the next decade, driven by technological advancements, increasing automation across industries, and the rising demand for energy-efficient solutions. Strategic partnerships, expansion into new applications, and government support for sustainable technologies will continue to fuel market expansion. Companies focused on innovation, product differentiation, and robust supply chain management are well-positioned to capitalize on the significant growth opportunities in this dynamic market.
Smart Motors Industry Segmentation
-
1. Component
- 1.1. Variable Speed Drive
- 1.2. Motor
-
2. Application
- 2.1. Industrial
- 2.2. Commercial
- 2.3. Automotive
- 2.4. Aerospace and Defense
- 2.5. Oil and Gas
- 2.6. Metal and Mining
- 2.7. Water and Wastewater
- 2.8. Other Applications
Smart Motors Industry Segmentation By Geography
- 1. North America
- 2. Europe
- 3. Asia
- 4. Australia and New Zealand
- 5. Latin America
Smart Motors Industry REPORT HIGHLIGHTS
| Aspects | Details |
|---|---|
| Study Period | 2019-2033 |
| Base Year | 2024 |
| Estimated Year | 2025 |
| Forecast Period | 2025-2033 |
| Historical Period | 2019-2024 |
| Growth Rate | CAGR of 5.90% from 2019-2033 |
| Segmentation |
|
Table of Contents
- 1. Introduction
- 1.1. Research Scope
- 1.2. Market Segmentation
- 1.3. Research Methodology
- 1.4. Definitions and Assumptions
- 2. Executive Summary
- 2.1. Introduction
- 3. Market Dynamics
- 3.1. Introduction
- 3.2. Market Drivers
- 3.2.1 Increasing Emphasis on Reducing Capex With Gaining Effectiveness of the Equipment; Growing Integration of IIoT Services for Enabling Services Such as Predictive Maintenance
- 3.2.2 Superior Machine Control
- 3.3. Market Restrains
- 3.3.1. Low Rate of Implementation; High Switching Cost Along with Alternate VFD Solutions
- 3.4. Market Trends
- 3.4.1. Industrial Application Segment is Expected to Hold Significant Market Share
- 4. Market Factor Analysis
- 4.1. Porters Five Forces
- 4.2. Supply/Value Chain
- 4.3. PESTEL analysis
- 4.4. Market Entropy
- 4.5. Patent/Trademark Analysis
- 5. Global Smart Motors Industry Analysis, Insights and Forecast, 2019-2031
- 5.1. Market Analysis, Insights and Forecast - by Component
- 5.1.1. Variable Speed Drive
- 5.1.2. Motor
- 5.2. Market Analysis, Insights and Forecast - by Application
- 5.2.1. Industrial
- 5.2.2. Commercial
- 5.2.3. Automotive
- 5.2.4. Aerospace and Defense
- 5.2.5. Oil and Gas
- 5.2.6. Metal and Mining
- 5.2.7. Water and Wastewater
- 5.2.8. Other Applications
- 5.3. Market Analysis, Insights and Forecast - by Region
- 5.3.1. North America
- 5.3.2. Europe
- 5.3.3. Asia
- 5.3.4. Australia and New Zealand
- 5.3.5. Latin America
- 5.1. Market Analysis, Insights and Forecast - by Component
- 6. North America Smart Motors Industry Analysis, Insights and Forecast, 2019-2031
- 6.1. Market Analysis, Insights and Forecast - by Component
- 6.1.1. Variable Speed Drive
- 6.1.2. Motor
- 6.2. Market Analysis, Insights and Forecast - by Application
- 6.2.1. Industrial
- 6.2.2. Commercial
- 6.2.3. Automotive
- 6.2.4. Aerospace and Defense
- 6.2.5. Oil and Gas
- 6.2.6. Metal and Mining
- 6.2.7. Water and Wastewater
- 6.2.8. Other Applications
- 6.1. Market Analysis, Insights and Forecast - by Component
- 7. Europe Smart Motors Industry Analysis, Insights and Forecast, 2019-2031
- 7.1. Market Analysis, Insights and Forecast - by Component
- 7.1.1. Variable Speed Drive
- 7.1.2. Motor
- 7.2. Market Analysis, Insights and Forecast - by Application
- 7.2.1. Industrial
- 7.2.2. Commercial
- 7.2.3. Automotive
- 7.2.4. Aerospace and Defense
- 7.2.5. Oil and Gas
- 7.2.6. Metal and Mining
- 7.2.7. Water and Wastewater
- 7.2.8. Other Applications
- 7.1. Market Analysis, Insights and Forecast - by Component
- 8. Asia Smart Motors Industry Analysis, Insights and Forecast, 2019-2031
- 8.1. Market Analysis, Insights and Forecast - by Component
- 8.1.1. Variable Speed Drive
- 8.1.2. Motor
- 8.2. Market Analysis, Insights and Forecast - by Application
- 8.2.1. Industrial
- 8.2.2. Commercial
- 8.2.3. Automotive
- 8.2.4. Aerospace and Defense
- 8.2.5. Oil and Gas
- 8.2.6. Metal and Mining
- 8.2.7. Water and Wastewater
- 8.2.8. Other Applications
- 8.1. Market Analysis, Insights and Forecast - by Component
- 9. Australia and New Zealand Smart Motors Industry Analysis, Insights and Forecast, 2019-2031
- 9.1. Market Analysis, Insights and Forecast - by Component
- 9.1.1. Variable Speed Drive
- 9.1.2. Motor
- 9.2. Market Analysis, Insights and Forecast - by Application
- 9.2.1. Industrial
- 9.2.2. Commercial
- 9.2.3. Automotive
- 9.2.4. Aerospace and Defense
- 9.2.5. Oil and Gas
- 9.2.6. Metal and Mining
- 9.2.7. Water and Wastewater
- 9.2.8. Other Applications
- 9.1. Market Analysis, Insights and Forecast - by Component
- 10. Latin America Smart Motors Industry Analysis, Insights and Forecast, 2019-2031
- 10.1. Market Analysis, Insights and Forecast - by Component
- 10.1.1. Variable Speed Drive
- 10.1.2. Motor
- 10.2. Market Analysis, Insights and Forecast - by Application
- 10.2.1. Industrial
- 10.2.2. Commercial
- 10.2.3. Automotive
- 10.2.4. Aerospace and Defense
- 10.2.5. Oil and Gas
- 10.2.6. Metal and Mining
- 10.2.7. Water and Wastewater
- 10.2.8. Other Applications
- 10.1. Market Analysis, Insights and Forecast - by Component
- 11. North America Smart Motors Industry Analysis, Insights and Forecast, 2019-2031
- 11.1. Market Analysis, Insights and Forecast - By Country/Sub-region
- 11.1.1.
- 12. Europe Smart Motors Industry Analysis, Insights and Forecast, 2019-2031
- 12.1. Market Analysis, Insights and Forecast - By Country/Sub-region
- 12.1.1.
- 13. Asia Smart Motors Industry Analysis, Insights and Forecast, 2019-2031
- 13.1. Market Analysis, Insights and Forecast - By Country/Sub-region
- 13.1.1.
- 14. Australia and New Zealand Smart Motors Industry Analysis, Insights and Forecast, 2019-2031
- 14.1. Market Analysis, Insights and Forecast - By Country/Sub-region
- 14.1.1.
- 15. Latin America Smart Motors Industry Analysis, Insights and Forecast, 2019-2031
- 15.1. Market Analysis, Insights and Forecast - By Country/Sub-region
- 15.1.1.
- 16. Competitive Analysis
- 16.1. Global Market Share Analysis 2024
- 16.2. Company Profiles
- 16.2.1 Fuji Electric Co Ltd
- 16.2.1.1. Overview
- 16.2.1.2. Products
- 16.2.1.3. SWOT Analysis
- 16.2.1.4. Recent Developments
- 16.2.1.5. Financials (Based on Availability)
- 16.2.2 Nanotec Electronic GmbH & Co KG
- 16.2.2.1. Overview
- 16.2.2.2. Products
- 16.2.2.3. SWOT Analysis
- 16.2.2.4. Recent Developments
- 16.2.2.5. Financials (Based on Availability)
- 16.2.3 Safran Electrical & Power
- 16.2.3.1. Overview
- 16.2.3.2. Products
- 16.2.3.3. SWOT Analysis
- 16.2.3.4. Recent Developments
- 16.2.3.5. Financials (Based on Availability)
- 16.2.4 Moog Inc
- 16.2.4.1. Overview
- 16.2.4.2. Products
- 16.2.4.3. SWOT Analysis
- 16.2.4.4. Recent Developments
- 16.2.4.5. Financials (Based on Availability)
- 16.2.5 Dunkermotoren GmbH (Ametek Inc )
- 16.2.5.1. Overview
- 16.2.5.2. Products
- 16.2.5.3. SWOT Analysis
- 16.2.5.4. Recent Developments
- 16.2.5.5. Financials (Based on Availability)
- 16.2.6 Siemens AG
- 16.2.6.1. Overview
- 16.2.6.2. Products
- 16.2.6.3. SWOT Analysis
- 16.2.6.4. Recent Developments
- 16.2.6.5. Financials (Based on Availability)
- 16.2.7 Nidec Motion Control (Nidec Corporation)
- 16.2.7.1. Overview
- 16.2.7.2. Products
- 16.2.7.3. SWOT Analysis
- 16.2.7.4. Recent Developments
- 16.2.7.5. Financials (Based on Availability)
- 16.2.8 Schneider Electric SE
- 16.2.8.1. Overview
- 16.2.8.2. Products
- 16.2.8.3. SWOT Analysis
- 16.2.8.4. Recent Developments
- 16.2.8.5. Financials (Based on Availability)
- 16.2.9 Shanghai Moons' Electric Co Lt
- 16.2.9.1. Overview
- 16.2.9.2. Products
- 16.2.9.3. SWOT Analysis
- 16.2.9.4. Recent Developments
- 16.2.9.5. Financials (Based on Availability)
- 16.2.10 Turntide Technologies Inc
- 16.2.10.1. Overview
- 16.2.10.2. Products
- 16.2.10.3. SWOT Analysis
- 16.2.10.4. Recent Developments
- 16.2.10.5. Financials (Based on Availability)
- 16.2.1 Fuji Electric Co Ltd
List of Figures
- Figure 1: Global Smart Motors Industry Revenue Breakdown (Million, %) by Region 2024 & 2032
- Figure 2: North America Smart Motors Industry Revenue (Million), by Country 2024 & 2032
- Figure 3: North America Smart Motors Industry Revenue Share (%), by Country 2024 & 2032
- Figure 4: Europe Smart Motors Industry Revenue (Million), by Country 2024 & 2032
- Figure 5: Europe Smart Motors Industry Revenue Share (%), by Country 2024 & 2032
- Figure 6: Asia Smart Motors Industry Revenue (Million), by Country 2024 & 2032
- Figure 7: Asia Smart Motors Industry Revenue Share (%), by Country 2024 & 2032
- Figure 8: Australia and New Zealand Smart Motors Industry Revenue (Million), by Country 2024 & 2032
- Figure 9: Australia and New Zealand Smart Motors Industry Revenue Share (%), by Country 2024 & 2032
- Figure 10: Latin America Smart Motors Industry Revenue (Million), by Country 2024 & 2032
- Figure 11: Latin America Smart Motors Industry Revenue Share (%), by Country 2024 & 2032
- Figure 12: North America Smart Motors Industry Revenue (Million), by Component 2024 & 2032
- Figure 13: North America Smart Motors Industry Revenue Share (%), by Component 2024 & 2032
- Figure 14: North America Smart Motors Industry Revenue (Million), by Application 2024 & 2032
- Figure 15: North America Smart Motors Industry Revenue Share (%), by Application 2024 & 2032
- Figure 16: North America Smart Motors Industry Revenue (Million), by Country 2024 & 2032
- Figure 17: North America Smart Motors Industry Revenue Share (%), by Country 2024 & 2032
- Figure 18: Europe Smart Motors Industry Revenue (Million), by Component 2024 & 2032
- Figure 19: Europe Smart Motors Industry Revenue Share (%), by Component 2024 & 2032
- Figure 20: Europe Smart Motors Industry Revenue (Million), by Application 2024 & 2032
- Figure 21: Europe Smart Motors Industry Revenue Share (%), by Application 2024 & 2032
- Figure 22: Europe Smart Motors Industry Revenue (Million), by Country 2024 & 2032
- Figure 23: Europe Smart Motors Industry Revenue Share (%), by Country 2024 & 2032
- Figure 24: Asia Smart Motors Industry Revenue (Million), by Component 2024 & 2032
- Figure 25: Asia Smart Motors Industry Revenue Share (%), by Component 2024 & 2032
- Figure 26: Asia Smart Motors Industry Revenue (Million), by Application 2024 & 2032
- Figure 27: Asia Smart Motors Industry Revenue Share (%), by Application 2024 & 2032
- Figure 28: Asia Smart Motors Industry Revenue (Million), by Country 2024 & 2032
- Figure 29: Asia Smart Motors Industry Revenue Share (%), by Country 2024 & 2032
- Figure 30: Australia and New Zealand Smart Motors Industry Revenue (Million), by Component 2024 & 2032
- Figure 31: Australia and New Zealand Smart Motors Industry Revenue Share (%), by Component 2024 & 2032
- Figure 32: Australia and New Zealand Smart Motors Industry Revenue (Million), by Application 2024 & 2032
- Figure 33: Australia and New Zealand Smart Motors Industry Revenue Share (%), by Application 2024 & 2032
- Figure 34: Australia and New Zealand Smart Motors Industry Revenue (Million), by Country 2024 & 2032
- Figure 35: Australia and New Zealand Smart Motors Industry Revenue Share (%), by Country 2024 & 2032
- Figure 36: Latin America Smart Motors Industry Revenue (Million), by Component 2024 & 2032
- Figure 37: Latin America Smart Motors Industry Revenue Share (%), by Component 2024 & 2032
- Figure 38: Latin America Smart Motors Industry Revenue (Million), by Application 2024 & 2032
- Figure 39: Latin America Smart Motors Industry Revenue Share (%), by Application 2024 & 2032
- Figure 40: Latin America Smart Motors Industry Revenue (Million), by Country 2024 & 2032
- Figure 41: Latin America Smart Motors Industry Revenue Share (%), by Country 2024 & 2032
List of Tables
- Table 1: Global Smart Motors Industry Revenue Million Forecast, by Region 2019 & 2032
- Table 2: Global Smart Motors Industry Revenue Million Forecast, by Component 2019 & 2032
- Table 3: Global Smart Motors Industry Revenue Million Forecast, by Application 2019 & 2032
- Table 4: Global Smart Motors Industry Revenue Million Forecast, by Region 2019 & 2032
- Table 5: Global Smart Motors Industry Revenue Million Forecast, by Country 2019 & 2032
- Table 6: Smart Motors Industry Revenue (Million) Forecast, by Application 2019 & 2032
- Table 7: Global Smart Motors Industry Revenue Million Forecast, by Country 2019 & 2032
- Table 8: Smart Motors Industry Revenue (Million) Forecast, by Application 2019 & 2032
- Table 9: Global Smart Motors Industry Revenue Million Forecast, by Country 2019 & 2032
- Table 10: Smart Motors Industry Revenue (Million) Forecast, by Application 2019 & 2032
- Table 11: Global Smart Motors Industry Revenue Million Forecast, by Country 2019 & 2032
- Table 12: Smart Motors Industry Revenue (Million) Forecast, by Application 2019 & 2032
- Table 13: Global Smart Motors Industry Revenue Million Forecast, by Country 2019 & 2032
- Table 14: Smart Motors Industry Revenue (Million) Forecast, by Application 2019 & 2032
- Table 15: Global Smart Motors Industry Revenue Million Forecast, by Component 2019 & 2032
- Table 16: Global Smart Motors Industry Revenue Million Forecast, by Application 2019 & 2032
- Table 17: Global Smart Motors Industry Revenue Million Forecast, by Country 2019 & 2032
- Table 18: Global Smart Motors Industry Revenue Million Forecast, by Component 2019 & 2032
- Table 19: Global Smart Motors Industry Revenue Million Forecast, by Application 2019 & 2032
- Table 20: Global Smart Motors Industry Revenue Million Forecast, by Country 2019 & 2032
- Table 21: Global Smart Motors Industry Revenue Million Forecast, by Component 2019 & 2032
- Table 22: Global Smart Motors Industry Revenue Million Forecast, by Application 2019 & 2032
- Table 23: Global Smart Motors Industry Revenue Million Forecast, by Country 2019 & 2032
- Table 24: Global Smart Motors Industry Revenue Million Forecast, by Component 2019 & 2032
- Table 25: Global Smart Motors Industry Revenue Million Forecast, by Application 2019 & 2032
- Table 26: Global Smart Motors Industry Revenue Million Forecast, by Country 2019 & 2032
- Table 27: Global Smart Motors Industry Revenue Million Forecast, by Component 2019 & 2032
- Table 28: Global Smart Motors Industry Revenue Million Forecast, by Application 2019 & 2032
- Table 29: Global Smart Motors Industry Revenue Million Forecast, by Country 2019 & 2032
Frequently Asked Questions
1. What is the projected Compound Annual Growth Rate (CAGR) of the Smart Motors Industry?
The projected CAGR is approximately 5.90%.
2. Which companies are prominent players in the Smart Motors Industry?
Key companies in the market include Fuji Electric Co Ltd, Nanotec Electronic GmbH & Co KG, Safran Electrical & Power, Moog Inc, Dunkermotoren GmbH (Ametek Inc ), Siemens AG, Nidec Motion Control (Nidec Corporation), Schneider Electric SE, Shanghai Moons' Electric Co Lt, Turntide Technologies Inc.
3. What are the main segments of the Smart Motors Industry?
The market segments include Component, Application.
4. Can you provide details about the market size?
The market size is estimated to be USD 2.01 Million as of 2022.
5. What are some drivers contributing to market growth?
Increasing Emphasis on Reducing Capex With Gaining Effectiveness of the Equipment; Growing Integration of IIoT Services for Enabling Services Such as Predictive Maintenance. Superior Machine Control.
6. What are the notable trends driving market growth?
Industrial Application Segment is Expected to Hold Significant Market Share.
7. Are there any restraints impacting market growth?
Low Rate of Implementation; High Switching Cost Along with Alternate VFD Solutions.
8. Can you provide examples of recent developments in the market?
August 2023 - Torqeedo, a leading player in electric boating, partnered with c.technology, a cutting-edge SaaS cloud infrastructure provider for power sport vehicles. This collaboration aims to develop intelligent motors and introduce an innovative software system. By integrating cloud technology into its electric boating products, Torqeedo continues its commitment to enhancing sustainability and user experience.
9. What pricing options are available for accessing the report?
Pricing options include single-user, multi-user, and enterprise licenses priced at USD 4750, USD 5250, and USD 8750 respectively.
10. Is the market size provided in terms of value or volume?
The market size is provided in terms of value, measured in Million.
11. Are there any specific market keywords associated with the report?
Yes, the market keyword associated with the report is "Smart Motors Industry," which aids in identifying and referencing the specific market segment covered.
12. How do I determine which pricing option suits my needs best?
The pricing options vary based on user requirements and access needs. Individual users may opt for single-user licenses, while businesses requiring broader access may choose multi-user or enterprise licenses for cost-effective access to the report.
13. Are there any additional resources or data provided in the Smart Motors Industry report?
While the report offers comprehensive insights, it's advisable to review the specific contents or supplementary materials provided to ascertain if additional resources or data are available.
14. How can I stay updated on further developments or reports in the Smart Motors Industry?
To stay informed about further developments, trends, and reports in the Smart Motors Industry, consider subscribing to industry newsletters, following relevant companies and organizations, or regularly checking reputable industry news sources and publications.
Methodology
Step 1 - Identification of Relevant Samples Size from Population Database


Step 2 - Approaches for Defining Global Market Size (Value, Volume* & Price*)

Note*: In applicable scenarios
Step 3 - Data Sources
Primary Research
- Web Analytics
- Survey Reports
- Research Institute
- Latest Research Reports
- Opinion Leaders
Secondary Research
- Annual Reports
- White Paper
- Latest Press Release
- Industry Association
- Paid Database
- Investor Presentations

Step 4 - Data Triangulation
Involves using different sources of information in order to increase the validity of a study
These sources are likely to be stakeholders in a program - participants, other researchers, program staff, other community members, and so on.
Then we put all data in single framework & apply various statistical tools to find out the dynamic on the market.
During the analysis stage, feedback from the stakeholder groups would be compared to determine areas of agreement as well as areas of divergence


