
Key Insights
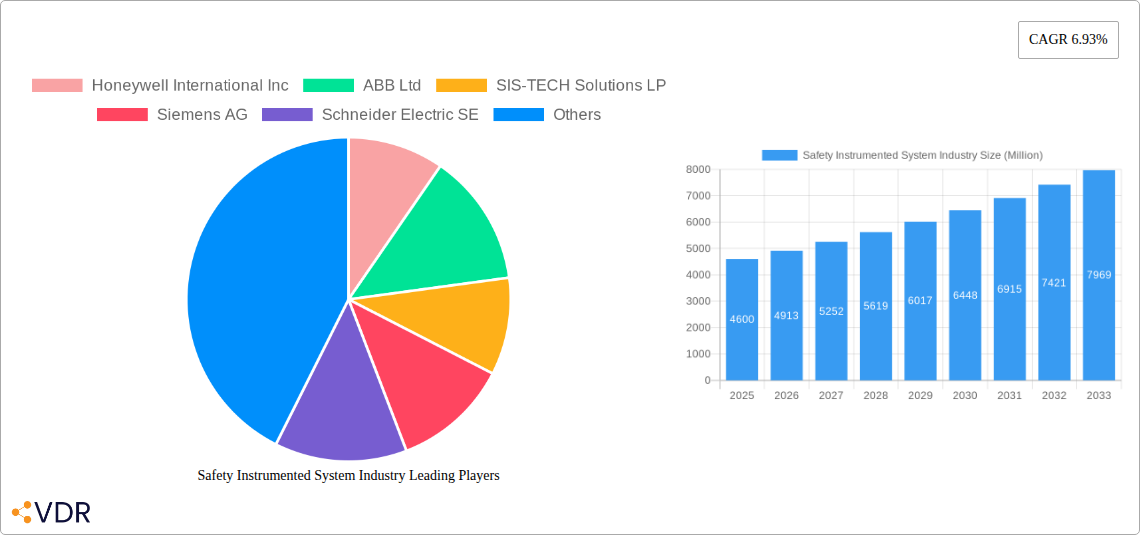
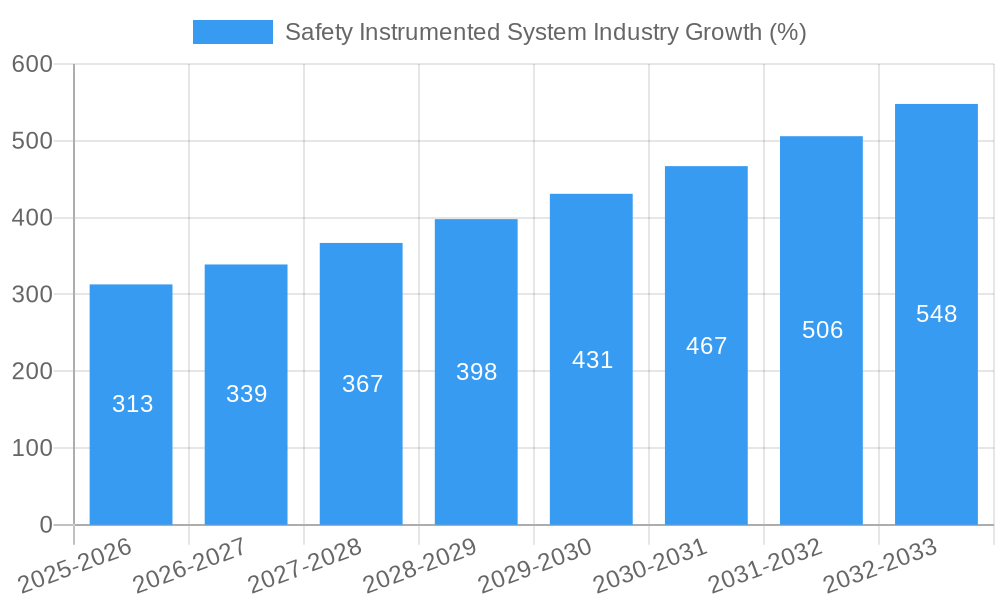
The Safety Instrumented Systems (SIS) market, valued at $4.60 billion in 2025, is projected to experience robust growth, driven by increasing demand for enhanced safety and operational reliability across diverse industries. A Compound Annual Growth Rate (CAGR) of 6.93% from 2025 to 2033 indicates a significant market expansion, reaching an estimated value exceeding $8 billion by 2033. Key growth drivers include stringent safety regulations across sectors like oil & gas, chemicals, and power generation, coupled with the rising adoption of Industry 4.0 technologies and digitalization initiatives to improve process automation and safety monitoring. The increasing complexity of industrial processes and the need to prevent catastrophic accidents are further fueling market expansion. Significant segments include Emergency Shutdown Systems (ESD), Fire and Gas Monitoring and Control (F&GC), and High Integrity Pressure Protection Systems (HIPPS), with the oil and gas and chemical sectors representing major end-user industries. While supply chain disruptions and initial investment costs associated with SIS implementation present some challenges, the long-term benefits of enhanced safety and reduced operational downtime outweigh these restraints, ensuring continued market growth.
The competitive landscape is marked by the presence of both established players like Honeywell, ABB, Siemens, and Schneider Electric, and specialized solution providers. These companies are constantly innovating to offer advanced features like improved diagnostics, remote monitoring capabilities, and seamless integration with existing plant infrastructure. Future growth will likely be influenced by technological advancements such as artificial intelligence (AI) and machine learning (ML) for predictive maintenance and improved safety analytics, as well as the expanding adoption of SIS in emerging markets like Asia-Pacific, driven by industrialization and infrastructure development. The market is also expected to witness increased consolidation through mergers and acquisitions as companies strive to expand their market share and product portfolios. The focus will be on providing comprehensive solutions that address the evolving safety needs of various industries.
Safety Instrumented System (SIS) Industry Market Report: 2019-2033
This comprehensive report provides a detailed analysis of the Safety Instrumented System (SIS) industry, encompassing market dynamics, growth trends, regional dominance, product landscape, key players, and future outlook. The study period covers 2019-2033, with 2025 as the base and estimated year. The report caters to industry professionals, investors, and researchers seeking a thorough understanding of this critical sector. The market is segmented by application (Emergency Shutdown Systems (ESD), Fire and Gas Monitoring and Control (F&GC), High Integrity Pressure Protection Systems (HIPPS), Burner Management Systems (BMS), Turbo Machinery Control, Other Applications) and end-user (Chemicals and Petrochemicals, Power Generation, Pharmaceutical, Food and Beverage, Oil and Gas, Other End Users). The total market size in 2025 is estimated at XX Million units, projected to reach YY Million units by 2033.
Safety Instrumented System Industry Market Dynamics & Structure
The SIS market is characterized by moderate concentration, with key players like Honeywell International Inc, ABB Ltd, Siemens AG, and Schneider Electric SE holding significant market share. Technological innovation, driven by advancements in automation, AI, and IoT, is a major growth driver. Stringent safety regulations across various industries, particularly in Oil & Gas and Chemicals, create substantial demand. However, high initial investment costs and complex integration processes present challenges. Competitive substitutes, such as traditional safety systems, pose a threat, although SIS's superior reliability and safety features are a strong differentiator. M&A activity in the sector has been relatively low in recent years, with an estimated XX deals annually in the last five years.
- Market Concentration: Moderately concentrated, with top 5 players holding approximately 60% market share.
- Technological Innovation: AI-driven predictive maintenance, IoT-enabled remote monitoring, and advanced process control systems are driving innovation.
- Regulatory Framework: Stringent safety standards (e.g., IEC 61508, IEC 61511) are key market drivers.
- Competitive Substitutes: Traditional safety systems offer lower upfront costs but lack the advanced capabilities of SIS.
- End-User Demographics: Oil & Gas, Chemicals & Petrochemicals, and Power Generation are major end-users.
- M&A Trends: Low frequency, primarily focused on technology integration and expansion into new markets.
Safety Instrumented System Industry Growth Trends & Insights
The SIS market experienced steady growth during the historical period (2019-2024), driven by increasing industrial automation and stricter safety regulations. The market size in 2024 was estimated at ZZ Million units. The CAGR during this period is estimated at X%. The forecast period (2025-2033) is expected to witness accelerated growth, fueled by digitalization efforts in various sectors. Adoption rates are particularly high in sectors with inherent safety risks and substantial regulatory pressures. Technological disruptions, such as the integration of AI and machine learning for predictive maintenance, are boosting demand. Consumer behavior shifts towards heightened safety and reliability concerns further strengthen the market. The market penetration rate is predicted to reach Y% by 2033, with a projected CAGR of Z%.
Dominant Regions, Countries, or Segments in Safety Instrumented System Industry
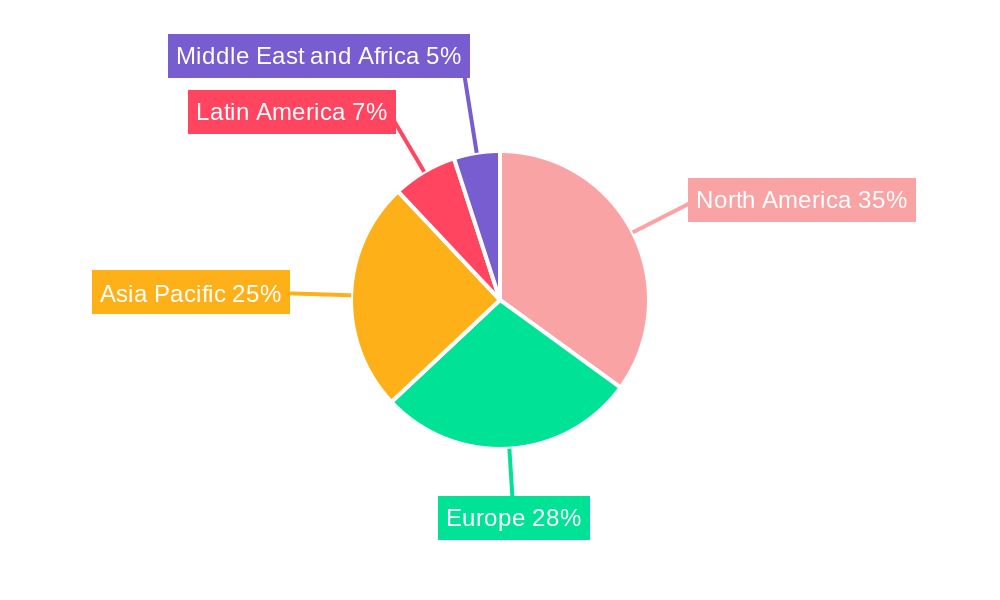
The North American and European regions currently dominate the SIS market, driven by robust industrial infrastructure, stringent safety regulations, and a high concentration of key players. Within applications, Emergency Shutdown Systems (ESD) and High Integrity Pressure Protection Systems (HIPPS) hold the largest market share, accounting for approximately 65% of total revenue. Within end-users, the Oil & Gas and Chemicals & Petrochemicals sectors are the largest consumers. The Asia-Pacific region is expected to experience the fastest growth, driven by rapid industrialization and investments in infrastructure development.
- Key Drivers:
- Stringent safety regulations in developed regions.
- High industrial automation levels in developed nations.
- Rapid industrialization and infrastructure development in emerging economies.
- Dominance Factors:
- High concentration of industry leaders in North America and Europe.
- Strong regulatory framework and compliance requirements.
- Early adoption of advanced technologies.
Safety Instrumented System Industry Product Landscape
The SIS product landscape is characterized by a diverse range of systems, varying in complexity, functionalities, and integration capabilities. Recent innovations include advanced diagnostic capabilities, improved cybersecurity features, and seamless integration with other industrial automation systems. Key product differentiators focus on ease of use, reliability, and cost-effectiveness. Leading vendors continuously incorporate technological advancements, such as AI and predictive maintenance, to enhance the value proposition and address evolving industry needs.
Key Drivers, Barriers & Challenges in Safety Instrumented System Industry
Key Drivers:
- Increasing industrial automation and digitalization across various sectors.
- Stricter safety regulations and compliance requirements globally.
- Growing demand for improved process safety and risk management.
Key Challenges and Restraints:
- High initial investment costs associated with SIS implementation.
- Complexity of integration with existing plant infrastructure.
- Concerns over cybersecurity vulnerabilities.
- Skilled labor shortages for installation and maintenance.
Emerging Opportunities in Safety Instrumented System Industry
- Expanding applications in renewable energy sectors (e.g., wind power, solar power).
- Growing demand for SIS in emerging economies.
- Increased use of cloud-based platforms and remote monitoring capabilities.
- Development of more sophisticated SIS systems integrating AI and machine learning.
Growth Accelerators in the Safety Instrumented System Industry
The long-term growth of the SIS market will be accelerated by several factors: advancements in IoT and AI integration leading to enhanced predictive maintenance and remote monitoring capabilities; strategic partnerships between SIS providers and end-user companies to develop customized solutions; continued expansion into developing economies with a growing need for improved safety and efficiency; and ongoing development of industry-specific standards and regulations that mandate SIS implementation.
Key Players Shaping the Safety Instrumented System Industry Market
- Honeywell International Inc
- ABB Ltd
- SIS-TECH Solutions LP
- Siemens AG
- Schneider Electric SE
- HIMA Paul Hildebrandt GmbH
- Rockwell Automation Inc
- Yokogawa Electric Corporation
- Schlumberger Limited
- Emerson Electric Company
Notable Milestones in Safety Instrumented System Industry Sector
- January 2021: Yokogawa Electric Corporation developed ProSafe-RS Lite, a SIL2 safety instrumented system.
- March 2021: BASF implemented HIMA safety technology in a new production facility.
- June 2021: Intel Atom x6000E series processors received IEC61508 SIL2 and ISO13849 certifications, enhancing SIS applications.
In-Depth Safety Instrumented System Industry Market Outlook
The future of the SIS market is bright, with strong growth potential driven by ongoing technological advancements, increasing regulatory pressures, and the expanding adoption of automation across diverse industries. Strategic opportunities exist in developing customized solutions for specific industry sectors, focusing on emerging markets with rapid industrialization, and strengthening cybersecurity features to meet heightened concerns. The market is poised for continuous growth driven by its inherent importance in enhancing safety, productivity, and efficiency across critical industries.
Safety Instrumented System Industry Segmentation
-
1. Application
- 1.1. Emergency Shutdown Systems (ESD)
- 1.2. Fire and Gas Monitoring and Control (F&GC)
- 1.3. High Integrity Pressure Protection Systems (HIPPS)
- 1.4. Burner Management Systems (BMS)
- 1.5. Turbo Machinery Control
- 1.6. Other Applications
-
2. End User
- 2.1. Chemicals and Petrochemicals
- 2.2. Power Generation
- 2.3. Pharmaceutical
- 2.4. Food and Beverage
- 2.5. Oil and Gas
- 2.6. Other End Users
Safety Instrumented System Industry Segmentation By Geography
- 1. North America
- 2. Europe
- 3. Asia
- 4. Australia and New Zealand
- 5. Latin America
- 6. Middle East
- 7. Africa
Safety Instrumented System Industry REPORT HIGHLIGHTS
| Aspects | Details |
|---|---|
| Study Period | 2019-2033 |
| Base Year | 2024 |
| Estimated Year | 2025 |
| Forecast Period | 2025-2033 |
| Historical Period | 2019-2024 |
| Growth Rate | CAGR of 6.93% from 2019-2033 |
| Segmentation |
|
Table of Contents
- 1. Introduction
- 1.1. Research Scope
- 1.2. Market Segmentation
- 1.3. Research Methodology
- 1.4. Definitions and Assumptions
- 2. Executive Summary
- 2.1. Introduction
- 3. Market Dynamics
- 3.1. Introduction
- 3.2. Market Drivers
- 3.2.1. Growing Regulatory Environment in the Industry; Presence of Robust SIS Service Ecosystem
- 3.3. Market Restrains
- 3.3.1. Operational Complexity Coupled with High Maintenance Costs
- 3.4. Market Trends
- 3.4.1. The Chemical and Petrochemical Industry is expected to Hold a Major Market Share
- 4. Market Factor Analysis
- 4.1. Porters Five Forces
- 4.2. Supply/Value Chain
- 4.3. PESTEL analysis
- 4.4. Market Entropy
- 4.5. Patent/Trademark Analysis
- 5. Global Safety Instrumented System Industry Analysis, Insights and Forecast, 2019-2031
- 5.1. Market Analysis, Insights and Forecast - by Application
- 5.1.1. Emergency Shutdown Systems (ESD)
- 5.1.2. Fire and Gas Monitoring and Control (F&GC)
- 5.1.3. High Integrity Pressure Protection Systems (HIPPS)
- 5.1.4. Burner Management Systems (BMS)
- 5.1.5. Turbo Machinery Control
- 5.1.6. Other Applications
- 5.2. Market Analysis, Insights and Forecast - by End User
- 5.2.1. Chemicals and Petrochemicals
- 5.2.2. Power Generation
- 5.2.3. Pharmaceutical
- 5.2.4. Food and Beverage
- 5.2.5. Oil and Gas
- 5.2.6. Other End Users
- 5.3. Market Analysis, Insights and Forecast - by Region
- 5.3.1. North America
- 5.3.2. Europe
- 5.3.3. Asia
- 5.3.4. Australia and New Zealand
- 5.3.5. Latin America
- 5.3.6. Middle East
- 5.3.7. Africa
- 5.1. Market Analysis, Insights and Forecast - by Application
- 6. North America Safety Instrumented System Industry Analysis, Insights and Forecast, 2019-2031
- 6.1. Market Analysis, Insights and Forecast - by Application
- 6.1.1. Emergency Shutdown Systems (ESD)
- 6.1.2. Fire and Gas Monitoring and Control (F&GC)
- 6.1.3. High Integrity Pressure Protection Systems (HIPPS)
- 6.1.4. Burner Management Systems (BMS)
- 6.1.5. Turbo Machinery Control
- 6.1.6. Other Applications
- 6.2. Market Analysis, Insights and Forecast - by End User
- 6.2.1. Chemicals and Petrochemicals
- 6.2.2. Power Generation
- 6.2.3. Pharmaceutical
- 6.2.4. Food and Beverage
- 6.2.5. Oil and Gas
- 6.2.6. Other End Users
- 6.1. Market Analysis, Insights and Forecast - by Application
- 7. Europe Safety Instrumented System Industry Analysis, Insights and Forecast, 2019-2031
- 7.1. Market Analysis, Insights and Forecast - by Application
- 7.1.1. Emergency Shutdown Systems (ESD)
- 7.1.2. Fire and Gas Monitoring and Control (F&GC)
- 7.1.3. High Integrity Pressure Protection Systems (HIPPS)
- 7.1.4. Burner Management Systems (BMS)
- 7.1.5. Turbo Machinery Control
- 7.1.6. Other Applications
- 7.2. Market Analysis, Insights and Forecast - by End User
- 7.2.1. Chemicals and Petrochemicals
- 7.2.2. Power Generation
- 7.2.3. Pharmaceutical
- 7.2.4. Food and Beverage
- 7.2.5. Oil and Gas
- 7.2.6. Other End Users
- 7.1. Market Analysis, Insights and Forecast - by Application
- 8. Asia Safety Instrumented System Industry Analysis, Insights and Forecast, 2019-2031
- 8.1. Market Analysis, Insights and Forecast - by Application
- 8.1.1. Emergency Shutdown Systems (ESD)
- 8.1.2. Fire and Gas Monitoring and Control (F&GC)
- 8.1.3. High Integrity Pressure Protection Systems (HIPPS)
- 8.1.4. Burner Management Systems (BMS)
- 8.1.5. Turbo Machinery Control
- 8.1.6. Other Applications
- 8.2. Market Analysis, Insights and Forecast - by End User
- 8.2.1. Chemicals and Petrochemicals
- 8.2.2. Power Generation
- 8.2.3. Pharmaceutical
- 8.2.4. Food and Beverage
- 8.2.5. Oil and Gas
- 8.2.6. Other End Users
- 8.1. Market Analysis, Insights and Forecast - by Application
- 9. Australia and New Zealand Safety Instrumented System Industry Analysis, Insights and Forecast, 2019-2031
- 9.1. Market Analysis, Insights and Forecast - by Application
- 9.1.1. Emergency Shutdown Systems (ESD)
- 9.1.2. Fire and Gas Monitoring and Control (F&GC)
- 9.1.3. High Integrity Pressure Protection Systems (HIPPS)
- 9.1.4. Burner Management Systems (BMS)
- 9.1.5. Turbo Machinery Control
- 9.1.6. Other Applications
- 9.2. Market Analysis, Insights and Forecast - by End User
- 9.2.1. Chemicals and Petrochemicals
- 9.2.2. Power Generation
- 9.2.3. Pharmaceutical
- 9.2.4. Food and Beverage
- 9.2.5. Oil and Gas
- 9.2.6. Other End Users
- 9.1. Market Analysis, Insights and Forecast - by Application
- 10. Latin America Safety Instrumented System Industry Analysis, Insights and Forecast, 2019-2031
- 10.1. Market Analysis, Insights and Forecast - by Application
- 10.1.1. Emergency Shutdown Systems (ESD)
- 10.1.2. Fire and Gas Monitoring and Control (F&GC)
- 10.1.3. High Integrity Pressure Protection Systems (HIPPS)
- 10.1.4. Burner Management Systems (BMS)
- 10.1.5. Turbo Machinery Control
- 10.1.6. Other Applications
- 10.2. Market Analysis, Insights and Forecast - by End User
- 10.2.1. Chemicals and Petrochemicals
- 10.2.2. Power Generation
- 10.2.3. Pharmaceutical
- 10.2.4. Food and Beverage
- 10.2.5. Oil and Gas
- 10.2.6. Other End Users
- 10.1. Market Analysis, Insights and Forecast - by Application
- 11. Middle East Safety Instrumented System Industry Analysis, Insights and Forecast, 2019-2031
- 11.1. Market Analysis, Insights and Forecast - by Application
- 11.1.1. Emergency Shutdown Systems (ESD)
- 11.1.2. Fire and Gas Monitoring and Control (F&GC)
- 11.1.3. High Integrity Pressure Protection Systems (HIPPS)
- 11.1.4. Burner Management Systems (BMS)
- 11.1.5. Turbo Machinery Control
- 11.1.6. Other Applications
- 11.2. Market Analysis, Insights and Forecast - by End User
- 11.2.1. Chemicals and Petrochemicals
- 11.2.2. Power Generation
- 11.2.3. Pharmaceutical
- 11.2.4. Food and Beverage
- 11.2.5. Oil and Gas
- 11.2.6. Other End Users
- 11.1. Market Analysis, Insights and Forecast - by Application
- 12. Africa Safety Instrumented System Industry Analysis, Insights and Forecast, 2019-2031
- 12.1. Market Analysis, Insights and Forecast - by Application
- 12.1.1. Emergency Shutdown Systems (ESD)
- 12.1.2. Fire and Gas Monitoring and Control (F&GC)
- 12.1.3. High Integrity Pressure Protection Systems (HIPPS)
- 12.1.4. Burner Management Systems (BMS)
- 12.1.5. Turbo Machinery Control
- 12.1.6. Other Applications
- 12.2. Market Analysis, Insights and Forecast - by End User
- 12.2.1. Chemicals and Petrochemicals
- 12.2.2. Power Generation
- 12.2.3. Pharmaceutical
- 12.2.4. Food and Beverage
- 12.2.5. Oil and Gas
- 12.2.6. Other End Users
- 12.1. Market Analysis, Insights and Forecast - by Application
- 13. North America Safety Instrumented System Industry Analysis, Insights and Forecast, 2019-2031
- 13.1. Market Analysis, Insights and Forecast - By Country/Sub-region
- 13.1.1.
- 14. Europe Safety Instrumented System Industry Analysis, Insights and Forecast, 2019-2031
- 14.1. Market Analysis, Insights and Forecast - By Country/Sub-region
- 14.1.1.
- 15. Asia Pacific Safety Instrumented System Industry Analysis, Insights and Forecast, 2019-2031
- 15.1. Market Analysis, Insights and Forecast - By Country/Sub-region
- 15.1.1.
- 16. Latin America Safety Instrumented System Industry Analysis, Insights and Forecast, 2019-2031
- 16.1. Market Analysis, Insights and Forecast - By Country/Sub-region
- 16.1.1.
- 17. Middle East and Africa Safety Instrumented System Industry Analysis, Insights and Forecast, 2019-2031
- 17.1. Market Analysis, Insights and Forecast - By Country/Sub-region
- 17.1.1.
- 18. Competitive Analysis
- 18.1. Global Market Share Analysis 2024
- 18.2. Company Profiles
- 18.2.1 Honeywell International Inc
- 18.2.1.1. Overview
- 18.2.1.2. Products
- 18.2.1.3. SWOT Analysis
- 18.2.1.4. Recent Developments
- 18.2.1.5. Financials (Based on Availability)
- 18.2.2 ABB Ltd
- 18.2.2.1. Overview
- 18.2.2.2. Products
- 18.2.2.3. SWOT Analysis
- 18.2.2.4. Recent Developments
- 18.2.2.5. Financials (Based on Availability)
- 18.2.3 SIS-TECH Solutions LP
- 18.2.3.1. Overview
- 18.2.3.2. Products
- 18.2.3.3. SWOT Analysis
- 18.2.3.4. Recent Developments
- 18.2.3.5. Financials (Based on Availability)
- 18.2.4 Siemens AG
- 18.2.4.1. Overview
- 18.2.4.2. Products
- 18.2.4.3. SWOT Analysis
- 18.2.4.4. Recent Developments
- 18.2.4.5. Financials (Based on Availability)
- 18.2.5 Schneider Electric SE
- 18.2.5.1. Overview
- 18.2.5.2. Products
- 18.2.5.3. SWOT Analysis
- 18.2.5.4. Recent Developments
- 18.2.5.5. Financials (Based on Availability)
- 18.2.6 HIMA Paul Hildebrandt GmbH
- 18.2.6.1. Overview
- 18.2.6.2. Products
- 18.2.6.3. SWOT Analysis
- 18.2.6.4. Recent Developments
- 18.2.6.5. Financials (Based on Availability)
- 18.2.7 Rockwell Automation Inc
- 18.2.7.1. Overview
- 18.2.7.2. Products
- 18.2.7.3. SWOT Analysis
- 18.2.7.4. Recent Developments
- 18.2.7.5. Financials (Based on Availability)
- 18.2.8 Yokogawa Electric Corporation
- 18.2.8.1. Overview
- 18.2.8.2. Products
- 18.2.8.3. SWOT Analysis
- 18.2.8.4. Recent Developments
- 18.2.8.5. Financials (Based on Availability)
- 18.2.9 Schlumberger Limited*List Not Exhaustive
- 18.2.9.1. Overview
- 18.2.9.2. Products
- 18.2.9.3. SWOT Analysis
- 18.2.9.4. Recent Developments
- 18.2.9.5. Financials (Based on Availability)
- 18.2.10 Emerson Electric Company
- 18.2.10.1. Overview
- 18.2.10.2. Products
- 18.2.10.3. SWOT Analysis
- 18.2.10.4. Recent Developments
- 18.2.10.5. Financials (Based on Availability)
- 18.2.1 Honeywell International Inc
List of Figures
- Figure 1: Global Safety Instrumented System Industry Revenue Breakdown (Million, %) by Region 2024 & 2032
- Figure 2: North America Safety Instrumented System Industry Revenue (Million), by Country 2024 & 2032
- Figure 3: North America Safety Instrumented System Industry Revenue Share (%), by Country 2024 & 2032
- Figure 4: Europe Safety Instrumented System Industry Revenue (Million), by Country 2024 & 2032
- Figure 5: Europe Safety Instrumented System Industry Revenue Share (%), by Country 2024 & 2032
- Figure 6: Asia Pacific Safety Instrumented System Industry Revenue (Million), by Country 2024 & 2032
- Figure 7: Asia Pacific Safety Instrumented System Industry Revenue Share (%), by Country 2024 & 2032
- Figure 8: Latin America Safety Instrumented System Industry Revenue (Million), by Country 2024 & 2032
- Figure 9: Latin America Safety Instrumented System Industry Revenue Share (%), by Country 2024 & 2032
- Figure 10: Middle East and Africa Safety Instrumented System Industry Revenue (Million), by Country 2024 & 2032
- Figure 11: Middle East and Africa Safety Instrumented System Industry Revenue Share (%), by Country 2024 & 2032
- Figure 12: North America Safety Instrumented System Industry Revenue (Million), by Application 2024 & 2032
- Figure 13: North America Safety Instrumented System Industry Revenue Share (%), by Application 2024 & 2032
- Figure 14: North America Safety Instrumented System Industry Revenue (Million), by End User 2024 & 2032
- Figure 15: North America Safety Instrumented System Industry Revenue Share (%), by End User 2024 & 2032
- Figure 16: North America Safety Instrumented System Industry Revenue (Million), by Country 2024 & 2032
- Figure 17: North America Safety Instrumented System Industry Revenue Share (%), by Country 2024 & 2032
- Figure 18: Europe Safety Instrumented System Industry Revenue (Million), by Application 2024 & 2032
- Figure 19: Europe Safety Instrumented System Industry Revenue Share (%), by Application 2024 & 2032
- Figure 20: Europe Safety Instrumented System Industry Revenue (Million), by End User 2024 & 2032
- Figure 21: Europe Safety Instrumented System Industry Revenue Share (%), by End User 2024 & 2032
- Figure 22: Europe Safety Instrumented System Industry Revenue (Million), by Country 2024 & 2032
- Figure 23: Europe Safety Instrumented System Industry Revenue Share (%), by Country 2024 & 2032
- Figure 24: Asia Safety Instrumented System Industry Revenue (Million), by Application 2024 & 2032
- Figure 25: Asia Safety Instrumented System Industry Revenue Share (%), by Application 2024 & 2032
- Figure 26: Asia Safety Instrumented System Industry Revenue (Million), by End User 2024 & 2032
- Figure 27: Asia Safety Instrumented System Industry Revenue Share (%), by End User 2024 & 2032
- Figure 28: Asia Safety Instrumented System Industry Revenue (Million), by Country 2024 & 2032
- Figure 29: Asia Safety Instrumented System Industry Revenue Share (%), by Country 2024 & 2032
- Figure 30: Australia and New Zealand Safety Instrumented System Industry Revenue (Million), by Application 2024 & 2032
- Figure 31: Australia and New Zealand Safety Instrumented System Industry Revenue Share (%), by Application 2024 & 2032
- Figure 32: Australia and New Zealand Safety Instrumented System Industry Revenue (Million), by End User 2024 & 2032
- Figure 33: Australia and New Zealand Safety Instrumented System Industry Revenue Share (%), by End User 2024 & 2032
- Figure 34: Australia and New Zealand Safety Instrumented System Industry Revenue (Million), by Country 2024 & 2032
- Figure 35: Australia and New Zealand Safety Instrumented System Industry Revenue Share (%), by Country 2024 & 2032
- Figure 36: Latin America Safety Instrumented System Industry Revenue (Million), by Application 2024 & 2032
- Figure 37: Latin America Safety Instrumented System Industry Revenue Share (%), by Application 2024 & 2032
- Figure 38: Latin America Safety Instrumented System Industry Revenue (Million), by End User 2024 & 2032
- Figure 39: Latin America Safety Instrumented System Industry Revenue Share (%), by End User 2024 & 2032
- Figure 40: Latin America Safety Instrumented System Industry Revenue (Million), by Country 2024 & 2032
- Figure 41: Latin America Safety Instrumented System Industry Revenue Share (%), by Country 2024 & 2032
- Figure 42: Middle East Safety Instrumented System Industry Revenue (Million), by Application 2024 & 2032
- Figure 43: Middle East Safety Instrumented System Industry Revenue Share (%), by Application 2024 & 2032
- Figure 44: Middle East Safety Instrumented System Industry Revenue (Million), by End User 2024 & 2032
- Figure 45: Middle East Safety Instrumented System Industry Revenue Share (%), by End User 2024 & 2032
- Figure 46: Middle East Safety Instrumented System Industry Revenue (Million), by Country 2024 & 2032
- Figure 47: Middle East Safety Instrumented System Industry Revenue Share (%), by Country 2024 & 2032
- Figure 48: Africa Safety Instrumented System Industry Revenue (Million), by Application 2024 & 2032
- Figure 49: Africa Safety Instrumented System Industry Revenue Share (%), by Application 2024 & 2032
- Figure 50: Africa Safety Instrumented System Industry Revenue (Million), by End User 2024 & 2032
- Figure 51: Africa Safety Instrumented System Industry Revenue Share (%), by End User 2024 & 2032
- Figure 52: Africa Safety Instrumented System Industry Revenue (Million), by Country 2024 & 2032
- Figure 53: Africa Safety Instrumented System Industry Revenue Share (%), by Country 2024 & 2032
List of Tables
- Table 1: Global Safety Instrumented System Industry Revenue Million Forecast, by Region 2019 & 2032
- Table 2: Global Safety Instrumented System Industry Revenue Million Forecast, by Application 2019 & 2032
- Table 3: Global Safety Instrumented System Industry Revenue Million Forecast, by End User 2019 & 2032
- Table 4: Global Safety Instrumented System Industry Revenue Million Forecast, by Region 2019 & 2032
- Table 5: Global Safety Instrumented System Industry Revenue Million Forecast, by Country 2019 & 2032
- Table 6: Safety Instrumented System Industry Revenue (Million) Forecast, by Application 2019 & 2032
- Table 7: Global Safety Instrumented System Industry Revenue Million Forecast, by Country 2019 & 2032
- Table 8: Safety Instrumented System Industry Revenue (Million) Forecast, by Application 2019 & 2032
- Table 9: Global Safety Instrumented System Industry Revenue Million Forecast, by Country 2019 & 2032
- Table 10: Safety Instrumented System Industry Revenue (Million) Forecast, by Application 2019 & 2032
- Table 11: Global Safety Instrumented System Industry Revenue Million Forecast, by Country 2019 & 2032
- Table 12: Safety Instrumented System Industry Revenue (Million) Forecast, by Application 2019 & 2032
- Table 13: Global Safety Instrumented System Industry Revenue Million Forecast, by Country 2019 & 2032
- Table 14: Safety Instrumented System Industry Revenue (Million) Forecast, by Application 2019 & 2032
- Table 15: Global Safety Instrumented System Industry Revenue Million Forecast, by Application 2019 & 2032
- Table 16: Global Safety Instrumented System Industry Revenue Million Forecast, by End User 2019 & 2032
- Table 17: Global Safety Instrumented System Industry Revenue Million Forecast, by Country 2019 & 2032
- Table 18: Global Safety Instrumented System Industry Revenue Million Forecast, by Application 2019 & 2032
- Table 19: Global Safety Instrumented System Industry Revenue Million Forecast, by End User 2019 & 2032
- Table 20: Global Safety Instrumented System Industry Revenue Million Forecast, by Country 2019 & 2032
- Table 21: Global Safety Instrumented System Industry Revenue Million Forecast, by Application 2019 & 2032
- Table 22: Global Safety Instrumented System Industry Revenue Million Forecast, by End User 2019 & 2032
- Table 23: Global Safety Instrumented System Industry Revenue Million Forecast, by Country 2019 & 2032
- Table 24: Global Safety Instrumented System Industry Revenue Million Forecast, by Application 2019 & 2032
- Table 25: Global Safety Instrumented System Industry Revenue Million Forecast, by End User 2019 & 2032
- Table 26: Global Safety Instrumented System Industry Revenue Million Forecast, by Country 2019 & 2032
- Table 27: Global Safety Instrumented System Industry Revenue Million Forecast, by Application 2019 & 2032
- Table 28: Global Safety Instrumented System Industry Revenue Million Forecast, by End User 2019 & 2032
- Table 29: Global Safety Instrumented System Industry Revenue Million Forecast, by Country 2019 & 2032
- Table 30: Global Safety Instrumented System Industry Revenue Million Forecast, by Application 2019 & 2032
- Table 31: Global Safety Instrumented System Industry Revenue Million Forecast, by End User 2019 & 2032
- Table 32: Global Safety Instrumented System Industry Revenue Million Forecast, by Country 2019 & 2032
- Table 33: Global Safety Instrumented System Industry Revenue Million Forecast, by Application 2019 & 2032
- Table 34: Global Safety Instrumented System Industry Revenue Million Forecast, by End User 2019 & 2032
- Table 35: Global Safety Instrumented System Industry Revenue Million Forecast, by Country 2019 & 2032
Frequently Asked Questions
1. What is the projected Compound Annual Growth Rate (CAGR) of the Safety Instrumented System Industry?
The projected CAGR is approximately 6.93%.
2. Which companies are prominent players in the Safety Instrumented System Industry?
Key companies in the market include Honeywell International Inc, ABB Ltd, SIS-TECH Solutions LP, Siemens AG, Schneider Electric SE, HIMA Paul Hildebrandt GmbH, Rockwell Automation Inc, Yokogawa Electric Corporation, Schlumberger Limited*List Not Exhaustive, Emerson Electric Company.
3. What are the main segments of the Safety Instrumented System Industry?
The market segments include Application, End User.
4. Can you provide details about the market size?
The market size is estimated to be USD 4.60 Million as of 2022.
5. What are some drivers contributing to market growth?
Growing Regulatory Environment in the Industry; Presence of Robust SIS Service Ecosystem.
6. What are the notable trends driving market growth?
The Chemical and Petrochemical Industry is expected to Hold a Major Market Share.
7. Are there any restraints impacting market growth?
Operational Complexity Coupled with High Maintenance Costs.
8. Can you provide examples of recent developments in the market?
January 2021 - ProSafe-RS Lite, a safety integrity level 2 (SIL2*1) version of the ProSafeTM series safety instrumented system, was recently developed by Yokogawa Electric Corporation.
9. What pricing options are available for accessing the report?
Pricing options include single-user, multi-user, and enterprise licenses priced at USD 4750, USD 5250, and USD 8750 respectively.
10. Is the market size provided in terms of value or volume?
The market size is provided in terms of value, measured in Million.
11. Are there any specific market keywords associated with the report?
Yes, the market keyword associated with the report is "Safety Instrumented System Industry," which aids in identifying and referencing the specific market segment covered.
12. How do I determine which pricing option suits my needs best?
The pricing options vary based on user requirements and access needs. Individual users may opt for single-user licenses, while businesses requiring broader access may choose multi-user or enterprise licenses for cost-effective access to the report.
13. Are there any additional resources or data provided in the Safety Instrumented System Industry report?
While the report offers comprehensive insights, it's advisable to review the specific contents or supplementary materials provided to ascertain if additional resources or data are available.
14. How can I stay updated on further developments or reports in the Safety Instrumented System Industry?
To stay informed about further developments, trends, and reports in the Safety Instrumented System Industry, consider subscribing to industry newsletters, following relevant companies and organizations, or regularly checking reputable industry news sources and publications.
Methodology
Step 1 - Identification of Relevant Samples Size from Population Database


Step 2 - Approaches for Defining Global Market Size (Value, Volume* & Price*)

Note*: In applicable scenarios
Step 3 - Data Sources
Primary Research
- Web Analytics
- Survey Reports
- Research Institute
- Latest Research Reports
- Opinion Leaders
Secondary Research
- Annual Reports
- White Paper
- Latest Press Release
- Industry Association
- Paid Database
- Investor Presentations

Step 4 - Data Triangulation
Involves using different sources of information in order to increase the validity of a study
These sources are likely to be stakeholders in a program - participants, other researchers, program staff, other community members, and so on.
Then we put all data in single framework & apply various statistical tools to find out the dynamic on the market.
During the analysis stage, feedback from the stakeholder groups would be compared to determine areas of agreement as well as areas of divergence


