
Key Insights
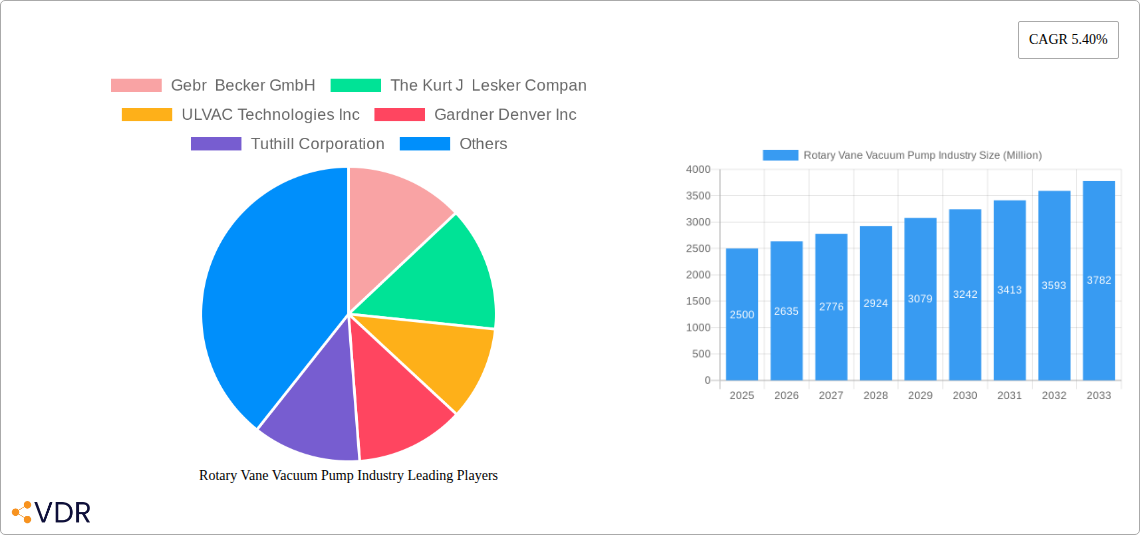
The global rotary vane vacuum pump market is experiencing steady growth, projected to reach a substantial size by 2033. A compound annual growth rate (CAGR) of 5.40% from 2025 to 2033 indicates a healthy market trajectory, driven primarily by increasing demand across diverse end-user industries. The process industry, encompassing applications like chemical processing and pharmaceutical manufacturing, remains a significant driver, along with the burgeoning semiconductor and solar energy sectors. Technological advancements focusing on energy efficiency and enhanced performance are shaping market trends, with manufacturers continually innovating to meet the demands of increasingly sophisticated applications. While rising raw material costs and potential supply chain disruptions could present restraints, the long-term outlook remains positive, fueled by the ongoing expansion of industries reliant on vacuum technology. The market is segmented geographically, with North America and Europe currently holding significant market share, while the Asia-Pacific region is anticipated to demonstrate robust growth in the coming years, driven by industrialization and increasing investment in renewable energy infrastructure. Leading players like Gebr Becker GmbH, Kurt J Lesker Company, and ULVAC Technologies Inc. are actively shaping market dynamics through product innovation and strategic partnerships.
The competitive landscape is characterized by both established players and emerging companies vying for market dominance. Competition is primarily based on technological advancements, pricing strategies, and geographic reach. Companies are increasingly focusing on developing customized solutions and providing comprehensive after-sales service to maintain a competitive edge. The market is also witnessing a growing trend towards eco-friendly and sustainable vacuum pump technologies, driven by increasing environmental regulations and concerns. Further growth will depend on several factors, including technological innovation, government policies supporting sustainable industries, and the overall economic health of key regional markets. Successful companies will be those that are adaptable, responsive to market changes, and consistently deliver high-quality, efficient, and environmentally responsible solutions to their customers.
Rotary Vane Vacuum Pump Industry: A Comprehensive Market Report (2019-2033)
This in-depth report provides a comprehensive analysis of the global rotary vane vacuum pump industry, encompassing market dynamics, growth trends, regional segmentation, product landscape, key players, and future outlook. The study period covers 2019-2033, with a base year of 2025 and a forecast period of 2025-2033. The report delivers crucial insights for industry professionals, investors, and strategic decision-makers seeking to navigate this evolving market. The total market size in 2025 is estimated at xx Million units.
Rotary Vane Vacuum Pump Industry Market Dynamics & Structure
This section analyzes the competitive landscape of the rotary vane vacuum pump market, including market concentration, technological innovation, regulatory impacts, and mergers & acquisitions (M&A) activity. The global market is moderately concentrated, with several key players holding significant market share. Technological innovation is a key driver, with ongoing efforts to improve efficiency, reduce noise, and enhance performance. Stringent environmental regulations are also influencing product development and adoption. Competitive substitutes include other vacuum pump technologies, such as scroll pumps and diaphragm pumps.
- Market Concentration: Moderately concentrated, with top 10 players holding approximately xx% market share in 2025.
- Technological Innovation: Focus on energy efficiency, noise reduction, and improved vapor handling capabilities.
- Regulatory Framework: Stringent environmental regulations drive demand for eco-friendly pumps.
- Competitive Substitutes: Scroll pumps, diaphragm pumps, and other vacuum technologies.
- End-User Demographics: Primarily industrial sectors (process, semiconductor, solar), with growing demand from instrumentation and other niche applications.
- M&A Trends: Consolidation through acquisitions is expected to continue, driving market concentration. For example, the acquisition of Pumpenfabrik Wangen GmbH by Atlas Copco in February 2022 demonstrates this trend. The total M&A deal volume from 2019-2024 is estimated at xx deals.
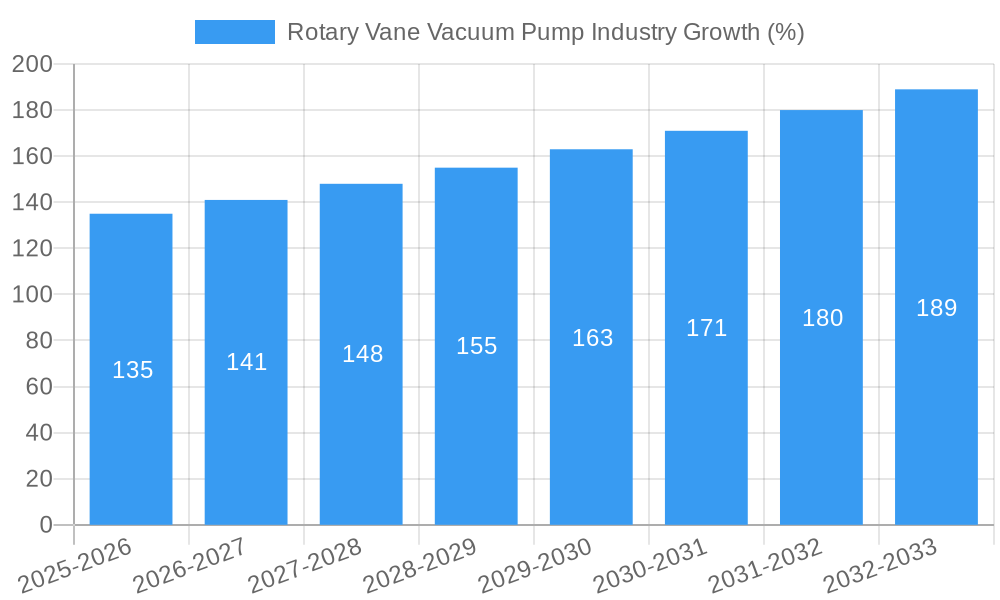
Rotary Vane Vacuum Pump Industry Growth Trends & Insights
The global rotary vane vacuum pump market has witnessed steady growth over the historical period (2019-2024), driven by increasing demand from various end-user industries. The market is expected to continue its growth trajectory during the forecast period (2025-2033), albeit at a slightly moderated pace. Technological advancements, such as the introduction of more efficient and quieter pumps, are contributing to market expansion. Consumer behavior is shifting towards more sustainable and energy-efficient solutions, influencing product preferences.
- Market Size Evolution: From xx Million units in 2019 to xx Million units in 2024, and projected to reach xx Million units by 2033.
- CAGR (2019-2024): xx%
- CAGR (2025-2033): xx%
- Market Penetration: xx% in key end-user industries in 2025.
- Technological Disruptions: Development of advanced materials and designs for improved performance and efficiency.
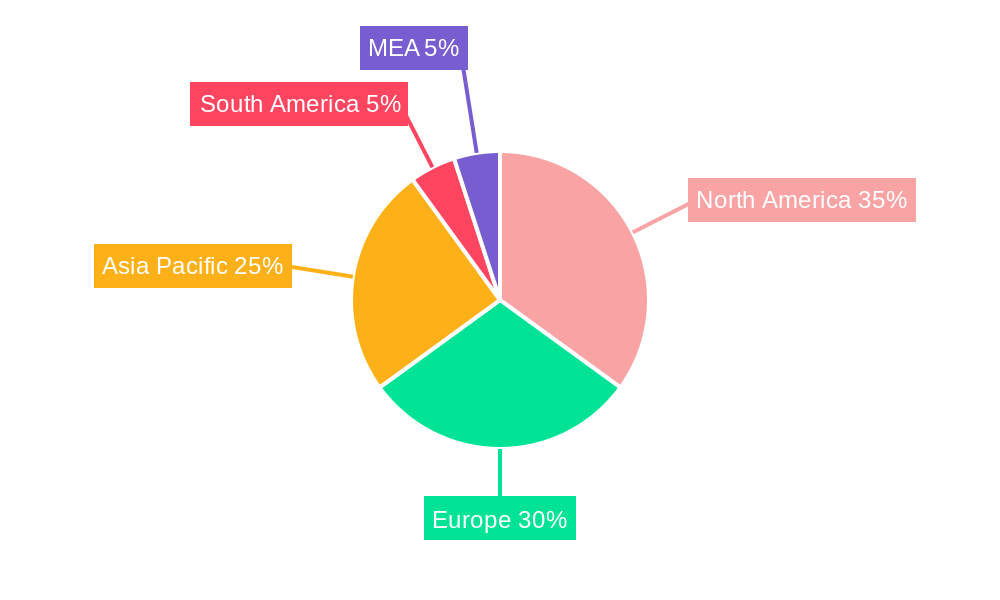
Dominant Regions, Countries, or Segments in Rotary Vane Vacuum Pump Industry
The Process Industry segment is the dominant end-user application for rotary vane vacuum pumps, followed by the Semiconductor and Solar industries. Growth in these segments is driven by the increasing demand for vacuum technologies in various industrial processes, such as chemical processing, manufacturing, and material handling. Geographically, North America and Europe currently hold significant market share, but Asia-Pacific is expected to exhibit strong growth due to expanding industrialization and investments in semiconductor and solar energy sectors.
- Key Drivers (Process Industry): Automation, increasing process complexity, and growing demand for high-vacuum applications.
- Key Drivers (Semiconductor): Expansion of semiconductor manufacturing facilities and advancements in chip technology.
- Key Drivers (Solar): Increasing adoption of solar energy and associated manufacturing processes.
- Dominant Regions: North America and Europe currently hold the largest market share. Asia-Pacific is projected to experience the fastest growth.
- Market Share (2025): Process Industry – xx%; Semiconductor – xx%; Solar – xx%; Instrumentation – xx%; Other – xx%.
Rotary Vane Vacuum Pump Industry Product Landscape
Rotary vane vacuum pumps are available in various sizes and configurations, catering to diverse application needs. Recent innovations focus on improving energy efficiency, reducing noise levels, and enhancing reliability. These pumps offer a balance of performance and cost-effectiveness, making them suitable for a wide range of applications in various industries. Key features include oil-sealed designs, two-stage pumping, and integrated controls. The unique selling proposition lies in their robust design, relatively low cost, and ability to handle both dry and wet applications. Recent advancements include incorporating advanced materials and precision manufacturing techniques.
Key Drivers, Barriers & Challenges in Rotary Vane Vacuum Pump Industry
Key Drivers:
- Increasing demand from various end-user industries, particularly the semiconductor and solar sectors.
- Technological advancements leading to improved efficiency, reliability, and reduced noise levels.
- Government initiatives and policies promoting energy efficiency and sustainable manufacturing practices.
Key Challenges and Restraints:
- Competition from alternative vacuum pump technologies.
- Fluctuations in raw material prices and supply chain disruptions.
- Stringent environmental regulations and compliance requirements.
- Increasing labor costs. These factors collectively impact production costs and market growth. Estimates suggest that supply chain issues alone could reduce growth by approximately xx% in the next 5 years.
Emerging Opportunities in Rotary Vane Vacuum Pump Industry
- Expansion into emerging markets with growing industrialization.
- Development of specialized pumps for niche applications.
- Integration of smart technologies and automation for improved performance and efficiency.
- Focus on sustainability and reducing environmental impact.
Growth Accelerators in the Rotary Vane Vacuum Pump Industry
Technological advancements, strategic partnerships, and market expansion into emerging economies are driving long-term growth in the rotary vane vacuum pump industry. The development of more energy-efficient and environmentally friendly pumps is key to sustained market expansion. Strategic collaborations among manufacturers and end-users enhance the development and adoption of advanced vacuum pump technologies.
Key Players Shaping the Rotary Vane Vacuum Pump Industry Market
- Gebr Becker GmbH
- The Kurt J Lesker Company
- ULVAC Technologies Inc
- Gardner Denver Inc
- Tuthill Corporation
- Busch Holding GmbH
- Gast Manufacturing Inc (Idex Corporation)
- Pneumofore SpA
- Atlas Copco Group
Notable Milestones in Rotary Vane Vacuum Pump Industry Sector
- August 2022: Edwards Vacuum launched the E2S series of two-stage oil-sealed rotary vane pumps, emphasizing improved performance, cost-effectiveness, and noise reduction.
- February 2022: Atlas Copco acquired Pumpenfabrik Wangen GmbH, expanding its presence in the vacuum pump market.
In-Depth Rotary Vane Vacuum Pump Industry Market Outlook
The rotary vane vacuum pump market is poised for continued growth, driven by technological advancements, increasing industrialization, and rising demand from various end-user industries. Strategic opportunities exist for manufacturers focusing on energy efficiency, sustainability, and the development of specialized pumps for niche applications. The market presents substantial potential for both established players and new entrants seeking to capitalize on emerging trends and unmet needs.
Rotary Vane Vacuum Pump Industry Segmentation
-
1. End-user Industry
- 1.1. Process Industry
- 1.2. Semiconductor
- 1.3. Solar
- 1.4. Instrumentation
- 1.5. Other End-user Industries
-
2. Product Type
- 2.1. Single-Stage Pumps
- 2.2. Two-Stage Pumps
- 2.3. Dry Rotary Vane Pumps
Rotary Vane Vacuum Pump Industry Segmentation By Geography
- 1. North America
- 2. Europe
- 3. Asia Pacific
- 4. Middle East and Africa
- 5. Latin America
Rotary Vane Vacuum Pump Industry REPORT HIGHLIGHTS
| Aspects | Details |
|---|---|
| Study Period | 2019-2033 |
| Base Year | 2024 |
| Estimated Year | 2025 |
| Forecast Period | 2025-2033 |
| Historical Period | 2019-2024 |
| Growth Rate | CAGR of 5.40% from 2019-2033 |
| Segmentation |
|
Table of Contents
- 1. Introduction
- 1.1. Research Scope
- 1.2. Market Segmentation
- 1.3. Research Methodology
- 1.4. Definitions and Assumptions
- 2. Executive Summary
- 2.1. Introduction
- 3. Market Dynamics
- 3.1. Introduction
- 3.2. Market Drivers
- 3.2.1. Growing Electronics Industry Driven by IIoT and Digitalization; Demand for Energy-Efficient Vacuum Pumps
- 3.3. Market Restrains
- 3.3.1. Consolidation of Market Participants
- 3.4. Market Trends
- 3.4.1. Semiconductor Industry is Expected to Hold Significant Share
- 4. Market Factor Analysis
- 4.1. Porters Five Forces
- 4.2. Supply/Value Chain
- 4.3. PESTEL analysis
- 4.4. Market Entropy
- 4.5. Patent/Trademark Analysis
- 5. Global Rotary Vane Vacuum Pump Industry Analysis, Insights and Forecast, 2019-2031
- 5.1. Market Analysis, Insights and Forecast - by End-user Industry
- 5.1.1. Process Industry
- 5.1.2. Semiconductor
- 5.1.3. Solar
- 5.1.4. Instrumentation
- 5.1.5. Other End-user Industries
- 5.2. Market Analysis, Insights and Forecast - by Product Type
- 5.2.1. Single-Stage Pumps
- 5.2.2. Two-Stage Pumps
- 5.2.3. Dry Rotary Vane Pumps
- 5.3. Market Analysis, Insights and Forecast - by Region
- 5.3.1. North America
- 5.3.2. Europe
- 5.3.3. Asia Pacific
- 5.3.4. Middle East and Africa
- 5.3.5. Latin America
- 5.1. Market Analysis, Insights and Forecast - by End-user Industry
- 6. North America Rotary Vane Vacuum Pump Industry Analysis, Insights and Forecast, 2019-2031
- 6.1. Market Analysis, Insights and Forecast - by End-user Industry
- 6.1.1. Process Industry
- 6.1.2. Semiconductor
- 6.1.3. Solar
- 6.1.4. Instrumentation
- 6.1.5. Other End-user Industries
- 6.2. Market Analysis, Insights and Forecast - by Product Type
- 6.2.1. Single-Stage Pumps
- 6.2.2. Two-Stage Pumps
- 6.2.3. Dry Rotary Vane Pumps
- 6.1. Market Analysis, Insights and Forecast - by End-user Industry
- 7. Europe Rotary Vane Vacuum Pump Industry Analysis, Insights and Forecast, 2019-2031
- 7.1. Market Analysis, Insights and Forecast - by End-user Industry
- 7.1.1. Process Industry
- 7.1.2. Semiconductor
- 7.1.3. Solar
- 7.1.4. Instrumentation
- 7.1.5. Other End-user Industries
- 7.2. Market Analysis, Insights and Forecast - by Product Type
- 7.2.1. Single-Stage Pumps
- 7.2.2. Two-Stage Pumps
- 7.2.3. Dry Rotary Vane Pumps
- 7.1. Market Analysis, Insights and Forecast - by End-user Industry
- 8. Asia Pacific Rotary Vane Vacuum Pump Industry Analysis, Insights and Forecast, 2019-2031
- 8.1. Market Analysis, Insights and Forecast - by End-user Industry
- 8.1.1. Process Industry
- 8.1.2. Semiconductor
- 8.1.3. Solar
- 8.1.4. Instrumentation
- 8.1.5. Other End-user Industries
- 8.2. Market Analysis, Insights and Forecast - by Product Type
- 8.2.1. Single-Stage Pumps
- 8.2.2. Two-Stage Pumps
- 8.2.3. Dry Rotary Vane Pumps
- 8.1. Market Analysis, Insights and Forecast - by End-user Industry
- 9. Middle East and Africa Rotary Vane Vacuum Pump Industry Analysis, Insights and Forecast, 2019-2031
- 9.1. Market Analysis, Insights and Forecast - by End-user Industry
- 9.1.1. Process Industry
- 9.1.2. Semiconductor
- 9.1.3. Solar
- 9.1.4. Instrumentation
- 9.1.5. Other End-user Industries
- 9.2. Market Analysis, Insights and Forecast - by Product Type
- 9.2.1. Single-Stage Pumps
- 9.2.2. Two-Stage Pumps
- 9.2.3. Dry Rotary Vane Pumps
- 9.1. Market Analysis, Insights and Forecast - by End-user Industry
- 10. Latin America Rotary Vane Vacuum Pump Industry Analysis, Insights and Forecast, 2019-2031
- 10.1. Market Analysis, Insights and Forecast - by End-user Industry
- 10.1.1. Process Industry
- 10.1.2. Semiconductor
- 10.1.3. Solar
- 10.1.4. Instrumentation
- 10.1.5. Other End-user Industries
- 10.2. Market Analysis, Insights and Forecast - by Product Type
- 10.2.1. Single-Stage Pumps
- 10.2.2. Two-Stage Pumps
- 10.2.3. Dry Rotary Vane Pumps
- 10.1. Market Analysis, Insights and Forecast - by End-user Industry
- 11. North America Rotary Vane Vacuum Pump Industry Analysis, Insights and Forecast, 2019-2031
- 11.1. Market Analysis, Insights and Forecast - By Country/Sub-region
- 11.1.1 United States
- 11.1.2 Canada
- 11.1.3 Mexico
- 12. Europe Rotary Vane Vacuum Pump Industry Analysis, Insights and Forecast, 2019-2031
- 12.1. Market Analysis, Insights and Forecast - By Country/Sub-region
- 12.1.1 Germany
- 12.1.2 United Kingdom
- 12.1.3 France
- 12.1.4 Spain
- 12.1.5 Italy
- 12.1.6 Spain
- 12.1.7 Belgium
- 12.1.8 Netherland
- 12.1.9 Nordics
- 12.1.10 Rest of Europe
- 13. Asia Pacific Rotary Vane Vacuum Pump Industry Analysis, Insights and Forecast, 2019-2031
- 13.1. Market Analysis, Insights and Forecast - By Country/Sub-region
- 13.1.1 China
- 13.1.2 Japan
- 13.1.3 India
- 13.1.4 South Korea
- 13.1.5 Southeast Asia
- 13.1.6 Australia
- 13.1.7 Indonesia
- 13.1.8 Phillipes
- 13.1.9 Singapore
- 13.1.10 Thailandc
- 13.1.11 Rest of Asia Pacific
- 14. South America Rotary Vane Vacuum Pump Industry Analysis, Insights and Forecast, 2019-2031
- 14.1. Market Analysis, Insights and Forecast - By Country/Sub-region
- 14.1.1 Brazil
- 14.1.2 Argentina
- 14.1.3 Peru
- 14.1.4 Chile
- 14.1.5 Colombia
- 14.1.6 Ecuador
- 14.1.7 Venezuela
- 14.1.8 Rest of South America
- 15. North America Rotary Vane Vacuum Pump Industry Analysis, Insights and Forecast, 2019-2031
- 15.1. Market Analysis, Insights and Forecast - By Country/Sub-region
- 15.1.1 United States
- 15.1.2 Canada
- 15.1.3 Mexico
- 16. MEA Rotary Vane Vacuum Pump Industry Analysis, Insights and Forecast, 2019-2031
- 16.1. Market Analysis, Insights and Forecast - By Country/Sub-region
- 16.1.1 United Arab Emirates
- 16.1.2 Saudi Arabia
- 16.1.3 South Africa
- 16.1.4 Rest of Middle East and Africa
- 17. Competitive Analysis
- 17.1. Global Market Share Analysis 2024
- 17.2. Company Profiles
- 17.2.1 Gebr Becker GmbH
- 17.2.1.1. Overview
- 17.2.1.2. Products
- 17.2.1.3. SWOT Analysis
- 17.2.1.4. Recent Developments
- 17.2.1.5. Financials (Based on Availability)
- 17.2.2 The Kurt J Lesker Compan
- 17.2.2.1. Overview
- 17.2.2.2. Products
- 17.2.2.3. SWOT Analysis
- 17.2.2.4. Recent Developments
- 17.2.2.5. Financials (Based on Availability)
- 17.2.3 ULVAC Technologies Inc
- 17.2.3.1. Overview
- 17.2.3.2. Products
- 17.2.3.3. SWOT Analysis
- 17.2.3.4. Recent Developments
- 17.2.3.5. Financials (Based on Availability)
- 17.2.4 Gardner Denver Inc
- 17.2.4.1. Overview
- 17.2.4.2. Products
- 17.2.4.3. SWOT Analysis
- 17.2.4.4. Recent Developments
- 17.2.4.5. Financials (Based on Availability)
- 17.2.5 Tuthill Corporation
- 17.2.5.1. Overview
- 17.2.5.2. Products
- 17.2.5.3. SWOT Analysis
- 17.2.5.4. Recent Developments
- 17.2.5.5. Financials (Based on Availability)
- 17.2.6 Busch Holding GmbH
- 17.2.6.1. Overview
- 17.2.6.2. Products
- 17.2.6.3. SWOT Analysis
- 17.2.6.4. Recent Developments
- 17.2.6.5. Financials (Based on Availability)
- 17.2.7 Gast Manufacturing Inc (Idex Corporation)
- 17.2.7.1. Overview
- 17.2.7.2. Products
- 17.2.7.3. SWOT Analysis
- 17.2.7.4. Recent Developments
- 17.2.7.5. Financials (Based on Availability)
- 17.2.8 Pneumofore SpA
- 17.2.8.1. Overview
- 17.2.8.2. Products
- 17.2.8.3. SWOT Analysis
- 17.2.8.4. Recent Developments
- 17.2.8.5. Financials (Based on Availability)
- 17.2.9 Atlas Copco Group
- 17.2.9.1. Overview
- 17.2.9.2. Products
- 17.2.9.3. SWOT Analysis
- 17.2.9.4. Recent Developments
- 17.2.9.5. Financials (Based on Availability)
- 17.2.1 Gebr Becker GmbH
List of Figures
- Figure 1: Global Rotary Vane Vacuum Pump Industry Revenue Breakdown (Million, %) by Region 2024 & 2032
- Figure 2: Global Rotary Vane Vacuum Pump Industry Volume Breakdown (K Unit, %) by Region 2024 & 2032
- Figure 3: North America Rotary Vane Vacuum Pump Industry Revenue (Million), by Country 2024 & 2032
- Figure 4: North America Rotary Vane Vacuum Pump Industry Volume (K Unit), by Country 2024 & 2032
- Figure 5: North America Rotary Vane Vacuum Pump Industry Revenue Share (%), by Country 2024 & 2032
- Figure 6: North America Rotary Vane Vacuum Pump Industry Volume Share (%), by Country 2024 & 2032
- Figure 7: Europe Rotary Vane Vacuum Pump Industry Revenue (Million), by Country 2024 & 2032
- Figure 8: Europe Rotary Vane Vacuum Pump Industry Volume (K Unit), by Country 2024 & 2032
- Figure 9: Europe Rotary Vane Vacuum Pump Industry Revenue Share (%), by Country 2024 & 2032
- Figure 10: Europe Rotary Vane Vacuum Pump Industry Volume Share (%), by Country 2024 & 2032
- Figure 11: Asia Pacific Rotary Vane Vacuum Pump Industry Revenue (Million), by Country 2024 & 2032
- Figure 12: Asia Pacific Rotary Vane Vacuum Pump Industry Volume (K Unit), by Country 2024 & 2032
- Figure 13: Asia Pacific Rotary Vane Vacuum Pump Industry Revenue Share (%), by Country 2024 & 2032
- Figure 14: Asia Pacific Rotary Vane Vacuum Pump Industry Volume Share (%), by Country 2024 & 2032
- Figure 15: South America Rotary Vane Vacuum Pump Industry Revenue (Million), by Country 2024 & 2032
- Figure 16: South America Rotary Vane Vacuum Pump Industry Volume (K Unit), by Country 2024 & 2032
- Figure 17: South America Rotary Vane Vacuum Pump Industry Revenue Share (%), by Country 2024 & 2032
- Figure 18: South America Rotary Vane Vacuum Pump Industry Volume Share (%), by Country 2024 & 2032
- Figure 19: North America Rotary Vane Vacuum Pump Industry Revenue (Million), by Country 2024 & 2032
- Figure 20: North America Rotary Vane Vacuum Pump Industry Volume (K Unit), by Country 2024 & 2032
- Figure 21: North America Rotary Vane Vacuum Pump Industry Revenue Share (%), by Country 2024 & 2032
- Figure 22: North America Rotary Vane Vacuum Pump Industry Volume Share (%), by Country 2024 & 2032
- Figure 23: MEA Rotary Vane Vacuum Pump Industry Revenue (Million), by Country 2024 & 2032
- Figure 24: MEA Rotary Vane Vacuum Pump Industry Volume (K Unit), by Country 2024 & 2032
- Figure 25: MEA Rotary Vane Vacuum Pump Industry Revenue Share (%), by Country 2024 & 2032
- Figure 26: MEA Rotary Vane Vacuum Pump Industry Volume Share (%), by Country 2024 & 2032
- Figure 27: North America Rotary Vane Vacuum Pump Industry Revenue (Million), by End-user Industry 2024 & 2032
- Figure 28: North America Rotary Vane Vacuum Pump Industry Volume (K Unit), by End-user Industry 2024 & 2032
- Figure 29: North America Rotary Vane Vacuum Pump Industry Revenue Share (%), by End-user Industry 2024 & 2032
- Figure 30: North America Rotary Vane Vacuum Pump Industry Volume Share (%), by End-user Industry 2024 & 2032
- Figure 31: North America Rotary Vane Vacuum Pump Industry Revenue (Million), by Product Type 2024 & 2032
- Figure 32: North America Rotary Vane Vacuum Pump Industry Volume (K Unit), by Product Type 2024 & 2032
- Figure 33: North America Rotary Vane Vacuum Pump Industry Revenue Share (%), by Product Type 2024 & 2032
- Figure 34: North America Rotary Vane Vacuum Pump Industry Volume Share (%), by Product Type 2024 & 2032
- Figure 35: North America Rotary Vane Vacuum Pump Industry Revenue (Million), by Country 2024 & 2032
- Figure 36: North America Rotary Vane Vacuum Pump Industry Volume (K Unit), by Country 2024 & 2032
- Figure 37: North America Rotary Vane Vacuum Pump Industry Revenue Share (%), by Country 2024 & 2032
- Figure 38: North America Rotary Vane Vacuum Pump Industry Volume Share (%), by Country 2024 & 2032
- Figure 39: Europe Rotary Vane Vacuum Pump Industry Revenue (Million), by End-user Industry 2024 & 2032
- Figure 40: Europe Rotary Vane Vacuum Pump Industry Volume (K Unit), by End-user Industry 2024 & 2032
- Figure 41: Europe Rotary Vane Vacuum Pump Industry Revenue Share (%), by End-user Industry 2024 & 2032
- Figure 42: Europe Rotary Vane Vacuum Pump Industry Volume Share (%), by End-user Industry 2024 & 2032
- Figure 43: Europe Rotary Vane Vacuum Pump Industry Revenue (Million), by Product Type 2024 & 2032
- Figure 44: Europe Rotary Vane Vacuum Pump Industry Volume (K Unit), by Product Type 2024 & 2032
- Figure 45: Europe Rotary Vane Vacuum Pump Industry Revenue Share (%), by Product Type 2024 & 2032
- Figure 46: Europe Rotary Vane Vacuum Pump Industry Volume Share (%), by Product Type 2024 & 2032
- Figure 47: Europe Rotary Vane Vacuum Pump Industry Revenue (Million), by Country 2024 & 2032
- Figure 48: Europe Rotary Vane Vacuum Pump Industry Volume (K Unit), by Country 2024 & 2032
- Figure 49: Europe Rotary Vane Vacuum Pump Industry Revenue Share (%), by Country 2024 & 2032
- Figure 50: Europe Rotary Vane Vacuum Pump Industry Volume Share (%), by Country 2024 & 2032
- Figure 51: Asia Pacific Rotary Vane Vacuum Pump Industry Revenue (Million), by End-user Industry 2024 & 2032
- Figure 52: Asia Pacific Rotary Vane Vacuum Pump Industry Volume (K Unit), by End-user Industry 2024 & 2032
- Figure 53: Asia Pacific Rotary Vane Vacuum Pump Industry Revenue Share (%), by End-user Industry 2024 & 2032
- Figure 54: Asia Pacific Rotary Vane Vacuum Pump Industry Volume Share (%), by End-user Industry 2024 & 2032
- Figure 55: Asia Pacific Rotary Vane Vacuum Pump Industry Revenue (Million), by Product Type 2024 & 2032
- Figure 56: Asia Pacific Rotary Vane Vacuum Pump Industry Volume (K Unit), by Product Type 2024 & 2032
- Figure 57: Asia Pacific Rotary Vane Vacuum Pump Industry Revenue Share (%), by Product Type 2024 & 2032
- Figure 58: Asia Pacific Rotary Vane Vacuum Pump Industry Volume Share (%), by Product Type 2024 & 2032
- Figure 59: Asia Pacific Rotary Vane Vacuum Pump Industry Revenue (Million), by Country 2024 & 2032
- Figure 60: Asia Pacific Rotary Vane Vacuum Pump Industry Volume (K Unit), by Country 2024 & 2032
- Figure 61: Asia Pacific Rotary Vane Vacuum Pump Industry Revenue Share (%), by Country 2024 & 2032
- Figure 62: Asia Pacific Rotary Vane Vacuum Pump Industry Volume Share (%), by Country 2024 & 2032
- Figure 63: Middle East and Africa Rotary Vane Vacuum Pump Industry Revenue (Million), by End-user Industry 2024 & 2032
- Figure 64: Middle East and Africa Rotary Vane Vacuum Pump Industry Volume (K Unit), by End-user Industry 2024 & 2032
- Figure 65: Middle East and Africa Rotary Vane Vacuum Pump Industry Revenue Share (%), by End-user Industry 2024 & 2032
- Figure 66: Middle East and Africa Rotary Vane Vacuum Pump Industry Volume Share (%), by End-user Industry 2024 & 2032
- Figure 67: Middle East and Africa Rotary Vane Vacuum Pump Industry Revenue (Million), by Product Type 2024 & 2032
- Figure 68: Middle East and Africa Rotary Vane Vacuum Pump Industry Volume (K Unit), by Product Type 2024 & 2032
- Figure 69: Middle East and Africa Rotary Vane Vacuum Pump Industry Revenue Share (%), by Product Type 2024 & 2032
- Figure 70: Middle East and Africa Rotary Vane Vacuum Pump Industry Volume Share (%), by Product Type 2024 & 2032
- Figure 71: Middle East and Africa Rotary Vane Vacuum Pump Industry Revenue (Million), by Country 2024 & 2032
- Figure 72: Middle East and Africa Rotary Vane Vacuum Pump Industry Volume (K Unit), by Country 2024 & 2032
- Figure 73: Middle East and Africa Rotary Vane Vacuum Pump Industry Revenue Share (%), by Country 2024 & 2032
- Figure 74: Middle East and Africa Rotary Vane Vacuum Pump Industry Volume Share (%), by Country 2024 & 2032
- Figure 75: Latin America Rotary Vane Vacuum Pump Industry Revenue (Million), by End-user Industry 2024 & 2032
- Figure 76: Latin America Rotary Vane Vacuum Pump Industry Volume (K Unit), by End-user Industry 2024 & 2032
- Figure 77: Latin America Rotary Vane Vacuum Pump Industry Revenue Share (%), by End-user Industry 2024 & 2032
- Figure 78: Latin America Rotary Vane Vacuum Pump Industry Volume Share (%), by End-user Industry 2024 & 2032
- Figure 79: Latin America Rotary Vane Vacuum Pump Industry Revenue (Million), by Product Type 2024 & 2032
- Figure 80: Latin America Rotary Vane Vacuum Pump Industry Volume (K Unit), by Product Type 2024 & 2032
- Figure 81: Latin America Rotary Vane Vacuum Pump Industry Revenue Share (%), by Product Type 2024 & 2032
- Figure 82: Latin America Rotary Vane Vacuum Pump Industry Volume Share (%), by Product Type 2024 & 2032
- Figure 83: Latin America Rotary Vane Vacuum Pump Industry Revenue (Million), by Country 2024 & 2032
- Figure 84: Latin America Rotary Vane Vacuum Pump Industry Volume (K Unit), by Country 2024 & 2032
- Figure 85: Latin America Rotary Vane Vacuum Pump Industry Revenue Share (%), by Country 2024 & 2032
- Figure 86: Latin America Rotary Vane Vacuum Pump Industry Volume Share (%), by Country 2024 & 2032
List of Tables
- Table 1: Global Rotary Vane Vacuum Pump Industry Revenue Million Forecast, by Region 2019 & 2032
- Table 2: Global Rotary Vane Vacuum Pump Industry Volume K Unit Forecast, by Region 2019 & 2032
- Table 3: Global Rotary Vane Vacuum Pump Industry Revenue Million Forecast, by End-user Industry 2019 & 2032
- Table 4: Global Rotary Vane Vacuum Pump Industry Volume K Unit Forecast, by End-user Industry 2019 & 2032
- Table 5: Global Rotary Vane Vacuum Pump Industry Revenue Million Forecast, by Product Type 2019 & 2032
- Table 6: Global Rotary Vane Vacuum Pump Industry Volume K Unit Forecast, by Product Type 2019 & 2032
- Table 7: Global Rotary Vane Vacuum Pump Industry Revenue Million Forecast, by Region 2019 & 2032
- Table 8: Global Rotary Vane Vacuum Pump Industry Volume K Unit Forecast, by Region 2019 & 2032
- Table 9: Global Rotary Vane Vacuum Pump Industry Revenue Million Forecast, by Country 2019 & 2032
- Table 10: Global Rotary Vane Vacuum Pump Industry Volume K Unit Forecast, by Country 2019 & 2032
- Table 11: United States Rotary Vane Vacuum Pump Industry Revenue (Million) Forecast, by Application 2019 & 2032
- Table 12: United States Rotary Vane Vacuum Pump Industry Volume (K Unit) Forecast, by Application 2019 & 2032
- Table 13: Canada Rotary Vane Vacuum Pump Industry Revenue (Million) Forecast, by Application 2019 & 2032
- Table 14: Canada Rotary Vane Vacuum Pump Industry Volume (K Unit) Forecast, by Application 2019 & 2032
- Table 15: Mexico Rotary Vane Vacuum Pump Industry Revenue (Million) Forecast, by Application 2019 & 2032
- Table 16: Mexico Rotary Vane Vacuum Pump Industry Volume (K Unit) Forecast, by Application 2019 & 2032
- Table 17: Global Rotary Vane Vacuum Pump Industry Revenue Million Forecast, by Country 2019 & 2032
- Table 18: Global Rotary Vane Vacuum Pump Industry Volume K Unit Forecast, by Country 2019 & 2032
- Table 19: Germany Rotary Vane Vacuum Pump Industry Revenue (Million) Forecast, by Application 2019 & 2032
- Table 20: Germany Rotary Vane Vacuum Pump Industry Volume (K Unit) Forecast, by Application 2019 & 2032
- Table 21: United Kingdom Rotary Vane Vacuum Pump Industry Revenue (Million) Forecast, by Application 2019 & 2032
- Table 22: United Kingdom Rotary Vane Vacuum Pump Industry Volume (K Unit) Forecast, by Application 2019 & 2032
- Table 23: France Rotary Vane Vacuum Pump Industry Revenue (Million) Forecast, by Application 2019 & 2032
- Table 24: France Rotary Vane Vacuum Pump Industry Volume (K Unit) Forecast, by Application 2019 & 2032
- Table 25: Spain Rotary Vane Vacuum Pump Industry Revenue (Million) Forecast, by Application 2019 & 2032
- Table 26: Spain Rotary Vane Vacuum Pump Industry Volume (K Unit) Forecast, by Application 2019 & 2032
- Table 27: Italy Rotary Vane Vacuum Pump Industry Revenue (Million) Forecast, by Application 2019 & 2032
- Table 28: Italy Rotary Vane Vacuum Pump Industry Volume (K Unit) Forecast, by Application 2019 & 2032
- Table 29: Spain Rotary Vane Vacuum Pump Industry Revenue (Million) Forecast, by Application 2019 & 2032
- Table 30: Spain Rotary Vane Vacuum Pump Industry Volume (K Unit) Forecast, by Application 2019 & 2032
- Table 31: Belgium Rotary Vane Vacuum Pump Industry Revenue (Million) Forecast, by Application 2019 & 2032
- Table 32: Belgium Rotary Vane Vacuum Pump Industry Volume (K Unit) Forecast, by Application 2019 & 2032
- Table 33: Netherland Rotary Vane Vacuum Pump Industry Revenue (Million) Forecast, by Application 2019 & 2032
- Table 34: Netherland Rotary Vane Vacuum Pump Industry Volume (K Unit) Forecast, by Application 2019 & 2032
- Table 35: Nordics Rotary Vane Vacuum Pump Industry Revenue (Million) Forecast, by Application 2019 & 2032
- Table 36: Nordics Rotary Vane Vacuum Pump Industry Volume (K Unit) Forecast, by Application 2019 & 2032
- Table 37: Rest of Europe Rotary Vane Vacuum Pump Industry Revenue (Million) Forecast, by Application 2019 & 2032
- Table 38: Rest of Europe Rotary Vane Vacuum Pump Industry Volume (K Unit) Forecast, by Application 2019 & 2032
- Table 39: Global Rotary Vane Vacuum Pump Industry Revenue Million Forecast, by Country 2019 & 2032
- Table 40: Global Rotary Vane Vacuum Pump Industry Volume K Unit Forecast, by Country 2019 & 2032
- Table 41: China Rotary Vane Vacuum Pump Industry Revenue (Million) Forecast, by Application 2019 & 2032
- Table 42: China Rotary Vane Vacuum Pump Industry Volume (K Unit) Forecast, by Application 2019 & 2032
- Table 43: Japan Rotary Vane Vacuum Pump Industry Revenue (Million) Forecast, by Application 2019 & 2032
- Table 44: Japan Rotary Vane Vacuum Pump Industry Volume (K Unit) Forecast, by Application 2019 & 2032
- Table 45: India Rotary Vane Vacuum Pump Industry Revenue (Million) Forecast, by Application 2019 & 2032
- Table 46: India Rotary Vane Vacuum Pump Industry Volume (K Unit) Forecast, by Application 2019 & 2032
- Table 47: South Korea Rotary Vane Vacuum Pump Industry Revenue (Million) Forecast, by Application 2019 & 2032
- Table 48: South Korea Rotary Vane Vacuum Pump Industry Volume (K Unit) Forecast, by Application 2019 & 2032
- Table 49: Southeast Asia Rotary Vane Vacuum Pump Industry Revenue (Million) Forecast, by Application 2019 & 2032
- Table 50: Southeast Asia Rotary Vane Vacuum Pump Industry Volume (K Unit) Forecast, by Application 2019 & 2032
- Table 51: Australia Rotary Vane Vacuum Pump Industry Revenue (Million) Forecast, by Application 2019 & 2032
- Table 52: Australia Rotary Vane Vacuum Pump Industry Volume (K Unit) Forecast, by Application 2019 & 2032
- Table 53: Indonesia Rotary Vane Vacuum Pump Industry Revenue (Million) Forecast, by Application 2019 & 2032
- Table 54: Indonesia Rotary Vane Vacuum Pump Industry Volume (K Unit) Forecast, by Application 2019 & 2032
- Table 55: Phillipes Rotary Vane Vacuum Pump Industry Revenue (Million) Forecast, by Application 2019 & 2032
- Table 56: Phillipes Rotary Vane Vacuum Pump Industry Volume (K Unit) Forecast, by Application 2019 & 2032
- Table 57: Singapore Rotary Vane Vacuum Pump Industry Revenue (Million) Forecast, by Application 2019 & 2032
- Table 58: Singapore Rotary Vane Vacuum Pump Industry Volume (K Unit) Forecast, by Application 2019 & 2032
- Table 59: Thailandc Rotary Vane Vacuum Pump Industry Revenue (Million) Forecast, by Application 2019 & 2032
- Table 60: Thailandc Rotary Vane Vacuum Pump Industry Volume (K Unit) Forecast, by Application 2019 & 2032
- Table 61: Rest of Asia Pacific Rotary Vane Vacuum Pump Industry Revenue (Million) Forecast, by Application 2019 & 2032
- Table 62: Rest of Asia Pacific Rotary Vane Vacuum Pump Industry Volume (K Unit) Forecast, by Application 2019 & 2032
- Table 63: Global Rotary Vane Vacuum Pump Industry Revenue Million Forecast, by Country 2019 & 2032
- Table 64: Global Rotary Vane Vacuum Pump Industry Volume K Unit Forecast, by Country 2019 & 2032
- Table 65: Brazil Rotary Vane Vacuum Pump Industry Revenue (Million) Forecast, by Application 2019 & 2032
- Table 66: Brazil Rotary Vane Vacuum Pump Industry Volume (K Unit) Forecast, by Application 2019 & 2032
- Table 67: Argentina Rotary Vane Vacuum Pump Industry Revenue (Million) Forecast, by Application 2019 & 2032
- Table 68: Argentina Rotary Vane Vacuum Pump Industry Volume (K Unit) Forecast, by Application 2019 & 2032
- Table 69: Peru Rotary Vane Vacuum Pump Industry Revenue (Million) Forecast, by Application 2019 & 2032
- Table 70: Peru Rotary Vane Vacuum Pump Industry Volume (K Unit) Forecast, by Application 2019 & 2032
- Table 71: Chile Rotary Vane Vacuum Pump Industry Revenue (Million) Forecast, by Application 2019 & 2032
- Table 72: Chile Rotary Vane Vacuum Pump Industry Volume (K Unit) Forecast, by Application 2019 & 2032
- Table 73: Colombia Rotary Vane Vacuum Pump Industry Revenue (Million) Forecast, by Application 2019 & 2032
- Table 74: Colombia Rotary Vane Vacuum Pump Industry Volume (K Unit) Forecast, by Application 2019 & 2032
- Table 75: Ecuador Rotary Vane Vacuum Pump Industry Revenue (Million) Forecast, by Application 2019 & 2032
- Table 76: Ecuador Rotary Vane Vacuum Pump Industry Volume (K Unit) Forecast, by Application 2019 & 2032
- Table 77: Venezuela Rotary Vane Vacuum Pump Industry Revenue (Million) Forecast, by Application 2019 & 2032
- Table 78: Venezuela Rotary Vane Vacuum Pump Industry Volume (K Unit) Forecast, by Application 2019 & 2032
- Table 79: Rest of South America Rotary Vane Vacuum Pump Industry Revenue (Million) Forecast, by Application 2019 & 2032
- Table 80: Rest of South America Rotary Vane Vacuum Pump Industry Volume (K Unit) Forecast, by Application 2019 & 2032
- Table 81: Global Rotary Vane Vacuum Pump Industry Revenue Million Forecast, by Country 2019 & 2032
- Table 82: Global Rotary Vane Vacuum Pump Industry Volume K Unit Forecast, by Country 2019 & 2032
- Table 83: United States Rotary Vane Vacuum Pump Industry Revenue (Million) Forecast, by Application 2019 & 2032
- Table 84: United States Rotary Vane Vacuum Pump Industry Volume (K Unit) Forecast, by Application 2019 & 2032
- Table 85: Canada Rotary Vane Vacuum Pump Industry Revenue (Million) Forecast, by Application 2019 & 2032
- Table 86: Canada Rotary Vane Vacuum Pump Industry Volume (K Unit) Forecast, by Application 2019 & 2032
- Table 87: Mexico Rotary Vane Vacuum Pump Industry Revenue (Million) Forecast, by Application 2019 & 2032
- Table 88: Mexico Rotary Vane Vacuum Pump Industry Volume (K Unit) Forecast, by Application 2019 & 2032
- Table 89: Global Rotary Vane Vacuum Pump Industry Revenue Million Forecast, by Country 2019 & 2032
- Table 90: Global Rotary Vane Vacuum Pump Industry Volume K Unit Forecast, by Country 2019 & 2032
- Table 91: United Arab Emirates Rotary Vane Vacuum Pump Industry Revenue (Million) Forecast, by Application 2019 & 2032
- Table 92: United Arab Emirates Rotary Vane Vacuum Pump Industry Volume (K Unit) Forecast, by Application 2019 & 2032
- Table 93: Saudi Arabia Rotary Vane Vacuum Pump Industry Revenue (Million) Forecast, by Application 2019 & 2032
- Table 94: Saudi Arabia Rotary Vane Vacuum Pump Industry Volume (K Unit) Forecast, by Application 2019 & 2032
- Table 95: South Africa Rotary Vane Vacuum Pump Industry Revenue (Million) Forecast, by Application 2019 & 2032
- Table 96: South Africa Rotary Vane Vacuum Pump Industry Volume (K Unit) Forecast, by Application 2019 & 2032
- Table 97: Rest of Middle East and Africa Rotary Vane Vacuum Pump Industry Revenue (Million) Forecast, by Application 2019 & 2032
- Table 98: Rest of Middle East and Africa Rotary Vane Vacuum Pump Industry Volume (K Unit) Forecast, by Application 2019 & 2032
- Table 99: Global Rotary Vane Vacuum Pump Industry Revenue Million Forecast, by End-user Industry 2019 & 2032
- Table 100: Global Rotary Vane Vacuum Pump Industry Volume K Unit Forecast, by End-user Industry 2019 & 2032
- Table 101: Global Rotary Vane Vacuum Pump Industry Revenue Million Forecast, by Product Type 2019 & 2032
- Table 102: Global Rotary Vane Vacuum Pump Industry Volume K Unit Forecast, by Product Type 2019 & 2032
- Table 103: Global Rotary Vane Vacuum Pump Industry Revenue Million Forecast, by Country 2019 & 2032
- Table 104: Global Rotary Vane Vacuum Pump Industry Volume K Unit Forecast, by Country 2019 & 2032
- Table 105: Global Rotary Vane Vacuum Pump Industry Revenue Million Forecast, by End-user Industry 2019 & 2032
- Table 106: Global Rotary Vane Vacuum Pump Industry Volume K Unit Forecast, by End-user Industry 2019 & 2032
- Table 107: Global Rotary Vane Vacuum Pump Industry Revenue Million Forecast, by Product Type 2019 & 2032
- Table 108: Global Rotary Vane Vacuum Pump Industry Volume K Unit Forecast, by Product Type 2019 & 2032
- Table 109: Global Rotary Vane Vacuum Pump Industry Revenue Million Forecast, by Country 2019 & 2032
- Table 110: Global Rotary Vane Vacuum Pump Industry Volume K Unit Forecast, by Country 2019 & 2032
- Table 111: Global Rotary Vane Vacuum Pump Industry Revenue Million Forecast, by End-user Industry 2019 & 2032
- Table 112: Global Rotary Vane Vacuum Pump Industry Volume K Unit Forecast, by End-user Industry 2019 & 2032
- Table 113: Global Rotary Vane Vacuum Pump Industry Revenue Million Forecast, by Product Type 2019 & 2032
- Table 114: Global Rotary Vane Vacuum Pump Industry Volume K Unit Forecast, by Product Type 2019 & 2032
- Table 115: Global Rotary Vane Vacuum Pump Industry Revenue Million Forecast, by Country 2019 & 2032
- Table 116: Global Rotary Vane Vacuum Pump Industry Volume K Unit Forecast, by Country 2019 & 2032
- Table 117: Global Rotary Vane Vacuum Pump Industry Revenue Million Forecast, by End-user Industry 2019 & 2032
- Table 118: Global Rotary Vane Vacuum Pump Industry Volume K Unit Forecast, by End-user Industry 2019 & 2032
- Table 119: Global Rotary Vane Vacuum Pump Industry Revenue Million Forecast, by Product Type 2019 & 2032
- Table 120: Global Rotary Vane Vacuum Pump Industry Volume K Unit Forecast, by Product Type 2019 & 2032
- Table 121: Global Rotary Vane Vacuum Pump Industry Revenue Million Forecast, by Country 2019 & 2032
- Table 122: Global Rotary Vane Vacuum Pump Industry Volume K Unit Forecast, by Country 2019 & 2032
- Table 123: Global Rotary Vane Vacuum Pump Industry Revenue Million Forecast, by End-user Industry 2019 & 2032
- Table 124: Global Rotary Vane Vacuum Pump Industry Volume K Unit Forecast, by End-user Industry 2019 & 2032
- Table 125: Global Rotary Vane Vacuum Pump Industry Revenue Million Forecast, by Product Type 2019 & 2032
- Table 126: Global Rotary Vane Vacuum Pump Industry Volume K Unit Forecast, by Product Type 2019 & 2032
- Table 127: Global Rotary Vane Vacuum Pump Industry Revenue Million Forecast, by Country 2019 & 2032
- Table 128: Global Rotary Vane Vacuum Pump Industry Volume K Unit Forecast, by Country 2019 & 2032
Frequently Asked Questions
1. What is the projected Compound Annual Growth Rate (CAGR) of the Rotary Vane Vacuum Pump Industry?
The projected CAGR is approximately 5.40%.
2. Which companies are prominent players in the Rotary Vane Vacuum Pump Industry?
Key companies in the market include Gebr Becker GmbH, The Kurt J Lesker Compan, ULVAC Technologies Inc, Gardner Denver Inc, Tuthill Corporation, Busch Holding GmbH, Gast Manufacturing Inc (Idex Corporation), Pneumofore SpA, Atlas Copco Group.
3. What are the main segments of the Rotary Vane Vacuum Pump Industry?
The market segments include End-user Industry, Product Type.
4. Can you provide details about the market size?
The market size is estimated to be USD XX Million as of 2022.
5. What are some drivers contributing to market growth?
Growing Electronics Industry Driven by IIoT and Digitalization; Demand for Energy-Efficient Vacuum Pumps.
6. What are the notable trends driving market growth?
Semiconductor Industry is Expected to Hold Significant Share.
7. Are there any restraints impacting market growth?
Consolidation of Market Participants.
8. Can you provide examples of recent developments in the market?
August 2022: Edwards Vacuum introduced a new two-stage oil-sealed rotary vane pump for industrial use. Edwards Vacuum's new E2S series, which includes three models, E2S45, E2S65, and E2S85, is a modern series of industrial two-stage oil-sealed rotary vane vacuum pumps for medium vacuum. The range provides an ideal balance of performance, cost, and usability. It pumps down, handles vapors, and helps to minimize the noise in the workplace. In short, a simple yet powerful rotary vane pump improves productivity and lowers costs.
9. What pricing options are available for accessing the report?
Pricing options include single-user, multi-user, and enterprise licenses priced at USD 4750, USD 5250, and USD 8750 respectively.
10. Is the market size provided in terms of value or volume?
The market size is provided in terms of value, measured in Million and volume, measured in K Unit.
11. Are there any specific market keywords associated with the report?
Yes, the market keyword associated with the report is "Rotary Vane Vacuum Pump Industry," which aids in identifying and referencing the specific market segment covered.
12. How do I determine which pricing option suits my needs best?
The pricing options vary based on user requirements and access needs. Individual users may opt for single-user licenses, while businesses requiring broader access may choose multi-user or enterprise licenses for cost-effective access to the report.
13. Are there any additional resources or data provided in the Rotary Vane Vacuum Pump Industry report?
While the report offers comprehensive insights, it's advisable to review the specific contents or supplementary materials provided to ascertain if additional resources or data are available.
14. How can I stay updated on further developments or reports in the Rotary Vane Vacuum Pump Industry?
To stay informed about further developments, trends, and reports in the Rotary Vane Vacuum Pump Industry, consider subscribing to industry newsletters, following relevant companies and organizations, or regularly checking reputable industry news sources and publications.
Methodology
Step 1 - Identification of Relevant Samples Size from Population Database


Step 2 - Approaches for Defining Global Market Size (Value, Volume* & Price*)

Note*: In applicable scenarios
Step 3 - Data Sources
Primary Research
- Web Analytics
- Survey Reports
- Research Institute
- Latest Research Reports
- Opinion Leaders
Secondary Research
- Annual Reports
- White Paper
- Latest Press Release
- Industry Association
- Paid Database
- Investor Presentations

Step 4 - Data Triangulation
Involves using different sources of information in order to increase the validity of a study
These sources are likely to be stakeholders in a program - participants, other researchers, program staff, other community members, and so on.
Then we put all data in single framework & apply various statistical tools to find out the dynamic on the market.
During the analysis stage, feedback from the stakeholder groups would be compared to determine areas of agreement as well as areas of divergence


