
Key Insights
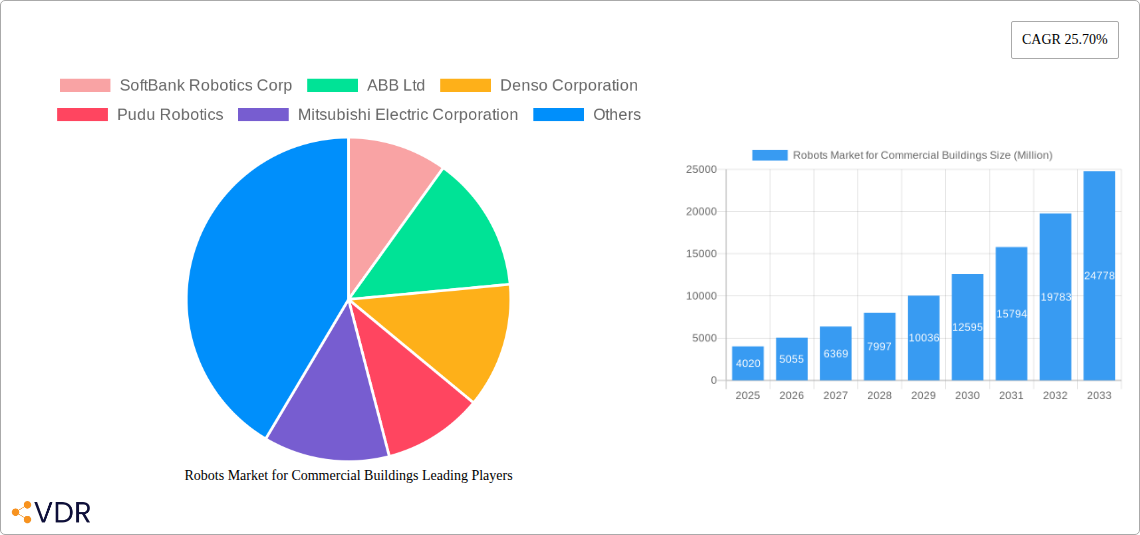
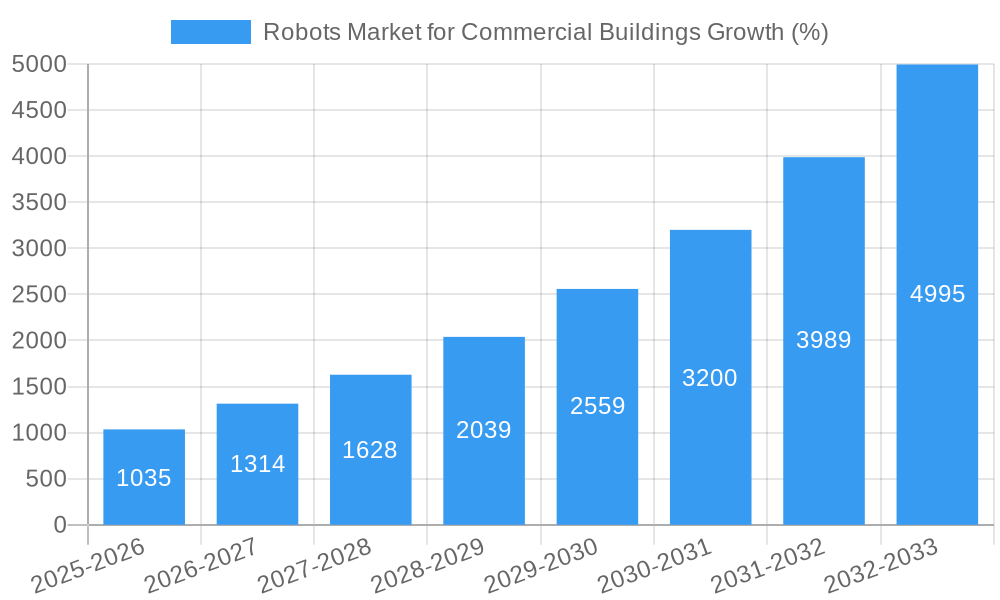
The commercial building robots market, valued at $4.02 billion in 2025, is experiencing robust growth, projected to expand at a 25.70% CAGR from 2025 to 2033. This surge is driven by several factors. Increasing labor costs, particularly in developed nations, necessitate automation to enhance efficiency and reduce operational expenses. Furthermore, the rising demand for hygiene and sanitation, especially post-pandemic, fuels the adoption of disinfection robots in healthcare facilities, airports, and retail spaces. Technological advancements leading to more sophisticated and adaptable robots, coupled with decreasing manufacturing costs, are making these solutions increasingly accessible and economically viable for businesses of various sizes. The market is segmented by robot type (floor cleaning, disinfection, retail shelf management, serving, and building service robots) and end-user verticals (retail, restaurants, healthcare, airports, and others). Leading players like SoftBank Robotics, ABB, and iRobot are driving innovation and expanding market penetration through strategic partnerships and product diversification. The Asia-Pacific region is anticipated to be a significant growth engine due to rapid urbanization and rising disposable incomes, leading to higher demand for automated services in commercial spaces. While initial investment costs can be a barrier to entry for some businesses, the long-term cost savings and enhanced efficiency offered by these robots are proving to be compelling incentives for widespread adoption. The market's future trajectory suggests that robotic automation will continue to be a pivotal component of modern commercial building management, streamlining operations and improving overall productivity.
The competitive landscape is dynamic, with both established robotics giants and agile startups vying for market share. Companies are focusing on developing robots with enhanced functionalities such as AI-powered navigation, improved sensor capabilities, and user-friendly interfaces. Strategic mergers and acquisitions are anticipated to further consolidate the market and accelerate technological advancements. Government initiatives promoting automation and smart city development will also contribute to market growth. While data privacy and security concerns remain, ongoing developments in ethical AI and data protection protocols are mitigating these risks. The ongoing evolution of robot functionalities, coupled with the increasing demand for efficient and hygienic commercial spaces, positions the commercial building robots market for significant expansion in the coming years. The segment with the strongest growth potential appears to be the disinfection robots, due to ongoing concerns regarding hygiene and infection control.
Robots Market for Commercial Buildings: A Comprehensive Market Report (2019-2033)
This in-depth report provides a comprehensive analysis of the Robots Market for Commercial Buildings, encompassing market dynamics, growth trends, regional dominance, product landscape, key players, and future outlook. The report covers the period 2019-2033, with a focus on the base year 2025 and forecast period 2025-2033. The market is segmented by robot type (Floor Cleaning Robots, Disinfection Robots, Retail Shelf Management Robots, Serving Robots, Building Service Robots) and end-user verticals (Retail, Restaurants, Healthcare Facilities, Airports, Other End-user Verticals). The report is essential for industry professionals, investors, and strategic decision-makers seeking to understand and capitalize on opportunities within this rapidly evolving market. Market values are presented in million units.
Robots Market for Commercial Buildings Market Dynamics & Structure
The commercial building robots market is experiencing robust growth, driven by technological advancements, increasing labor costs, and the rising demand for automation in various sectors. Market concentration is moderate, with several key players holding significant market share, but also witnessing increased competition from new entrants and disruptive technologies. Technological innovation, particularly in AI and autonomous navigation, is a primary growth driver, while regulatory frameworks related to safety and data privacy are shaping market development. The market also faces competition from traditional cleaning and service methods, however, the efficiency and cost savings offered by robots are slowly overcoming this. M&A activity is gradually increasing as larger companies seek to expand their portfolios and gain access to innovative technologies.
- Market Concentration: Moderate, with top 5 players holding approximately xx% of the market share in 2025.
- Technological Innovation: Significant advancements in AI, sensors, and navigation systems are driving robot capabilities and adoption.
- Regulatory Framework: Regulations concerning data privacy, safety standards, and robot operation are increasingly influential.
- Competitive Product Substitutes: Traditional manual labor and existing cleaning equipment.
- End-User Demographics: Large commercial buildings, healthcare facilities, and retail spaces are key adopters.
- M&A Trends: A steady increase in mergers and acquisitions (xx deals in 2024) among key players is anticipated.
Robots Market for Commercial Buildings Growth Trends & Insights
The global Robots Market for Commercial Buildings is experiencing substantial growth, driven by increasing demand for improved efficiency, reduced labor costs, and enhanced safety within commercial spaces. The market size is expected to reach xx million units by 2025, growing at a CAGR of xx% from 2025 to 2033. This growth is primarily fueled by the increasing adoption of robots across various end-user verticals, particularly in retail and healthcare sectors. Technological advancements, such as improved navigation, AI-powered functionalities, and enhanced cleaning capabilities are further accelerating market adoption. Consumer behavior is shifting towards automated solutions, driven by the increasing awareness of the benefits of robotics and cost-effectiveness. The market penetration rate is expected to increase significantly over the forecast period, reaching xx% by 2033.
Dominant Regions, Countries, or Segments in Robots Market for Commercial Buildings
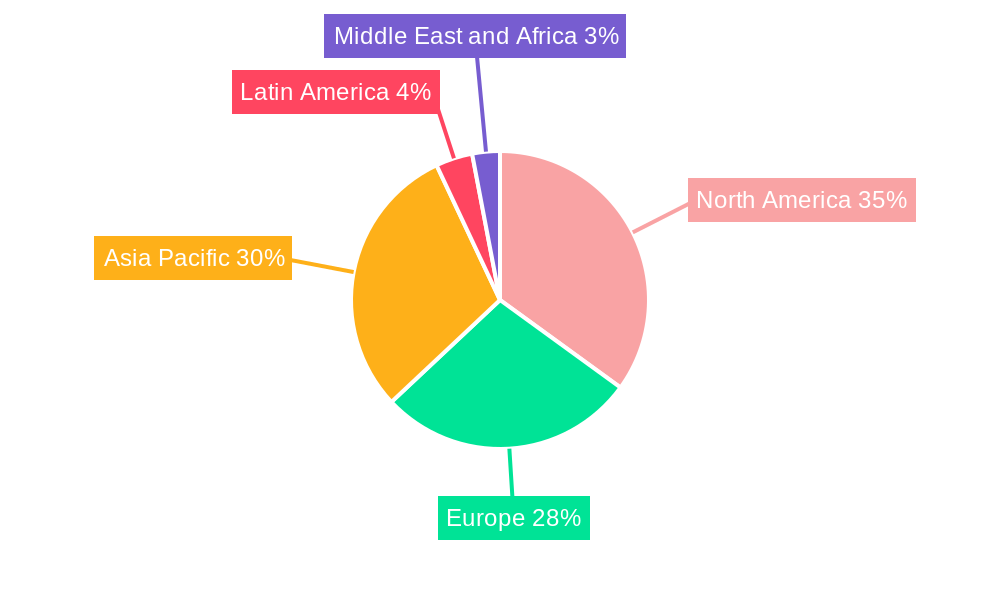
North America currently leads the Robots Market for Commercial Buildings, driven by early adoption, strong technological infrastructure, and a high concentration of key players. However, Asia-Pacific is poised for rapid growth, fueled by robust economic growth and increasing investment in automation across diverse end-user sectors.
Leading Segments:
- Type of Robots: Floor cleaning robots and disinfection robots are the largest segments, holding approximately xx% and xx% market share, respectively in 2025, driven by their immediate applicability across various commercial spaces. The serving robot segment is demonstrating the fastest growth, with a CAGR of xx%.
- End-user Verticals: The retail sector is the dominant end-user vertical, followed by healthcare facilities, driven by higher labor costs and stringent hygiene requirements in these sectors. Growth in the airport segment is predicted, driven by demand for automated cleaning and service solutions.
Key Drivers:
- North America: Strong technological advancements, early adoption, and high disposable income.
- Asia-Pacific: Rapid economic growth, substantial government investments in automation, and a large potential market.
- Europe: Stringent regulations promoting automation and increasing demand for labor-saving solutions.
Robots Market for Commercial Buildings Product Landscape
The market offers a diverse range of robots tailored to specific commercial applications, featuring advancements in AI-powered navigation, enhanced cleaning capabilities (e.g., UV disinfection), and increased efficiency. Robots are designed for seamless integration with existing building management systems and provide real-time data analytics to optimize performance. Key innovations include improved battery life, enhanced sensor technology, and user-friendly interfaces, adding to their user-friendliness and reducing operational costs.
Key Drivers, Barriers & Challenges in Robots Market for Commercial Buildings
Key Drivers:
- Rising labor costs and labor shortages.
- Increasing demand for enhanced hygiene and cleanliness.
- Technological advancements leading to improved robot capabilities and affordability.
- Government initiatives promoting automation and smart buildings.
Key Challenges & Restraints:
- High initial investment costs for robot acquisition and implementation.
- Concerns related to data privacy and cybersecurity.
- Potential job displacement concerns and workforce resistance.
- Supply chain disruptions impacting robot production and deployment (estimated xx% impact on production in 2024).
Emerging Opportunities in Robots Market for Commercial Buildings
- Expansion into untapped markets, such as smaller commercial buildings and developing economies.
- Development of specialized robots for niche applications (e.g., window cleaning, elevator maintenance).
- Integration of robots with building automation systems for comprehensive facility management.
- Growing demand for robots offering enhanced security and surveillance capabilities.
Growth Accelerators in the Robots Market for Commercial Buildings Industry
Long-term growth in the commercial building robots market will be fueled by several factors. Technological breakthroughs, such as improved AI and sensor technologies, will continue to drive down costs and increase robot capabilities. Strategic partnerships between robot manufacturers and building management companies will accelerate market penetration. Furthermore, expansion into new geographical markets and the development of innovative applications will sustain market growth for the foreseeable future.
Key Players Shaping the Robots Market for Commercial Buildings Market
- SoftBank Robotics Corp
- ABB Ltd
- Denso Corporation
- Pudu Robotics
- Mitsubishi Electric Corporation
- Nachi Fujikoshi Corporation
- Fanuc Corporation
- Kawasaki Robotics GmbH
- Samsung Electronics Co Ltd
- Ecovacs Robotics
- Diversey
- iRobot Corporation
- Vorwerk & Co KG
- Kuka AG
- Yaskawa Electric Corporation
Notable Milestones in Robots Market for Commercial Buildings Sector
- September 2022: Magna and Cartken announced an agreement to manufacture Cartken's autonomous delivery robot fleet, signaling increased manufacturing capacity for last-mile delivery robots.
- January 2023: Pudu Robotics deployed its robotic solutions in over 600 cities globally, highlighting the expanding reach and adoption of service robots in various commercial settings.
In-Depth Robots Market for Commercial Buildings Market Outlook
The future of the commercial building robots market is exceptionally promising. Continued technological advancements, expanding applications, and increased market awareness will drive substantial growth. Strategic partnerships, focusing on integrated solutions and service offerings, will be key to unlocking future market potential. The market is poised for significant expansion across various regions and end-user verticals, creating lucrative opportunities for both established and emerging players.
Robots Market for Commercial Buildings Segmentation
-
1. Type of Robots
- 1.1. Floor Cleaning Robots
- 1.2. Disinfection Robots
- 1.3. Retail Shelf Management Robots
- 1.4. Serving Robots
- 1.5. Building Service Robots
-
2. End-user Verticals
- 2.1. Retail
- 2.2. Restaurants
- 2.3. Healthcare Facilities
- 2.4. Airports
- 2.5. Other End-user Verticals
Robots Market for Commercial Buildings Segmentation By Geography
- 1. North America
- 2. Europe
- 3. Asia Pacific
- 4. Latin America
- 5. Middle East and Africa
Robots Market for Commercial Buildings REPORT HIGHLIGHTS
| Aspects | Details |
|---|---|
| Study Period | 2019-2033 |
| Base Year | 2024 |
| Estimated Year | 2025 |
| Forecast Period | 2025-2033 |
| Historical Period | 2019-2024 |
| Growth Rate | CAGR of 25.70% from 2019-2033 |
| Segmentation |
|
Table of Contents
- 1. Introduction
- 1.1. Research Scope
- 1.2. Market Segmentation
- 1.3. Research Methodology
- 1.4. Definitions and Assumptions
- 2. Executive Summary
- 2.1. Introduction
- 3. Market Dynamics
- 3.1. Introduction
- 3.2. Market Drivers
- 3.2.1 Increasing Government Initiatives for Robot Research; Various Business Models
- 3.2.2 Such As Leasing and Robot-as-a-Service
- 3.3. Market Restrains
- 3.3.1. High Product Cost; Lack of Customer Awareness
- 3.4. Market Trends
- 3.4.1. Floor Cleaning Robots Expected to Have a Major Share
- 4. Market Factor Analysis
- 4.1. Porters Five Forces
- 4.2. Supply/Value Chain
- 4.3. PESTEL analysis
- 4.4. Market Entropy
- 4.5. Patent/Trademark Analysis
- 5. Global Robots Market for Commercial Buildings Analysis, Insights and Forecast, 2019-2031
- 5.1. Market Analysis, Insights and Forecast - by Type of Robots
- 5.1.1. Floor Cleaning Robots
- 5.1.2. Disinfection Robots
- 5.1.3. Retail Shelf Management Robots
- 5.1.4. Serving Robots
- 5.1.5. Building Service Robots
- 5.2. Market Analysis, Insights and Forecast - by End-user Verticals
- 5.2.1. Retail
- 5.2.2. Restaurants
- 5.2.3. Healthcare Facilities
- 5.2.4. Airports
- 5.2.5. Other End-user Verticals
- 5.3. Market Analysis, Insights and Forecast - by Region
- 5.3.1. North America
- 5.3.2. Europe
- 5.3.3. Asia Pacific
- 5.3.4. Latin America
- 5.3.5. Middle East and Africa
- 5.1. Market Analysis, Insights and Forecast - by Type of Robots
- 6. North America Robots Market for Commercial Buildings Analysis, Insights and Forecast, 2019-2031
- 6.1. Market Analysis, Insights and Forecast - by Type of Robots
- 6.1.1. Floor Cleaning Robots
- 6.1.2. Disinfection Robots
- 6.1.3. Retail Shelf Management Robots
- 6.1.4. Serving Robots
- 6.1.5. Building Service Robots
- 6.2. Market Analysis, Insights and Forecast - by End-user Verticals
- 6.2.1. Retail
- 6.2.2. Restaurants
- 6.2.3. Healthcare Facilities
- 6.2.4. Airports
- 6.2.5. Other End-user Verticals
- 6.1. Market Analysis, Insights and Forecast - by Type of Robots
- 7. Europe Robots Market for Commercial Buildings Analysis, Insights and Forecast, 2019-2031
- 7.1. Market Analysis, Insights and Forecast - by Type of Robots
- 7.1.1. Floor Cleaning Robots
- 7.1.2. Disinfection Robots
- 7.1.3. Retail Shelf Management Robots
- 7.1.4. Serving Robots
- 7.1.5. Building Service Robots
- 7.2. Market Analysis, Insights and Forecast - by End-user Verticals
- 7.2.1. Retail
- 7.2.2. Restaurants
- 7.2.3. Healthcare Facilities
- 7.2.4. Airports
- 7.2.5. Other End-user Verticals
- 7.1. Market Analysis, Insights and Forecast - by Type of Robots
- 8. Asia Pacific Robots Market for Commercial Buildings Analysis, Insights and Forecast, 2019-2031
- 8.1. Market Analysis, Insights and Forecast - by Type of Robots
- 8.1.1. Floor Cleaning Robots
- 8.1.2. Disinfection Robots
- 8.1.3. Retail Shelf Management Robots
- 8.1.4. Serving Robots
- 8.1.5. Building Service Robots
- 8.2. Market Analysis, Insights and Forecast - by End-user Verticals
- 8.2.1. Retail
- 8.2.2. Restaurants
- 8.2.3. Healthcare Facilities
- 8.2.4. Airports
- 8.2.5. Other End-user Verticals
- 8.1. Market Analysis, Insights and Forecast - by Type of Robots
- 9. Latin America Robots Market for Commercial Buildings Analysis, Insights and Forecast, 2019-2031
- 9.1. Market Analysis, Insights and Forecast - by Type of Robots
- 9.1.1. Floor Cleaning Robots
- 9.1.2. Disinfection Robots
- 9.1.3. Retail Shelf Management Robots
- 9.1.4. Serving Robots
- 9.1.5. Building Service Robots
- 9.2. Market Analysis, Insights and Forecast - by End-user Verticals
- 9.2.1. Retail
- 9.2.2. Restaurants
- 9.2.3. Healthcare Facilities
- 9.2.4. Airports
- 9.2.5. Other End-user Verticals
- 9.1. Market Analysis, Insights and Forecast - by Type of Robots
- 10. Middle East and Africa Robots Market for Commercial Buildings Analysis, Insights and Forecast, 2019-2031
- 10.1. Market Analysis, Insights and Forecast - by Type of Robots
- 10.1.1. Floor Cleaning Robots
- 10.1.2. Disinfection Robots
- 10.1.3. Retail Shelf Management Robots
- 10.1.4. Serving Robots
- 10.1.5. Building Service Robots
- 10.2. Market Analysis, Insights and Forecast - by End-user Verticals
- 10.2.1. Retail
- 10.2.2. Restaurants
- 10.2.3. Healthcare Facilities
- 10.2.4. Airports
- 10.2.5. Other End-user Verticals
- 10.1. Market Analysis, Insights and Forecast - by Type of Robots
- 11. North America Robots Market for Commercial Buildings Analysis, Insights and Forecast, 2019-2031
- 11.1. Market Analysis, Insights and Forecast - By Country/Sub-region
- 11.1.1.
- 12. Europe Robots Market for Commercial Buildings Analysis, Insights and Forecast, 2019-2031
- 12.1. Market Analysis, Insights and Forecast - By Country/Sub-region
- 12.1.1.
- 13. Asia Pacific Robots Market for Commercial Buildings Analysis, Insights and Forecast, 2019-2031
- 13.1. Market Analysis, Insights and Forecast - By Country/Sub-region
- 13.1.1.
- 14. Latin America Robots Market for Commercial Buildings Analysis, Insights and Forecast, 2019-2031
- 14.1. Market Analysis, Insights and Forecast - By Country/Sub-region
- 14.1.1.
- 15. Middle East and Africa Robots Market for Commercial Buildings Analysis, Insights and Forecast, 2019-2031
- 15.1. Market Analysis, Insights and Forecast - By Country/Sub-region
- 15.1.1.
- 16. Competitive Analysis
- 16.1. Global Market Share Analysis 2024
- 16.2. Company Profiles
- 16.2.1 SoftBank Robotics Corp
- 16.2.1.1. Overview
- 16.2.1.2. Products
- 16.2.1.3. SWOT Analysis
- 16.2.1.4. Recent Developments
- 16.2.1.5. Financials (Based on Availability)
- 16.2.2 ABB Ltd
- 16.2.2.1. Overview
- 16.2.2.2. Products
- 16.2.2.3. SWOT Analysis
- 16.2.2.4. Recent Developments
- 16.2.2.5. Financials (Based on Availability)
- 16.2.3 Denso Corporation
- 16.2.3.1. Overview
- 16.2.3.2. Products
- 16.2.3.3. SWOT Analysis
- 16.2.3.4. Recent Developments
- 16.2.3.5. Financials (Based on Availability)
- 16.2.4 Pudu Robotics
- 16.2.4.1. Overview
- 16.2.4.2. Products
- 16.2.4.3. SWOT Analysis
- 16.2.4.4. Recent Developments
- 16.2.4.5. Financials (Based on Availability)
- 16.2.5 Mitsubishi Electric Corporation
- 16.2.5.1. Overview
- 16.2.5.2. Products
- 16.2.5.3. SWOT Analysis
- 16.2.5.4. Recent Developments
- 16.2.5.5. Financials (Based on Availability)
- 16.2.6 Nachi Fujikoshi Corporation
- 16.2.6.1. Overview
- 16.2.6.2. Products
- 16.2.6.3. SWOT Analysis
- 16.2.6.4. Recent Developments
- 16.2.6.5. Financials (Based on Availability)
- 16.2.7 Fanuc Corporation
- 16.2.7.1. Overview
- 16.2.7.2. Products
- 16.2.7.3. SWOT Analysis
- 16.2.7.4. Recent Developments
- 16.2.7.5. Financials (Based on Availability)
- 16.2.8 Kawasaki Robotics GmbH
- 16.2.8.1. Overview
- 16.2.8.2. Products
- 16.2.8.3. SWOT Analysis
- 16.2.8.4. Recent Developments
- 16.2.8.5. Financials (Based on Availability)
- 16.2.9 Samsung Electronics Co Ltd
- 16.2.9.1. Overview
- 16.2.9.2. Products
- 16.2.9.3. SWOT Analysis
- 16.2.9.4. Recent Developments
- 16.2.9.5. Financials (Based on Availability)
- 16.2.10 Ecovacs Robotics
- 16.2.10.1. Overview
- 16.2.10.2. Products
- 16.2.10.3. SWOT Analysis
- 16.2.10.4. Recent Developments
- 16.2.10.5. Financials (Based on Availability)
- 16.2.11 Diversey
- 16.2.11.1. Overview
- 16.2.11.2. Products
- 16.2.11.3. SWOT Analysis
- 16.2.11.4. Recent Developments
- 16.2.11.5. Financials (Based on Availability)
- 16.2.12 iRobot Corporation
- 16.2.12.1. Overview
- 16.2.12.2. Products
- 16.2.12.3. SWOT Analysis
- 16.2.12.4. Recent Developments
- 16.2.12.5. Financials (Based on Availability)
- 16.2.13 Vorwerk & Co KG*List Not Exhaustive
- 16.2.13.1. Overview
- 16.2.13.2. Products
- 16.2.13.3. SWOT Analysis
- 16.2.13.4. Recent Developments
- 16.2.13.5. Financials (Based on Availability)
- 16.2.14 Kuka AG
- 16.2.14.1. Overview
- 16.2.14.2. Products
- 16.2.14.3. SWOT Analysis
- 16.2.14.4. Recent Developments
- 16.2.14.5. Financials (Based on Availability)
- 16.2.15 Yaskawa Electric Corporation
- 16.2.15.1. Overview
- 16.2.15.2. Products
- 16.2.15.3. SWOT Analysis
- 16.2.15.4. Recent Developments
- 16.2.15.5. Financials (Based on Availability)
- 16.2.1 SoftBank Robotics Corp
List of Figures
- Figure 1: Global Robots Market for Commercial Buildings Revenue Breakdown (Million, %) by Region 2024 & 2032
- Figure 2: North America Robots Market for Commercial Buildings Revenue (Million), by Country 2024 & 2032
- Figure 3: North America Robots Market for Commercial Buildings Revenue Share (%), by Country 2024 & 2032
- Figure 4: Europe Robots Market for Commercial Buildings Revenue (Million), by Country 2024 & 2032
- Figure 5: Europe Robots Market for Commercial Buildings Revenue Share (%), by Country 2024 & 2032
- Figure 6: Asia Pacific Robots Market for Commercial Buildings Revenue (Million), by Country 2024 & 2032
- Figure 7: Asia Pacific Robots Market for Commercial Buildings Revenue Share (%), by Country 2024 & 2032
- Figure 8: Latin America Robots Market for Commercial Buildings Revenue (Million), by Country 2024 & 2032
- Figure 9: Latin America Robots Market for Commercial Buildings Revenue Share (%), by Country 2024 & 2032
- Figure 10: Middle East and Africa Robots Market for Commercial Buildings Revenue (Million), by Country 2024 & 2032
- Figure 11: Middle East and Africa Robots Market for Commercial Buildings Revenue Share (%), by Country 2024 & 2032
- Figure 12: North America Robots Market for Commercial Buildings Revenue (Million), by Type of Robots 2024 & 2032
- Figure 13: North America Robots Market for Commercial Buildings Revenue Share (%), by Type of Robots 2024 & 2032
- Figure 14: North America Robots Market for Commercial Buildings Revenue (Million), by End-user Verticals 2024 & 2032
- Figure 15: North America Robots Market for Commercial Buildings Revenue Share (%), by End-user Verticals 2024 & 2032
- Figure 16: North America Robots Market for Commercial Buildings Revenue (Million), by Country 2024 & 2032
- Figure 17: North America Robots Market for Commercial Buildings Revenue Share (%), by Country 2024 & 2032
- Figure 18: Europe Robots Market for Commercial Buildings Revenue (Million), by Type of Robots 2024 & 2032
- Figure 19: Europe Robots Market for Commercial Buildings Revenue Share (%), by Type of Robots 2024 & 2032
- Figure 20: Europe Robots Market for Commercial Buildings Revenue (Million), by End-user Verticals 2024 & 2032
- Figure 21: Europe Robots Market for Commercial Buildings Revenue Share (%), by End-user Verticals 2024 & 2032
- Figure 22: Europe Robots Market for Commercial Buildings Revenue (Million), by Country 2024 & 2032
- Figure 23: Europe Robots Market for Commercial Buildings Revenue Share (%), by Country 2024 & 2032
- Figure 24: Asia Pacific Robots Market for Commercial Buildings Revenue (Million), by Type of Robots 2024 & 2032
- Figure 25: Asia Pacific Robots Market for Commercial Buildings Revenue Share (%), by Type of Robots 2024 & 2032
- Figure 26: Asia Pacific Robots Market for Commercial Buildings Revenue (Million), by End-user Verticals 2024 & 2032
- Figure 27: Asia Pacific Robots Market for Commercial Buildings Revenue Share (%), by End-user Verticals 2024 & 2032
- Figure 28: Asia Pacific Robots Market for Commercial Buildings Revenue (Million), by Country 2024 & 2032
- Figure 29: Asia Pacific Robots Market for Commercial Buildings Revenue Share (%), by Country 2024 & 2032
- Figure 30: Latin America Robots Market for Commercial Buildings Revenue (Million), by Type of Robots 2024 & 2032
- Figure 31: Latin America Robots Market for Commercial Buildings Revenue Share (%), by Type of Robots 2024 & 2032
- Figure 32: Latin America Robots Market for Commercial Buildings Revenue (Million), by End-user Verticals 2024 & 2032
- Figure 33: Latin America Robots Market for Commercial Buildings Revenue Share (%), by End-user Verticals 2024 & 2032
- Figure 34: Latin America Robots Market for Commercial Buildings Revenue (Million), by Country 2024 & 2032
- Figure 35: Latin America Robots Market for Commercial Buildings Revenue Share (%), by Country 2024 & 2032
- Figure 36: Middle East and Africa Robots Market for Commercial Buildings Revenue (Million), by Type of Robots 2024 & 2032
- Figure 37: Middle East and Africa Robots Market for Commercial Buildings Revenue Share (%), by Type of Robots 2024 & 2032
- Figure 38: Middle East and Africa Robots Market for Commercial Buildings Revenue (Million), by End-user Verticals 2024 & 2032
- Figure 39: Middle East and Africa Robots Market for Commercial Buildings Revenue Share (%), by End-user Verticals 2024 & 2032
- Figure 40: Middle East and Africa Robots Market for Commercial Buildings Revenue (Million), by Country 2024 & 2032
- Figure 41: Middle East and Africa Robots Market for Commercial Buildings Revenue Share (%), by Country 2024 & 2032
List of Tables
- Table 1: Global Robots Market for Commercial Buildings Revenue Million Forecast, by Region 2019 & 2032
- Table 2: Global Robots Market for Commercial Buildings Revenue Million Forecast, by Type of Robots 2019 & 2032
- Table 3: Global Robots Market for Commercial Buildings Revenue Million Forecast, by End-user Verticals 2019 & 2032
- Table 4: Global Robots Market for Commercial Buildings Revenue Million Forecast, by Region 2019 & 2032
- Table 5: Global Robots Market for Commercial Buildings Revenue Million Forecast, by Country 2019 & 2032
- Table 6: Robots Market for Commercial Buildings Revenue (Million) Forecast, by Application 2019 & 2032
- Table 7: Global Robots Market for Commercial Buildings Revenue Million Forecast, by Country 2019 & 2032
- Table 8: Robots Market for Commercial Buildings Revenue (Million) Forecast, by Application 2019 & 2032
- Table 9: Global Robots Market for Commercial Buildings Revenue Million Forecast, by Country 2019 & 2032
- Table 10: Robots Market for Commercial Buildings Revenue (Million) Forecast, by Application 2019 & 2032
- Table 11: Global Robots Market for Commercial Buildings Revenue Million Forecast, by Country 2019 & 2032
- Table 12: Robots Market for Commercial Buildings Revenue (Million) Forecast, by Application 2019 & 2032
- Table 13: Global Robots Market for Commercial Buildings Revenue Million Forecast, by Country 2019 & 2032
- Table 14: Robots Market for Commercial Buildings Revenue (Million) Forecast, by Application 2019 & 2032
- Table 15: Global Robots Market for Commercial Buildings Revenue Million Forecast, by Type of Robots 2019 & 2032
- Table 16: Global Robots Market for Commercial Buildings Revenue Million Forecast, by End-user Verticals 2019 & 2032
- Table 17: Global Robots Market for Commercial Buildings Revenue Million Forecast, by Country 2019 & 2032
- Table 18: Global Robots Market for Commercial Buildings Revenue Million Forecast, by Type of Robots 2019 & 2032
- Table 19: Global Robots Market for Commercial Buildings Revenue Million Forecast, by End-user Verticals 2019 & 2032
- Table 20: Global Robots Market for Commercial Buildings Revenue Million Forecast, by Country 2019 & 2032
- Table 21: Global Robots Market for Commercial Buildings Revenue Million Forecast, by Type of Robots 2019 & 2032
- Table 22: Global Robots Market for Commercial Buildings Revenue Million Forecast, by End-user Verticals 2019 & 2032
- Table 23: Global Robots Market for Commercial Buildings Revenue Million Forecast, by Country 2019 & 2032
- Table 24: Global Robots Market for Commercial Buildings Revenue Million Forecast, by Type of Robots 2019 & 2032
- Table 25: Global Robots Market for Commercial Buildings Revenue Million Forecast, by End-user Verticals 2019 & 2032
- Table 26: Global Robots Market for Commercial Buildings Revenue Million Forecast, by Country 2019 & 2032
- Table 27: Global Robots Market for Commercial Buildings Revenue Million Forecast, by Type of Robots 2019 & 2032
- Table 28: Global Robots Market for Commercial Buildings Revenue Million Forecast, by End-user Verticals 2019 & 2032
- Table 29: Global Robots Market for Commercial Buildings Revenue Million Forecast, by Country 2019 & 2032
Frequently Asked Questions
1. What is the projected Compound Annual Growth Rate (CAGR) of the Robots Market for Commercial Buildings?
The projected CAGR is approximately 25.70%.
2. Which companies are prominent players in the Robots Market for Commercial Buildings?
Key companies in the market include SoftBank Robotics Corp, ABB Ltd, Denso Corporation, Pudu Robotics, Mitsubishi Electric Corporation, Nachi Fujikoshi Corporation, Fanuc Corporation, Kawasaki Robotics GmbH, Samsung Electronics Co Ltd, Ecovacs Robotics, Diversey, iRobot Corporation, Vorwerk & Co KG*List Not Exhaustive, Kuka AG, Yaskawa Electric Corporation.
3. What are the main segments of the Robots Market for Commercial Buildings?
The market segments include Type of Robots, End-user Verticals.
4. Can you provide details about the market size?
The market size is estimated to be USD 4.02 Million as of 2022.
5. What are some drivers contributing to market growth?
Increasing Government Initiatives for Robot Research; Various Business Models. Such As Leasing and Robot-as-a-Service.
6. What are the notable trends driving market growth?
Floor Cleaning Robots Expected to Have a Major Share.
7. Are there any restraints impacting market growth?
High Product Cost; Lack of Customer Awareness.
8. Can you provide examples of recent developments in the market?
January 2023: Pudu Robotics, a service robot manufacturer, deployed its robotic solutions in more than 600 cities worldwide as of the end of 2022. The company aims to expand its services and use cases in 2023. To bring its robots to more industries, PUDU has partnered with several major hotel brands, including Marriott and Hilton. PUDU's robots have also been used at restaurants, shopping malls, convenience stores, and office buildings.
9. What pricing options are available for accessing the report?
Pricing options include single-user, multi-user, and enterprise licenses priced at USD 4750, USD 5250, and USD 8750 respectively.
10. Is the market size provided in terms of value or volume?
The market size is provided in terms of value, measured in Million.
11. Are there any specific market keywords associated with the report?
Yes, the market keyword associated with the report is "Robots Market for Commercial Buildings," which aids in identifying and referencing the specific market segment covered.
12. How do I determine which pricing option suits my needs best?
The pricing options vary based on user requirements and access needs. Individual users may opt for single-user licenses, while businesses requiring broader access may choose multi-user or enterprise licenses for cost-effective access to the report.
13. Are there any additional resources or data provided in the Robots Market for Commercial Buildings report?
While the report offers comprehensive insights, it's advisable to review the specific contents or supplementary materials provided to ascertain if additional resources or data are available.
14. How can I stay updated on further developments or reports in the Robots Market for Commercial Buildings?
To stay informed about further developments, trends, and reports in the Robots Market for Commercial Buildings, consider subscribing to industry newsletters, following relevant companies and organizations, or regularly checking reputable industry news sources and publications.
Methodology
Step 1 - Identification of Relevant Samples Size from Population Database


Step 2 - Approaches for Defining Global Market Size (Value, Volume* & Price*)

Note*: In applicable scenarios
Step 3 - Data Sources
Primary Research
- Web Analytics
- Survey Reports
- Research Institute
- Latest Research Reports
- Opinion Leaders
Secondary Research
- Annual Reports
- White Paper
- Latest Press Release
- Industry Association
- Paid Database
- Investor Presentations

Step 4 - Data Triangulation
Involves using different sources of information in order to increase the validity of a study
These sources are likely to be stakeholders in a program - participants, other researchers, program staff, other community members, and so on.
Then we put all data in single framework & apply various statistical tools to find out the dynamic on the market.
During the analysis stage, feedback from the stakeholder groups would be compared to determine areas of agreement as well as areas of divergence


