
Key Insights
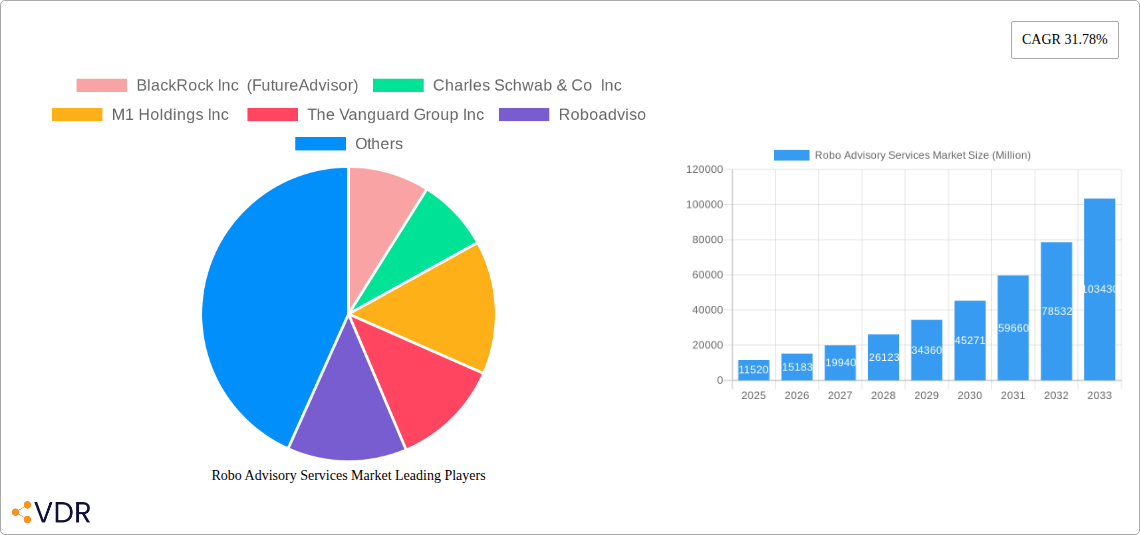
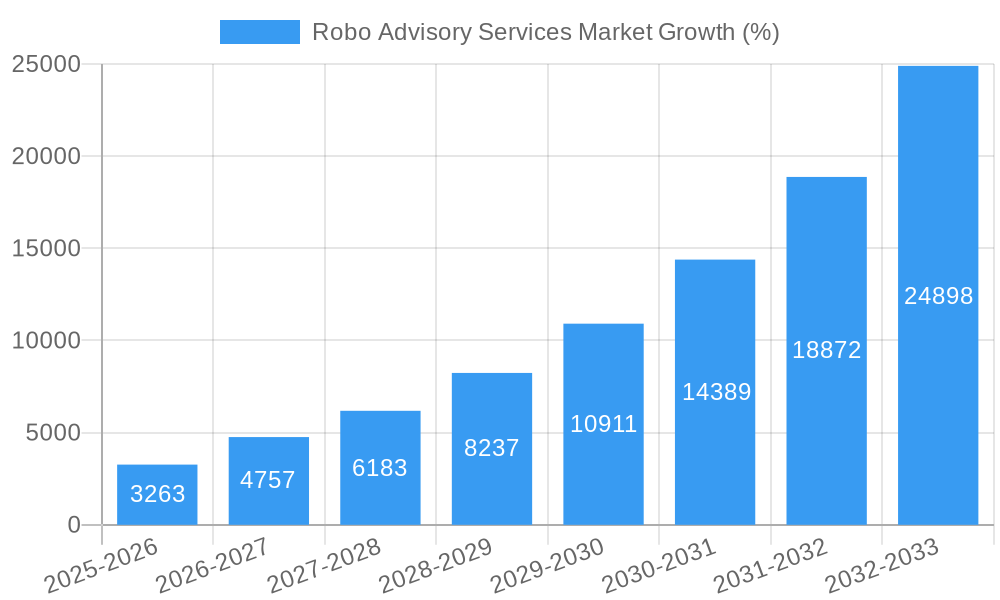
The Robo-advisory services market is experiencing robust growth, projected to reach $11.52 billion in 2025 and exhibiting a remarkable Compound Annual Growth Rate (CAGR) of 31.78% from 2025 to 2033. This expansion is driven by several key factors. The increasing adoption of digital technologies and online financial platforms by a younger, tech-savvy generation fuels demand for convenient and cost-effective investment solutions. Furthermore, the rising need for personalized financial planning, particularly among millennials and Gen Z, is a significant driver. Robo-advisors offer algorithmic-driven portfolio management, catering to diverse risk profiles and financial goals, providing accessibility to sophisticated investment strategies previously limited to high-net-worth individuals. The market’s growth is further propelled by advancements in artificial intelligence (AI) and machine learning (ML), leading to more efficient and personalized investment recommendations. Regulatory changes fostering innovation in the fintech sector also contribute to this positive market trajectory.
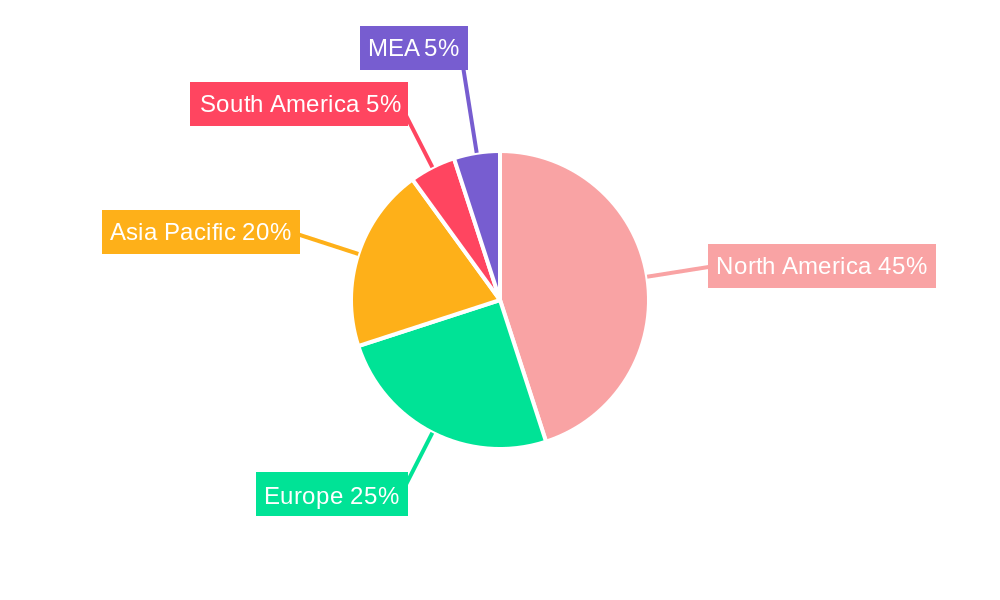
The market segmentation reveals strong demand across various service types, including investment advisory, wealth management, retirement planning, and tax-loss harvesting. North America currently holds a significant market share, driven by early adoption and a mature fintech ecosystem, although Asia-Pacific is expected to witness significant growth in the coming years due to increasing internet penetration and rising disposable incomes. Key players like BlackRock (FutureAdvisor), Charles Schwab, Fidelity Go, Betterment, and Wealthfront are actively shaping the market landscape through continuous innovation and strategic partnerships, further consolidating the growth trajectory. While challenges such as cybersecurity concerns and regulatory compliance remain, the overall market outlook for robo-advisory services remains highly positive, with substantial opportunities for expansion across various geographic regions and service offerings.
This comprehensive report provides an in-depth analysis of the Robo Advisory Services Market, encompassing market dynamics, growth trends, regional segmentation, product landscape, key players, and future outlook. The study period covers 2019-2033, with 2025 as the base and estimated year. This report is essential for investors, industry professionals, and anyone seeking a thorough understanding of this rapidly evolving market. The market is segmented by type of services including Investment Advisors, Wealth Management, Retirement Planning, and Tax-loss Harvesting.
Robo Advisory Services Market Dynamics & Structure
This section analyzes the competitive landscape, technological advancements, regulatory environment, and market trends influencing the Robo Advisory Services Market. The market exhibits a moderately concentrated structure, with key players like BlackRock Inc (FutureAdvisor), Charles Schwab & Co Inc, and Fidelity Investments (Fidelity Go) holding significant market share. However, the market is also characterized by a high degree of innovation, with new entrants and disruptive technologies continuously shaping the landscape.
- Market Concentration: The top 5 players account for approximately xx% of the market in 2025, indicating a moderately consolidated structure.
- Technological Innovation: AI-powered algorithms, advanced analytics, and enhanced user interfaces are driving market growth. However, the complexities of integrating these technologies pose an innovation barrier for some players.
- Regulatory Frameworks: Government regulations concerning data privacy, security, and investment advice are crucial to the market. Changes in these regulations can significantly impact market dynamics.
- Competitive Product Substitutes: Traditional financial advisors remain a major competitive substitute, particularly for high-net-worth individuals. However, the increasing adoption of digital solutions is gradually shifting market share towards robo-advisors.
- End-User Demographics: The target market encompasses a broad demographic, ranging from millennials and Gen Z to older generations increasingly embracing digital solutions for financial management.
- M&A Trends: The number of M&A deals in the Robo Advisory Services Market increased by xx% between 2022 and 2023, reflecting ongoing consolidation efforts.
Robo Advisory Services Market Growth Trends & Insights
The global Robo Advisory Services Market is experiencing significant growth, driven by increasing demand for cost-effective and accessible financial solutions. The market size, valued at $xx Million in 2025, is projected to reach $xx Million by 2033, exhibiting a CAGR of xx%. This expansion is fueled by several factors: rising digital adoption, increasing financial literacy, and the growing popularity of automated investment solutions. Technological innovations such as personalized portfolio management and AI-powered investment strategies are enhancing the user experience and driving adoption rates. Furthermore, changing consumer behavior, marked by a preference for self-directed and personalized financial solutions, is contributing to the market's growth. The market penetration rate is expected to reach xx% by 2033.
Dominant Regions, Countries, or Segments in Robo Advisory Services Market
North America currently dominates the Robo Advisory Services Market, accounting for approximately xx% of the global market share in 2025. This dominance is primarily attributable to factors such as high internet penetration, strong technological infrastructure, and the presence of key market players. However, significant growth opportunities exist in Asia-Pacific and Europe, driven by increasing digitalization and expanding middle class. Within the service types, Wealth Management and Retirement Planning are the dominant segments, expected to account for approximately xx% and xx% of the market respectively.
- Key Drivers in North America:
- High adoption of digital technologies.
- Established regulatory framework.
- Presence of major market players.
- Growth Potential in Asia-Pacific:
- Rapid technological advancement.
- Expanding middle class with growing investment needs.
- Favorable government initiatives.
- Dominant Segment: Wealth Management: The demand for personalized wealth management services is rising, driven by rising disposable incomes and increased awareness of financial planning.
- Dominant Segment: Retirement Planning: Growing aging population and increased emphasis on retirement savings are key factors behind the segment's growth.
Robo Advisory Services Market Product Landscape
Robo-advisory platforms offer a range of services including automated portfolio management, personalized financial advice, and tax-loss harvesting. Key product innovations focus on enhanced personalization, integration with other financial tools, and the incorporation of advanced AI algorithms for more sophisticated investment strategies. The industry is seeing a trend toward platforms offering hybrid solutions, combining automated advice with access to human advisors.
Key Drivers, Barriers & Challenges in Robo Advisory Services Market
Key Drivers:
- Increasing adoption of digital financial services.
- Rising demand for affordable and accessible investment solutions.
- Growing awareness of the benefits of financial planning.
- Technological advancements in AI and machine learning.
Challenges:
- Regulatory hurdles and compliance requirements.
- Security concerns associated with online platforms.
- Competition from traditional financial advisors.
- Maintaining trust and transparency.
Emerging Opportunities in Robo Advisory Services Market
- Expansion into underserved markets.
- Development of niche robo-advisory products (e.g., ethical investing, sustainable investing).
- Integration with other financial management tools and services.
- Growing demand for hybrid models combining human advice with automated solutions.
Growth Accelerators in the Robo Advisory Services Market Industry
The long-term growth of the Robo Advisory Services Market will be significantly fueled by continued technological advancements in AI and machine learning, strategic partnerships between fintech companies and traditional financial institutions, and the expansion of services to include sophisticated financial planning tools. The increasing sophistication of algorithms will allow for increasingly customized portfolio construction, driving user adoption and market expansion.
Key Players Shaping the Robo Advisory Services Market Market
- BlackRock Inc (FutureAdvisor)
- Charles Schwab & Co Inc
- M1 Holdings Inc
- The Vanguard Group Inc
- Roboadviso
- FMR LLC (Fidelity Go)
- Betterment LLC
- Wealthfront Corporation
Notable Milestones in Robo Advisory Services Market Sector
- August 2023: Wealthfront announced new stock collections focused on AI and inflation, expanding investment options and lowering the entry barrier to USD 1.
- January 2024: Betterment launched a product allowing small businesses to match employee student loan payments with 401(k) contributions, integrating financial wellness and retirement savings.
In-Depth Robo Advisory Services Market Market Outlook
The Robo Advisory Services Market is poised for continued strong growth in the coming years. Technological advancements, increasing consumer adoption, and strategic partnerships will drive market expansion. The focus on personalized solutions and hybrid models will further enhance the appeal of robo-advisors, creating significant opportunities for market players. Companies focusing on innovation, regulatory compliance, and enhanced user experience will be best positioned to capitalize on the market's potential.
Robo Advisory Services Market Segmentation
-
1. Type of Services
- 1.1. Investment Advisors
- 1.2. Wealth Management
- 1.3. Retirement Planning
- 1.4. Tax-loss Harvesting
Robo Advisory Services Market Segmentation By Geography
- 1. North America
- 2. Europe
- 3. Asia Pacific
- 4. Rest of the World
Robo Advisory Services Market REPORT HIGHLIGHTS
| Aspects | Details |
|---|---|
| Study Period | 2019-2033 |
| Base Year | 2024 |
| Estimated Year | 2025 |
| Forecast Period | 2025-2033 |
| Historical Period | 2019-2024 |
| Growth Rate | CAGR of 31.78% from 2019-2033 |
| Segmentation |
|
Table of Contents
- 1. Introduction
- 1.1. Research Scope
- 1.2. Market Segmentation
- 1.3. Research Methodology
- 1.4. Definitions and Assumptions
- 2. Executive Summary
- 2.1. Introduction
- 3. Market Dynamics
- 3.1. Introduction
- 3.2. Market Drivers
- 3.2.1. Digitization of the BFSI Industry; Cost-efficiency in Managing Personal Finance
- 3.3. Market Restrains
- 3.3.1. Lack of Human Expertise and Empathy; Nascency of the Technology
- 3.4. Market Trends
- 3.4.1. Investment Advisory Expected to Gain Maximum Traction
- 4. Market Factor Analysis
- 4.1. Porters Five Forces
- 4.2. Supply/Value Chain
- 4.3. PESTEL analysis
- 4.4. Market Entropy
- 4.5. Patent/Trademark Analysis
- 5. Global Robo Advisory Services Market Analysis, Insights and Forecast, 2019-2031
- 5.1. Market Analysis, Insights and Forecast - by Type of Services
- 5.1.1. Investment Advisors
- 5.1.2. Wealth Management
- 5.1.3. Retirement Planning
- 5.1.4. Tax-loss Harvesting
- 5.2. Market Analysis, Insights and Forecast - by Region
- 5.2.1. North America
- 5.2.2. Europe
- 5.2.3. Asia Pacific
- 5.2.4. Rest of the World
- 5.1. Market Analysis, Insights and Forecast - by Type of Services
- 6. North America Robo Advisory Services Market Analysis, Insights and Forecast, 2019-2031
- 6.1. Market Analysis, Insights and Forecast - by Type of Services
- 6.1.1. Investment Advisors
- 6.1.2. Wealth Management
- 6.1.3. Retirement Planning
- 6.1.4. Tax-loss Harvesting
- 6.1. Market Analysis, Insights and Forecast - by Type of Services
- 7. Europe Robo Advisory Services Market Analysis, Insights and Forecast, 2019-2031
- 7.1. Market Analysis, Insights and Forecast - by Type of Services
- 7.1.1. Investment Advisors
- 7.1.2. Wealth Management
- 7.1.3. Retirement Planning
- 7.1.4. Tax-loss Harvesting
- 7.1. Market Analysis, Insights and Forecast - by Type of Services
- 8. Asia Pacific Robo Advisory Services Market Analysis, Insights and Forecast, 2019-2031
- 8.1. Market Analysis, Insights and Forecast - by Type of Services
- 8.1.1. Investment Advisors
- 8.1.2. Wealth Management
- 8.1.3. Retirement Planning
- 8.1.4. Tax-loss Harvesting
- 8.1. Market Analysis, Insights and Forecast - by Type of Services
- 9. Rest of the World Robo Advisory Services Market Analysis, Insights and Forecast, 2019-2031
- 9.1. Market Analysis, Insights and Forecast - by Type of Services
- 9.1.1. Investment Advisors
- 9.1.2. Wealth Management
- 9.1.3. Retirement Planning
- 9.1.4. Tax-loss Harvesting
- 9.1. Market Analysis, Insights and Forecast - by Type of Services
- 10. North America Robo Advisory Services Market Analysis, Insights and Forecast, 2019-2031
- 10.1. Market Analysis, Insights and Forecast - By Country/Sub-region
- 10.1.1 United States
- 10.1.2 Canada
- 10.1.3 Mexico
- 11. Europe Robo Advisory Services Market Analysis, Insights and Forecast, 2019-2031
- 11.1. Market Analysis, Insights and Forecast - By Country/Sub-region
- 11.1.1 Germany
- 11.1.2 United Kingdom
- 11.1.3 France
- 11.1.4 Spain
- 11.1.5 Italy
- 11.1.6 Spain
- 11.1.7 Belgium
- 11.1.8 Netherland
- 11.1.9 Nordics
- 11.1.10 Rest of Europe
- 12. Asia Pacific Robo Advisory Services Market Analysis, Insights and Forecast, 2019-2031
- 12.1. Market Analysis, Insights and Forecast - By Country/Sub-region
- 12.1.1 China
- 12.1.2 Japan
- 12.1.3 India
- 12.1.4 South Korea
- 12.1.5 Southeast Asia
- 12.1.6 Australia
- 12.1.7 Indonesia
- 12.1.8 Phillipes
- 12.1.9 Singapore
- 12.1.10 Thailandc
- 12.1.11 Rest of Asia Pacific
- 13. South America Robo Advisory Services Market Analysis, Insights and Forecast, 2019-2031
- 13.1. Market Analysis, Insights and Forecast - By Country/Sub-region
- 13.1.1 Brazil
- 13.1.2 Argentina
- 13.1.3 Peru
- 13.1.4 Chile
- 13.1.5 Colombia
- 13.1.6 Ecuador
- 13.1.7 Venezuela
- 13.1.8 Rest of South America
- 14. North America Robo Advisory Services Market Analysis, Insights and Forecast, 2019-2031
- 14.1. Market Analysis, Insights and Forecast - By Country/Sub-region
- 14.1.1 United States
- 14.1.2 Canada
- 14.1.3 Mexico
- 15. MEA Robo Advisory Services Market Analysis, Insights and Forecast, 2019-2031
- 15.1. Market Analysis, Insights and Forecast - By Country/Sub-region
- 15.1.1 United Arab Emirates
- 15.1.2 Saudi Arabia
- 15.1.3 South Africa
- 15.1.4 Rest of Middle East and Africa
- 16. Competitive Analysis
- 16.1. Global Market Share Analysis 2024
- 16.2. Company Profiles
- 16.2.1 BlackRock Inc (FutureAdvisor)
- 16.2.1.1. Overview
- 16.2.1.2. Products
- 16.2.1.3. SWOT Analysis
- 16.2.1.4. Recent Developments
- 16.2.1.5. Financials (Based on Availability)
- 16.2.2 Charles Schwab & Co Inc
- 16.2.2.1. Overview
- 16.2.2.2. Products
- 16.2.2.3. SWOT Analysis
- 16.2.2.4. Recent Developments
- 16.2.2.5. Financials (Based on Availability)
- 16.2.3 M1 Holdings Inc
- 16.2.3.1. Overview
- 16.2.3.2. Products
- 16.2.3.3. SWOT Analysis
- 16.2.3.4. Recent Developments
- 16.2.3.5. Financials (Based on Availability)
- 16.2.4 The Vanguard Group Inc
- 16.2.4.1. Overview
- 16.2.4.2. Products
- 16.2.4.3. SWOT Analysis
- 16.2.4.4. Recent Developments
- 16.2.4.5. Financials (Based on Availability)
- 16.2.5 Roboadviso
- 16.2.5.1. Overview
- 16.2.5.2. Products
- 16.2.5.3. SWOT Analysis
- 16.2.5.4. Recent Developments
- 16.2.5.5. Financials (Based on Availability)
- 16.2.6 FMR LLC (Fidelity Go)
- 16.2.6.1. Overview
- 16.2.6.2. Products
- 16.2.6.3. SWOT Analysis
- 16.2.6.4. Recent Developments
- 16.2.6.5. Financials (Based on Availability)
- 16.2.7 Betterment LLC
- 16.2.7.1. Overview
- 16.2.7.2. Products
- 16.2.7.3. SWOT Analysis
- 16.2.7.4. Recent Developments
- 16.2.7.5. Financials (Based on Availability)
- 16.2.8 Wealthfront Corporation
- 16.2.8.1. Overview
- 16.2.8.2. Products
- 16.2.8.3. SWOT Analysis
- 16.2.8.4. Recent Developments
- 16.2.8.5. Financials (Based on Availability)
- 16.2.1 BlackRock Inc (FutureAdvisor)
List of Figures
- Figure 1: Global Robo Advisory Services Market Revenue Breakdown (Million, %) by Region 2024 & 2032
- Figure 2: Global Robo Advisory Services Market Volume Breakdown (K Unit, %) by Region 2024 & 2032
- Figure 3: North America Robo Advisory Services Market Revenue (Million), by Country 2024 & 2032
- Figure 4: North America Robo Advisory Services Market Volume (K Unit), by Country 2024 & 2032
- Figure 5: North America Robo Advisory Services Market Revenue Share (%), by Country 2024 & 2032
- Figure 6: North America Robo Advisory Services Market Volume Share (%), by Country 2024 & 2032
- Figure 7: Europe Robo Advisory Services Market Revenue (Million), by Country 2024 & 2032
- Figure 8: Europe Robo Advisory Services Market Volume (K Unit), by Country 2024 & 2032
- Figure 9: Europe Robo Advisory Services Market Revenue Share (%), by Country 2024 & 2032
- Figure 10: Europe Robo Advisory Services Market Volume Share (%), by Country 2024 & 2032
- Figure 11: Asia Pacific Robo Advisory Services Market Revenue (Million), by Country 2024 & 2032
- Figure 12: Asia Pacific Robo Advisory Services Market Volume (K Unit), by Country 2024 & 2032
- Figure 13: Asia Pacific Robo Advisory Services Market Revenue Share (%), by Country 2024 & 2032
- Figure 14: Asia Pacific Robo Advisory Services Market Volume Share (%), by Country 2024 & 2032
- Figure 15: South America Robo Advisory Services Market Revenue (Million), by Country 2024 & 2032
- Figure 16: South America Robo Advisory Services Market Volume (K Unit), by Country 2024 & 2032
- Figure 17: South America Robo Advisory Services Market Revenue Share (%), by Country 2024 & 2032
- Figure 18: South America Robo Advisory Services Market Volume Share (%), by Country 2024 & 2032
- Figure 19: North America Robo Advisory Services Market Revenue (Million), by Country 2024 & 2032
- Figure 20: North America Robo Advisory Services Market Volume (K Unit), by Country 2024 & 2032
- Figure 21: North America Robo Advisory Services Market Revenue Share (%), by Country 2024 & 2032
- Figure 22: North America Robo Advisory Services Market Volume Share (%), by Country 2024 & 2032
- Figure 23: MEA Robo Advisory Services Market Revenue (Million), by Country 2024 & 2032
- Figure 24: MEA Robo Advisory Services Market Volume (K Unit), by Country 2024 & 2032
- Figure 25: MEA Robo Advisory Services Market Revenue Share (%), by Country 2024 & 2032
- Figure 26: MEA Robo Advisory Services Market Volume Share (%), by Country 2024 & 2032
- Figure 27: North America Robo Advisory Services Market Revenue (Million), by Type of Services 2024 & 2032
- Figure 28: North America Robo Advisory Services Market Volume (K Unit), by Type of Services 2024 & 2032
- Figure 29: North America Robo Advisory Services Market Revenue Share (%), by Type of Services 2024 & 2032
- Figure 30: North America Robo Advisory Services Market Volume Share (%), by Type of Services 2024 & 2032
- Figure 31: North America Robo Advisory Services Market Revenue (Million), by Country 2024 & 2032
- Figure 32: North America Robo Advisory Services Market Volume (K Unit), by Country 2024 & 2032
- Figure 33: North America Robo Advisory Services Market Revenue Share (%), by Country 2024 & 2032
- Figure 34: North America Robo Advisory Services Market Volume Share (%), by Country 2024 & 2032
- Figure 35: Europe Robo Advisory Services Market Revenue (Million), by Type of Services 2024 & 2032
- Figure 36: Europe Robo Advisory Services Market Volume (K Unit), by Type of Services 2024 & 2032
- Figure 37: Europe Robo Advisory Services Market Revenue Share (%), by Type of Services 2024 & 2032
- Figure 38: Europe Robo Advisory Services Market Volume Share (%), by Type of Services 2024 & 2032
- Figure 39: Europe Robo Advisory Services Market Revenue (Million), by Country 2024 & 2032
- Figure 40: Europe Robo Advisory Services Market Volume (K Unit), by Country 2024 & 2032
- Figure 41: Europe Robo Advisory Services Market Revenue Share (%), by Country 2024 & 2032
- Figure 42: Europe Robo Advisory Services Market Volume Share (%), by Country 2024 & 2032
- Figure 43: Asia Pacific Robo Advisory Services Market Revenue (Million), by Type of Services 2024 & 2032
- Figure 44: Asia Pacific Robo Advisory Services Market Volume (K Unit), by Type of Services 2024 & 2032
- Figure 45: Asia Pacific Robo Advisory Services Market Revenue Share (%), by Type of Services 2024 & 2032
- Figure 46: Asia Pacific Robo Advisory Services Market Volume Share (%), by Type of Services 2024 & 2032
- Figure 47: Asia Pacific Robo Advisory Services Market Revenue (Million), by Country 2024 & 2032
- Figure 48: Asia Pacific Robo Advisory Services Market Volume (K Unit), by Country 2024 & 2032
- Figure 49: Asia Pacific Robo Advisory Services Market Revenue Share (%), by Country 2024 & 2032
- Figure 50: Asia Pacific Robo Advisory Services Market Volume Share (%), by Country 2024 & 2032
- Figure 51: Rest of the World Robo Advisory Services Market Revenue (Million), by Type of Services 2024 & 2032
- Figure 52: Rest of the World Robo Advisory Services Market Volume (K Unit), by Type of Services 2024 & 2032
- Figure 53: Rest of the World Robo Advisory Services Market Revenue Share (%), by Type of Services 2024 & 2032
- Figure 54: Rest of the World Robo Advisory Services Market Volume Share (%), by Type of Services 2024 & 2032
- Figure 55: Rest of the World Robo Advisory Services Market Revenue (Million), by Country 2024 & 2032
- Figure 56: Rest of the World Robo Advisory Services Market Volume (K Unit), by Country 2024 & 2032
- Figure 57: Rest of the World Robo Advisory Services Market Revenue Share (%), by Country 2024 & 2032
- Figure 58: Rest of the World Robo Advisory Services Market Volume Share (%), by Country 2024 & 2032
List of Tables
- Table 1: Global Robo Advisory Services Market Revenue Million Forecast, by Region 2019 & 2032
- Table 2: Global Robo Advisory Services Market Volume K Unit Forecast, by Region 2019 & 2032
- Table 3: Global Robo Advisory Services Market Revenue Million Forecast, by Type of Services 2019 & 2032
- Table 4: Global Robo Advisory Services Market Volume K Unit Forecast, by Type of Services 2019 & 2032
- Table 5: Global Robo Advisory Services Market Revenue Million Forecast, by Region 2019 & 2032
- Table 6: Global Robo Advisory Services Market Volume K Unit Forecast, by Region 2019 & 2032
- Table 7: Global Robo Advisory Services Market Revenue Million Forecast, by Country 2019 & 2032
- Table 8: Global Robo Advisory Services Market Volume K Unit Forecast, by Country 2019 & 2032
- Table 9: United States Robo Advisory Services Market Revenue (Million) Forecast, by Application 2019 & 2032
- Table 10: United States Robo Advisory Services Market Volume (K Unit) Forecast, by Application 2019 & 2032
- Table 11: Canada Robo Advisory Services Market Revenue (Million) Forecast, by Application 2019 & 2032
- Table 12: Canada Robo Advisory Services Market Volume (K Unit) Forecast, by Application 2019 & 2032
- Table 13: Mexico Robo Advisory Services Market Revenue (Million) Forecast, by Application 2019 & 2032
- Table 14: Mexico Robo Advisory Services Market Volume (K Unit) Forecast, by Application 2019 & 2032
- Table 15: Global Robo Advisory Services Market Revenue Million Forecast, by Country 2019 & 2032
- Table 16: Global Robo Advisory Services Market Volume K Unit Forecast, by Country 2019 & 2032
- Table 17: Germany Robo Advisory Services Market Revenue (Million) Forecast, by Application 2019 & 2032
- Table 18: Germany Robo Advisory Services Market Volume (K Unit) Forecast, by Application 2019 & 2032
- Table 19: United Kingdom Robo Advisory Services Market Revenue (Million) Forecast, by Application 2019 & 2032
- Table 20: United Kingdom Robo Advisory Services Market Volume (K Unit) Forecast, by Application 2019 & 2032
- Table 21: France Robo Advisory Services Market Revenue (Million) Forecast, by Application 2019 & 2032
- Table 22: France Robo Advisory Services Market Volume (K Unit) Forecast, by Application 2019 & 2032
- Table 23: Spain Robo Advisory Services Market Revenue (Million) Forecast, by Application 2019 & 2032
- Table 24: Spain Robo Advisory Services Market Volume (K Unit) Forecast, by Application 2019 & 2032
- Table 25: Italy Robo Advisory Services Market Revenue (Million) Forecast, by Application 2019 & 2032
- Table 26: Italy Robo Advisory Services Market Volume (K Unit) Forecast, by Application 2019 & 2032
- Table 27: Spain Robo Advisory Services Market Revenue (Million) Forecast, by Application 2019 & 2032
- Table 28: Spain Robo Advisory Services Market Volume (K Unit) Forecast, by Application 2019 & 2032
- Table 29: Belgium Robo Advisory Services Market Revenue (Million) Forecast, by Application 2019 & 2032
- Table 30: Belgium Robo Advisory Services Market Volume (K Unit) Forecast, by Application 2019 & 2032
- Table 31: Netherland Robo Advisory Services Market Revenue (Million) Forecast, by Application 2019 & 2032
- Table 32: Netherland Robo Advisory Services Market Volume (K Unit) Forecast, by Application 2019 & 2032
- Table 33: Nordics Robo Advisory Services Market Revenue (Million) Forecast, by Application 2019 & 2032
- Table 34: Nordics Robo Advisory Services Market Volume (K Unit) Forecast, by Application 2019 & 2032
- Table 35: Rest of Europe Robo Advisory Services Market Revenue (Million) Forecast, by Application 2019 & 2032
- Table 36: Rest of Europe Robo Advisory Services Market Volume (K Unit) Forecast, by Application 2019 & 2032
- Table 37: Global Robo Advisory Services Market Revenue Million Forecast, by Country 2019 & 2032
- Table 38: Global Robo Advisory Services Market Volume K Unit Forecast, by Country 2019 & 2032
- Table 39: China Robo Advisory Services Market Revenue (Million) Forecast, by Application 2019 & 2032
- Table 40: China Robo Advisory Services Market Volume (K Unit) Forecast, by Application 2019 & 2032
- Table 41: Japan Robo Advisory Services Market Revenue (Million) Forecast, by Application 2019 & 2032
- Table 42: Japan Robo Advisory Services Market Volume (K Unit) Forecast, by Application 2019 & 2032
- Table 43: India Robo Advisory Services Market Revenue (Million) Forecast, by Application 2019 & 2032
- Table 44: India Robo Advisory Services Market Volume (K Unit) Forecast, by Application 2019 & 2032
- Table 45: South Korea Robo Advisory Services Market Revenue (Million) Forecast, by Application 2019 & 2032
- Table 46: South Korea Robo Advisory Services Market Volume (K Unit) Forecast, by Application 2019 & 2032
- Table 47: Southeast Asia Robo Advisory Services Market Revenue (Million) Forecast, by Application 2019 & 2032
- Table 48: Southeast Asia Robo Advisory Services Market Volume (K Unit) Forecast, by Application 2019 & 2032
- Table 49: Australia Robo Advisory Services Market Revenue (Million) Forecast, by Application 2019 & 2032
- Table 50: Australia Robo Advisory Services Market Volume (K Unit) Forecast, by Application 2019 & 2032
- Table 51: Indonesia Robo Advisory Services Market Revenue (Million) Forecast, by Application 2019 & 2032
- Table 52: Indonesia Robo Advisory Services Market Volume (K Unit) Forecast, by Application 2019 & 2032
- Table 53: Phillipes Robo Advisory Services Market Revenue (Million) Forecast, by Application 2019 & 2032
- Table 54: Phillipes Robo Advisory Services Market Volume (K Unit) Forecast, by Application 2019 & 2032
- Table 55: Singapore Robo Advisory Services Market Revenue (Million) Forecast, by Application 2019 & 2032
- Table 56: Singapore Robo Advisory Services Market Volume (K Unit) Forecast, by Application 2019 & 2032
- Table 57: Thailandc Robo Advisory Services Market Revenue (Million) Forecast, by Application 2019 & 2032
- Table 58: Thailandc Robo Advisory Services Market Volume (K Unit) Forecast, by Application 2019 & 2032
- Table 59: Rest of Asia Pacific Robo Advisory Services Market Revenue (Million) Forecast, by Application 2019 & 2032
- Table 60: Rest of Asia Pacific Robo Advisory Services Market Volume (K Unit) Forecast, by Application 2019 & 2032
- Table 61: Global Robo Advisory Services Market Revenue Million Forecast, by Country 2019 & 2032
- Table 62: Global Robo Advisory Services Market Volume K Unit Forecast, by Country 2019 & 2032
- Table 63: Brazil Robo Advisory Services Market Revenue (Million) Forecast, by Application 2019 & 2032
- Table 64: Brazil Robo Advisory Services Market Volume (K Unit) Forecast, by Application 2019 & 2032
- Table 65: Argentina Robo Advisory Services Market Revenue (Million) Forecast, by Application 2019 & 2032
- Table 66: Argentina Robo Advisory Services Market Volume (K Unit) Forecast, by Application 2019 & 2032
- Table 67: Peru Robo Advisory Services Market Revenue (Million) Forecast, by Application 2019 & 2032
- Table 68: Peru Robo Advisory Services Market Volume (K Unit) Forecast, by Application 2019 & 2032
- Table 69: Chile Robo Advisory Services Market Revenue (Million) Forecast, by Application 2019 & 2032
- Table 70: Chile Robo Advisory Services Market Volume (K Unit) Forecast, by Application 2019 & 2032
- Table 71: Colombia Robo Advisory Services Market Revenue (Million) Forecast, by Application 2019 & 2032
- Table 72: Colombia Robo Advisory Services Market Volume (K Unit) Forecast, by Application 2019 & 2032
- Table 73: Ecuador Robo Advisory Services Market Revenue (Million) Forecast, by Application 2019 & 2032
- Table 74: Ecuador Robo Advisory Services Market Volume (K Unit) Forecast, by Application 2019 & 2032
- Table 75: Venezuela Robo Advisory Services Market Revenue (Million) Forecast, by Application 2019 & 2032
- Table 76: Venezuela Robo Advisory Services Market Volume (K Unit) Forecast, by Application 2019 & 2032
- Table 77: Rest of South America Robo Advisory Services Market Revenue (Million) Forecast, by Application 2019 & 2032
- Table 78: Rest of South America Robo Advisory Services Market Volume (K Unit) Forecast, by Application 2019 & 2032
- Table 79: Global Robo Advisory Services Market Revenue Million Forecast, by Country 2019 & 2032
- Table 80: Global Robo Advisory Services Market Volume K Unit Forecast, by Country 2019 & 2032
- Table 81: United States Robo Advisory Services Market Revenue (Million) Forecast, by Application 2019 & 2032
- Table 82: United States Robo Advisory Services Market Volume (K Unit) Forecast, by Application 2019 & 2032
- Table 83: Canada Robo Advisory Services Market Revenue (Million) Forecast, by Application 2019 & 2032
- Table 84: Canada Robo Advisory Services Market Volume (K Unit) Forecast, by Application 2019 & 2032
- Table 85: Mexico Robo Advisory Services Market Revenue (Million) Forecast, by Application 2019 & 2032
- Table 86: Mexico Robo Advisory Services Market Volume (K Unit) Forecast, by Application 2019 & 2032
- Table 87: Global Robo Advisory Services Market Revenue Million Forecast, by Country 2019 & 2032
- Table 88: Global Robo Advisory Services Market Volume K Unit Forecast, by Country 2019 & 2032
- Table 89: United Arab Emirates Robo Advisory Services Market Revenue (Million) Forecast, by Application 2019 & 2032
- Table 90: United Arab Emirates Robo Advisory Services Market Volume (K Unit) Forecast, by Application 2019 & 2032
- Table 91: Saudi Arabia Robo Advisory Services Market Revenue (Million) Forecast, by Application 2019 & 2032
- Table 92: Saudi Arabia Robo Advisory Services Market Volume (K Unit) Forecast, by Application 2019 & 2032
- Table 93: South Africa Robo Advisory Services Market Revenue (Million) Forecast, by Application 2019 & 2032
- Table 94: South Africa Robo Advisory Services Market Volume (K Unit) Forecast, by Application 2019 & 2032
- Table 95: Rest of Middle East and Africa Robo Advisory Services Market Revenue (Million) Forecast, by Application 2019 & 2032
- Table 96: Rest of Middle East and Africa Robo Advisory Services Market Volume (K Unit) Forecast, by Application 2019 & 2032
- Table 97: Global Robo Advisory Services Market Revenue Million Forecast, by Type of Services 2019 & 2032
- Table 98: Global Robo Advisory Services Market Volume K Unit Forecast, by Type of Services 2019 & 2032
- Table 99: Global Robo Advisory Services Market Revenue Million Forecast, by Country 2019 & 2032
- Table 100: Global Robo Advisory Services Market Volume K Unit Forecast, by Country 2019 & 2032
- Table 101: Global Robo Advisory Services Market Revenue Million Forecast, by Type of Services 2019 & 2032
- Table 102: Global Robo Advisory Services Market Volume K Unit Forecast, by Type of Services 2019 & 2032
- Table 103: Global Robo Advisory Services Market Revenue Million Forecast, by Country 2019 & 2032
- Table 104: Global Robo Advisory Services Market Volume K Unit Forecast, by Country 2019 & 2032
- Table 105: Global Robo Advisory Services Market Revenue Million Forecast, by Type of Services 2019 & 2032
- Table 106: Global Robo Advisory Services Market Volume K Unit Forecast, by Type of Services 2019 & 2032
- Table 107: Global Robo Advisory Services Market Revenue Million Forecast, by Country 2019 & 2032
- Table 108: Global Robo Advisory Services Market Volume K Unit Forecast, by Country 2019 & 2032
- Table 109: Global Robo Advisory Services Market Revenue Million Forecast, by Type of Services 2019 & 2032
- Table 110: Global Robo Advisory Services Market Volume K Unit Forecast, by Type of Services 2019 & 2032
- Table 111: Global Robo Advisory Services Market Revenue Million Forecast, by Country 2019 & 2032
- Table 112: Global Robo Advisory Services Market Volume K Unit Forecast, by Country 2019 & 2032
Frequently Asked Questions
1. What is the projected Compound Annual Growth Rate (CAGR) of the Robo Advisory Services Market?
The projected CAGR is approximately 31.78%.
2. Which companies are prominent players in the Robo Advisory Services Market?
Key companies in the market include BlackRock Inc (FutureAdvisor), Charles Schwab & Co Inc, M1 Holdings Inc , The Vanguard Group Inc, Roboadviso, FMR LLC (Fidelity Go), Betterment LLC, Wealthfront Corporation.
3. What are the main segments of the Robo Advisory Services Market?
The market segments include Type of Services.
4. Can you provide details about the market size?
The market size is estimated to be USD 11.52 Million as of 2022.
5. What are some drivers contributing to market growth?
Digitization of the BFSI Industry; Cost-efficiency in Managing Personal Finance.
6. What are the notable trends driving market growth?
Investment Advisory Expected to Gain Maximum Traction.
7. Are there any restraints impacting market growth?
Lack of Human Expertise and Empathy; Nascency of the Technology.
8. Can you provide examples of recent developments in the market?
Januray 2024 - Betterment announces the first commercial product that allows small business employers to automatically match employee student loan payments with a 401(k) contribution, Employees with access to Betterment's 401(k) can record qualified loan payments within the platform. Employers can then match these payments with a contribution to the employee's 401(k), enabling borrowers to pay down loans while continuing to proactively save for retirement.
9. What pricing options are available for accessing the report?
Pricing options include single-user, multi-user, and enterprise licenses priced at USD 4750, USD 5250, and USD 8750 respectively.
10. Is the market size provided in terms of value or volume?
The market size is provided in terms of value, measured in Million and volume, measured in K Unit.
11. Are there any specific market keywords associated with the report?
Yes, the market keyword associated with the report is "Robo Advisory Services Market," which aids in identifying and referencing the specific market segment covered.
12. How do I determine which pricing option suits my needs best?
The pricing options vary based on user requirements and access needs. Individual users may opt for single-user licenses, while businesses requiring broader access may choose multi-user or enterprise licenses for cost-effective access to the report.
13. Are there any additional resources or data provided in the Robo Advisory Services Market report?
While the report offers comprehensive insights, it's advisable to review the specific contents or supplementary materials provided to ascertain if additional resources or data are available.
14. How can I stay updated on further developments or reports in the Robo Advisory Services Market?
To stay informed about further developments, trends, and reports in the Robo Advisory Services Market, consider subscribing to industry newsletters, following relevant companies and organizations, or regularly checking reputable industry news sources and publications.
Methodology
Step 1 - Identification of Relevant Samples Size from Population Database


Step 2 - Approaches for Defining Global Market Size (Value, Volume* & Price*)

Note*: In applicable scenarios
Step 3 - Data Sources
Primary Research
- Web Analytics
- Survey Reports
- Research Institute
- Latest Research Reports
- Opinion Leaders
Secondary Research
- Annual Reports
- White Paper
- Latest Press Release
- Industry Association
- Paid Database
- Investor Presentations

Step 4 - Data Triangulation
Involves using different sources of information in order to increase the validity of a study
These sources are likely to be stakeholders in a program - participants, other researchers, program staff, other community members, and so on.
Then we put all data in single framework & apply various statistical tools to find out the dynamic on the market.
During the analysis stage, feedback from the stakeholder groups would be compared to determine areas of agreement as well as areas of divergence


