
Key Insights
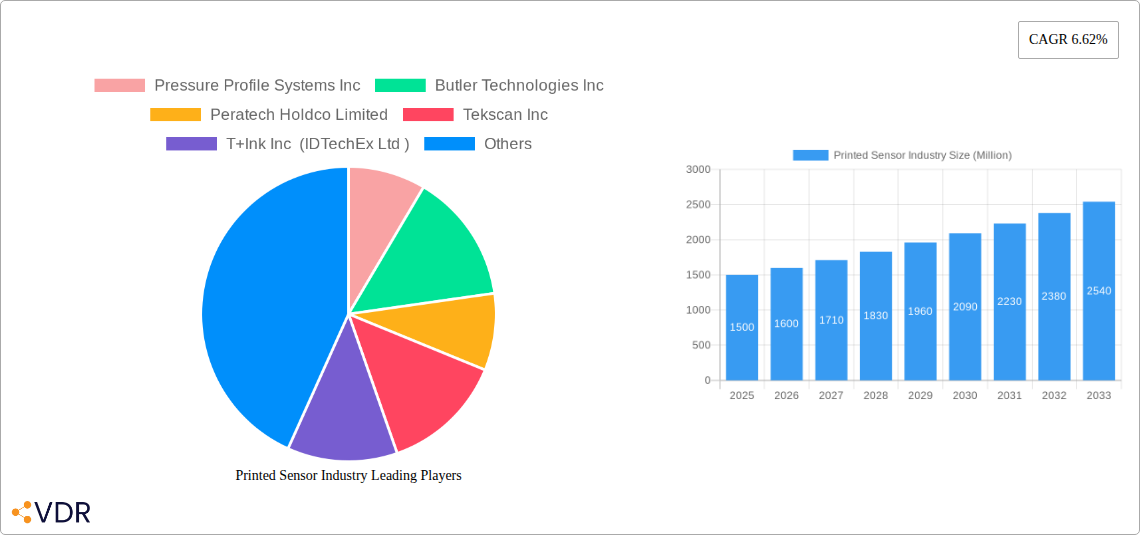
The printed sensor market is experiencing robust growth, projected to reach a substantial size by 2033, driven by a compound annual growth rate (CAGR) of 6.62%. This expansion is fueled by several key factors. The increasing demand for miniaturization and flexible electronics across diverse sectors like consumer electronics (wearables, smart packaging), healthcare (diagnostic tools, wearable health monitors), and automotive (advanced driver-assistance systems, in-cabin sensing) is a major catalyst. Furthermore, the inherent cost-effectiveness and scalability of printed sensor technology, compared to traditional manufacturing methods, are making it an attractive alternative for a wide range of applications. Technological advancements, including the development of novel materials and improved printing processes, are further enhancing performance characteristics like sensitivity and durability, expanding the market's potential. The market is segmented by end-user industry, with consumer electronics and healthcare currently leading the charge, but automotive and industrial applications are showing significant growth potential as adoption increases. While challenges such as maintaining consistent quality and addressing long-term reliability concerns remain, ongoing research and development efforts are continuously addressing these hurdles. Geographic growth is expected to be widespread, with North America and Europe maintaining a significant market share due to early adoption and established technological infrastructure, while the Asia-Pacific region is poised for rapid expansion driven by increasing manufacturing and consumer demand.
The competitive landscape is characterized by a mix of established players and emerging innovators. Companies like Pressure Profile Systems, Tekscan, and Renesas Electronics are leveraging their expertise in sensor technology and manufacturing to capture a significant market share. However, smaller, more agile companies focusing on niche applications and innovative printing techniques are also emerging as key players, contributing to a dynamic and competitive environment. The market's future success hinges on continued innovation in materials science, printing processes, and application-specific designs. Focusing on addressing the remaining technical limitations, and expanding the reach into new applications and markets will be crucial for achieving the projected growth trajectory. Government regulations and industry standards will also play a significant role in shaping the adoption of printed sensors and ensuring their safe and effective integration into various applications.
Printed Sensor Industry Market Report: 2019-2033
A comprehensive analysis of the printed sensor market, encompassing market dynamics, growth trends, regional dominance, product landscape, challenges, opportunities, and key players. This report provides an in-depth examination of the printed sensor market, offering valuable insights for industry professionals, investors, and strategic decision-makers. The study period covers 2019-2033, with a base year of 2025 and a forecast period of 2025-2033. The historical period analyzed is 2019-2024. The market is segmented by end-user industry: Consumer Electronics, Healthcare, Industrial, Automotive and Transportation, and Other End-user Industries. The market size is presented in Million units.
Printed Sensor Industry Market Dynamics & Structure
The printed sensor market is characterized by a moderately fragmented landscape with several key players vying for market share. Market concentration is expected to increase slightly by 2033 due to mergers and acquisitions (M&A) activity and the consolidation of smaller players. Technological innovation, particularly in materials science and printing techniques, serves as a major driver of growth. Stringent regulatory frameworks related to safety and performance standards are shaping product development and market access. While competitive substitutes exist (e.g., traditional sensors), printed sensors offer advantages in cost, flexibility, and scalability, driving their adoption. End-user demographics are shifting towards increased demand from consumer electronics and the automotive sector.
- Market Concentration: Moderately fragmented, expected to consolidate by 2033. Market leader holds approximately xx% market share in 2025.
- M&A Activity: xx deals recorded between 2019-2024, with an anticipated increase in the forecast period.
- Technological Innovation: Focus on materials like graphene and flexible substrates is driving miniaturization and performance enhancement.
- Regulatory Framework: Compliance with safety and performance standards (e.g., ISO, IEC) is crucial for market entry.
- Competitive Substitutes: Traditional sensors pose competition, but printed sensors offer cost and flexibility advantages.
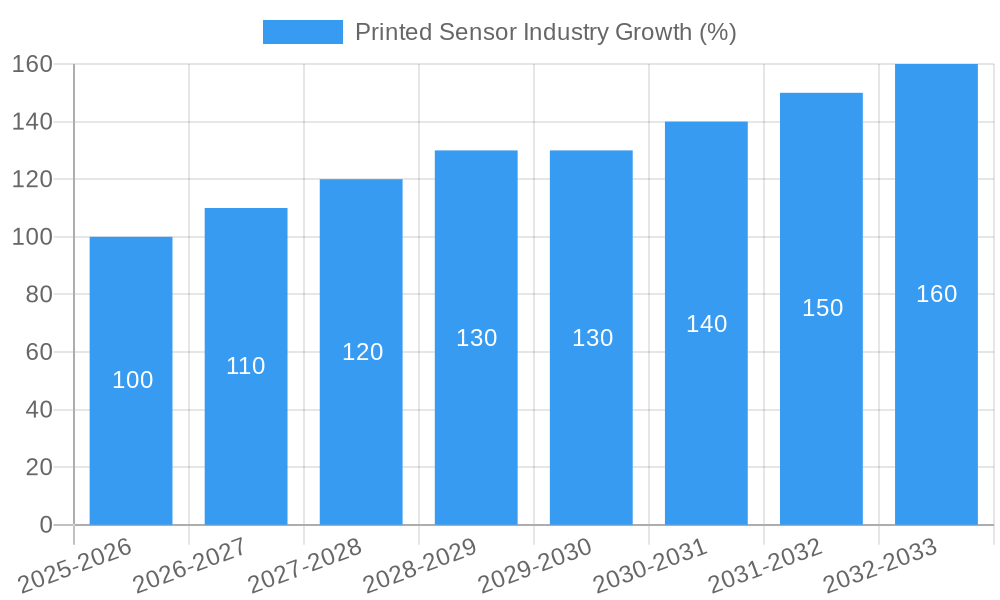
Printed Sensor Industry Growth Trends & Insights
The printed sensor market has experienced significant growth in recent years, driven by increasing demand across various end-user industries. The market size reached xx million units in 2024 and is projected to reach xx million units by 2033, exhibiting a CAGR of xx% during the forecast period. This growth is fueled by the rising adoption of printed sensors in consumer electronics (wearables, smart packaging), healthcare (biosensors, diagnostic tools), and automotive applications (advanced driver-assistance systems). Technological disruptions, such as the development of low-cost, high-performance materials, are further accelerating market expansion. Consumer behavior is shifting towards the demand for smaller, more integrated, and energy-efficient devices, aligning perfectly with the advantages of printed sensors.
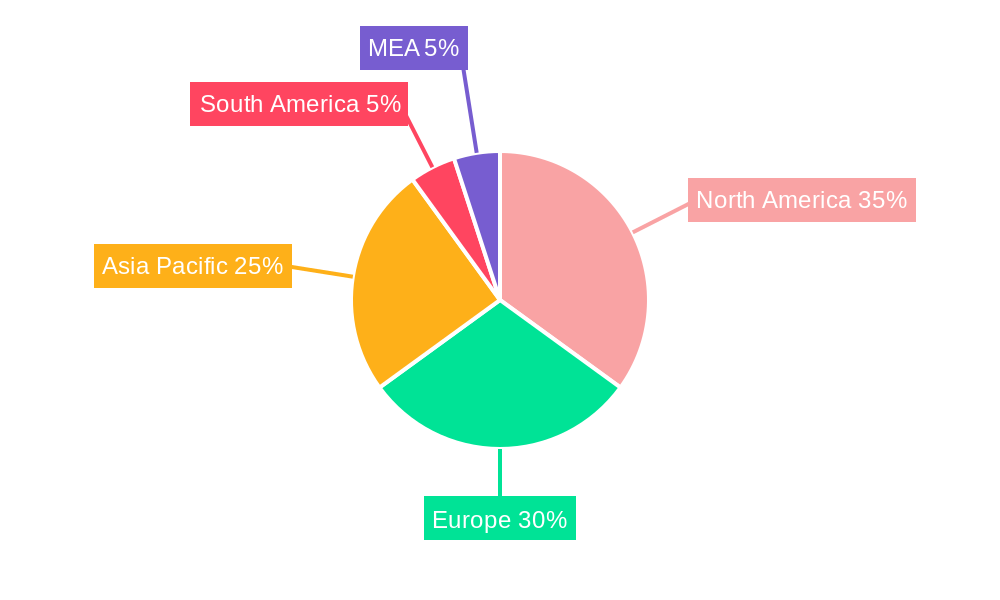
Dominant Regions, Countries, or Segments in Printed Sensor Industry
North America currently holds the largest market share in the printed sensor industry, followed by Europe and Asia-Pacific. Within these regions, specific countries like the USA, Germany, and Japan are leading the market due to strong technological advancements, robust research & development activities, and high adoption rates in key industries. The consumer electronics segment is the dominant end-user industry driving market growth due to the integration of printed sensors in wearables and other smart devices. The automotive and transportation sector is also experiencing rapid growth due to the increasing use of printed sensors in advanced driver-assistance systems and other automotive applications.
- Key Drivers:
- North America: Strong R&D, high consumer electronics adoption.
- Europe: Government support for technological innovations, strong automotive industry.
- Asia-Pacific: Growing manufacturing base, cost-effective production.
- Consumer Electronics: High demand for wearable technology and smart devices.
- Automotive & Transportation: Increased adoption of ADAS and other sensor-based systems.
Printed Sensor Industry Product Landscape
Printed sensors offer a wide range of functionalities, including pressure, temperature, humidity, and gas sensing. Recent innovations have focused on enhancing sensor sensitivity, improving stability, and reducing production costs. Unique selling propositions include flexibility, scalability, and cost-effectiveness compared to traditional sensors. Advancements in materials science and printing technologies are constantly driving performance improvements, enabling the development of more sophisticated and versatile printed sensors.
Key Drivers, Barriers & Challenges in Printed Sensor Industry
Key Drivers:
- Increasing demand from consumer electronics and automotive sectors.
- Advancements in materials science and printing technologies.
- Cost-effectiveness and scalability compared to traditional sensors.
Key Challenges:
- Maintaining sensor stability and reliability over extended periods.
- Ensuring consistent quality across large-scale production runs.
- Addressing supply chain vulnerabilities related to specific materials. (Estimated impact: xx% reduction in production capacity in 2024).
Emerging Opportunities in Printed Sensor Industry
- Expansion into new applications such as environmental monitoring and smart agriculture.
- Development of integrated sensor systems for smart homes and industrial IoT.
- Customization of sensors for specific end-user needs and applications.
Growth Accelerators in the Printed Sensor Industry
Technological breakthroughs in flexible electronics and materials science will play a crucial role in accelerating market growth. Strategic partnerships between sensor manufacturers and end-user industries will facilitate innovation and adoption. Expansion into emerging markets, particularly in developing economies, will significantly broaden market reach.
Key Players Shaping the Printed Sensor Industry Market
- Pressure Profile Systems Inc
- Butler Technologies Inc
- Peratech Holdco Limited
- Tekscan Inc
- T+Ink Inc (IDTechEx Ltd)
- Renesas Electronics Corporation
- KWJ Engineering inc (SPEC Sensors LLC)
- FlexEnable Limited
- Thin Film Electronics ASA
- Plastic Logic HK Ltd
- Canatu Oy
- ISORG SA
Notable Milestones in Printed Sensor Industry Sector
- 2020: Introduction of a new generation of flexible pressure sensors by Peratech.
- 2022: Strategic partnership between Tekscan and a major automotive manufacturer for ADAS development.
- 2023: Successful integration of printed sensors in a mass-produced wearable device by a leading consumer electronics company.
In-Depth Printed Sensor Industry Market Outlook
The printed sensor market is poised for significant growth in the coming years. Continuous technological advancements, increasing demand from diverse end-user industries, and the expansion into emerging markets will drive this growth. Strategic partnerships, acquisitions, and the development of innovative applications will further fuel market expansion, creating lucrative opportunities for industry players. The market is expected to reach xx million units by 2033, underscoring its substantial potential for future growth.
Printed Sensor Industry Segmentation
-
1. End-User Industry
- 1.1. Consumer Electronics
- 1.2. Healthcare
- 1.3. Industrial
- 1.4. Automotive and Transportation
- 1.5. Other End-user Industries
Printed Sensor Industry Segmentation By Geography
- 1. North America
- 2. Europe
- 3. Asia Pacific
- 4. Rest of the World
Printed Sensor Industry REPORT HIGHLIGHTS
| Aspects | Details |
|---|---|
| Study Period | 2019-2033 |
| Base Year | 2024 |
| Estimated Year | 2025 |
| Forecast Period | 2025-2033 |
| Historical Period | 2019-2024 |
| Growth Rate | CAGR of 6.62% from 2019-2033 |
| Segmentation |
|
Table of Contents
- 1. Introduction
- 1.1. Research Scope
- 1.2. Market Segmentation
- 1.3. Research Methodology
- 1.4. Definitions and Assumptions
- 2. Executive Summary
- 2.1. Introduction
- 3. Market Dynamics
- 3.1. Introduction
- 3.2. Market Drivers
- 3.2.1. ; Use of Integrated Dashboards in Advanced Driver Assistance System (ADAS) in Automotive Sector; Increasing Usage of CMOS Sensors in Consumer Electronics Products
- 3.3. Market Restrains
- 3.3.1. ; Complex Manufacturing Process
- 3.4. Market Trends
- 3.4.1. Consumer Electronics is Expected to Hold Major Market Share
- 4. Market Factor Analysis
- 4.1. Porters Five Forces
- 4.2. Supply/Value Chain
- 4.3. PESTEL analysis
- 4.4. Market Entropy
- 4.5. Patent/Trademark Analysis
- 5. Global Printed Sensor Industry Analysis, Insights and Forecast, 2019-2031
- 5.1. Market Analysis, Insights and Forecast - by End-User Industry
- 5.1.1. Consumer Electronics
- 5.1.2. Healthcare
- 5.1.3. Industrial
- 5.1.4. Automotive and Transportation
- 5.1.5. Other End-user Industries
- 5.2. Market Analysis, Insights and Forecast - by Region
- 5.2.1. North America
- 5.2.2. Europe
- 5.2.3. Asia Pacific
- 5.2.4. Rest of the World
- 5.1. Market Analysis, Insights and Forecast - by End-User Industry
- 6. North America Printed Sensor Industry Analysis, Insights and Forecast, 2019-2031
- 6.1. Market Analysis, Insights and Forecast - by End-User Industry
- 6.1.1. Consumer Electronics
- 6.1.2. Healthcare
- 6.1.3. Industrial
- 6.1.4. Automotive and Transportation
- 6.1.5. Other End-user Industries
- 6.1. Market Analysis, Insights and Forecast - by End-User Industry
- 7. Europe Printed Sensor Industry Analysis, Insights and Forecast, 2019-2031
- 7.1. Market Analysis, Insights and Forecast - by End-User Industry
- 7.1.1. Consumer Electronics
- 7.1.2. Healthcare
- 7.1.3. Industrial
- 7.1.4. Automotive and Transportation
- 7.1.5. Other End-user Industries
- 7.1. Market Analysis, Insights and Forecast - by End-User Industry
- 8. Asia Pacific Printed Sensor Industry Analysis, Insights and Forecast, 2019-2031
- 8.1. Market Analysis, Insights and Forecast - by End-User Industry
- 8.1.1. Consumer Electronics
- 8.1.2. Healthcare
- 8.1.3. Industrial
- 8.1.4. Automotive and Transportation
- 8.1.5. Other End-user Industries
- 8.1. Market Analysis, Insights and Forecast - by End-User Industry
- 9. Rest of the World Printed Sensor Industry Analysis, Insights and Forecast, 2019-2031
- 9.1. Market Analysis, Insights and Forecast - by End-User Industry
- 9.1.1. Consumer Electronics
- 9.1.2. Healthcare
- 9.1.3. Industrial
- 9.1.4. Automotive and Transportation
- 9.1.5. Other End-user Industries
- 9.1. Market Analysis, Insights and Forecast - by End-User Industry
- 10. North America Printed Sensor Industry Analysis, Insights and Forecast, 2019-2031
- 10.1. Market Analysis, Insights and Forecast - By Country/Sub-region
- 10.1.1 United States
- 10.1.2 Canada
- 10.1.3 Mexico
- 11. Europe Printed Sensor Industry Analysis, Insights and Forecast, 2019-2031
- 11.1. Market Analysis, Insights and Forecast - By Country/Sub-region
- 11.1.1 Germany
- 11.1.2 United Kingdom
- 11.1.3 France
- 11.1.4 Spain
- 11.1.5 Italy
- 11.1.6 Spain
- 11.1.7 Belgium
- 11.1.8 Netherland
- 11.1.9 Nordics
- 11.1.10 Rest of Europe
- 12. Asia Pacific Printed Sensor Industry Analysis, Insights and Forecast, 2019-2031
- 12.1. Market Analysis, Insights and Forecast - By Country/Sub-region
- 12.1.1 China
- 12.1.2 Japan
- 12.1.3 India
- 12.1.4 South Korea
- 12.1.5 Southeast Asia
- 12.1.6 Australia
- 12.1.7 Indonesia
- 12.1.8 Phillipes
- 12.1.9 Singapore
- 12.1.10 Thailandc
- 12.1.11 Rest of Asia Pacific
- 13. South America Printed Sensor Industry Analysis, Insights and Forecast, 2019-2031
- 13.1. Market Analysis, Insights and Forecast - By Country/Sub-region
- 13.1.1 Brazil
- 13.1.2 Argentina
- 13.1.3 Peru
- 13.1.4 Chile
- 13.1.5 Colombia
- 13.1.6 Ecuador
- 13.1.7 Venezuela
- 13.1.8 Rest of South America
- 14. North America Printed Sensor Industry Analysis, Insights and Forecast, 2019-2031
- 14.1. Market Analysis, Insights and Forecast - By Country/Sub-region
- 14.1.1 United States
- 14.1.2 Canada
- 14.1.3 Mexico
- 15. MEA Printed Sensor Industry Analysis, Insights and Forecast, 2019-2031
- 15.1. Market Analysis, Insights and Forecast - By Country/Sub-region
- 15.1.1 United Arab Emirates
- 15.1.2 Saudi Arabia
- 15.1.3 South Africa
- 15.1.4 Rest of Middle East and Africa
- 16. Competitive Analysis
- 16.1. Global Market Share Analysis 2024
- 16.2. Company Profiles
- 16.2.1 Pressure Profile Systems Inc
- 16.2.1.1. Overview
- 16.2.1.2. Products
- 16.2.1.3. SWOT Analysis
- 16.2.1.4. Recent Developments
- 16.2.1.5. Financials (Based on Availability)
- 16.2.2 Butler Technologies Inc
- 16.2.2.1. Overview
- 16.2.2.2. Products
- 16.2.2.3. SWOT Analysis
- 16.2.2.4. Recent Developments
- 16.2.2.5. Financials (Based on Availability)
- 16.2.3 Peratech Holdco Limited
- 16.2.3.1. Overview
- 16.2.3.2. Products
- 16.2.3.3. SWOT Analysis
- 16.2.3.4. Recent Developments
- 16.2.3.5. Financials (Based on Availability)
- 16.2.4 Tekscan Inc
- 16.2.4.1. Overview
- 16.2.4.2. Products
- 16.2.4.3. SWOT Analysis
- 16.2.4.4. Recent Developments
- 16.2.4.5. Financials (Based on Availability)
- 16.2.5 T+Ink Inc (IDTechEx Ltd )
- 16.2.5.1. Overview
- 16.2.5.2. Products
- 16.2.5.3. SWOT Analysis
- 16.2.5.4. Recent Developments
- 16.2.5.5. Financials (Based on Availability)
- 16.2.6 Renesas Electronics Corporation
- 16.2.6.1. Overview
- 16.2.6.2. Products
- 16.2.6.3. SWOT Analysis
- 16.2.6.4. Recent Developments
- 16.2.6.5. Financials (Based on Availability)
- 16.2.7 KWJ Engineering inc (SPEC Sensors LLC)
- 16.2.7.1. Overview
- 16.2.7.2. Products
- 16.2.7.3. SWOT Analysis
- 16.2.7.4. Recent Developments
- 16.2.7.5. Financials (Based on Availability)
- 16.2.8 FlexEnable Limited
- 16.2.8.1. Overview
- 16.2.8.2. Products
- 16.2.8.3. SWOT Analysis
- 16.2.8.4. Recent Developments
- 16.2.8.5. Financials (Based on Availability)
- 16.2.9 Thin Film Electronics ASA
- 16.2.9.1. Overview
- 16.2.9.2. Products
- 16.2.9.3. SWOT Analysis
- 16.2.9.4. Recent Developments
- 16.2.9.5. Financials (Based on Availability)
- 16.2.10 Plastic Logic HK Ltd
- 16.2.10.1. Overview
- 16.2.10.2. Products
- 16.2.10.3. SWOT Analysis
- 16.2.10.4. Recent Developments
- 16.2.10.5. Financials (Based on Availability)
- 16.2.11 Canatu Oy
- 16.2.11.1. Overview
- 16.2.11.2. Products
- 16.2.11.3. SWOT Analysis
- 16.2.11.4. Recent Developments
- 16.2.11.5. Financials (Based on Availability)
- 16.2.12 ISORG SA
- 16.2.12.1. Overview
- 16.2.12.2. Products
- 16.2.12.3. SWOT Analysis
- 16.2.12.4. Recent Developments
- 16.2.12.5. Financials (Based on Availability)
- 16.2.1 Pressure Profile Systems Inc
List of Figures
- Figure 1: Global Printed Sensor Industry Revenue Breakdown (Million, %) by Region 2024 & 2032
- Figure 2: Global Printed Sensor Industry Volume Breakdown (K Unit, %) by Region 2024 & 2032
- Figure 3: North America Printed Sensor Industry Revenue (Million), by Country 2024 & 2032
- Figure 4: North America Printed Sensor Industry Volume (K Unit), by Country 2024 & 2032
- Figure 5: North America Printed Sensor Industry Revenue Share (%), by Country 2024 & 2032
- Figure 6: North America Printed Sensor Industry Volume Share (%), by Country 2024 & 2032
- Figure 7: Europe Printed Sensor Industry Revenue (Million), by Country 2024 & 2032
- Figure 8: Europe Printed Sensor Industry Volume (K Unit), by Country 2024 & 2032
- Figure 9: Europe Printed Sensor Industry Revenue Share (%), by Country 2024 & 2032
- Figure 10: Europe Printed Sensor Industry Volume Share (%), by Country 2024 & 2032
- Figure 11: Asia Pacific Printed Sensor Industry Revenue (Million), by Country 2024 & 2032
- Figure 12: Asia Pacific Printed Sensor Industry Volume (K Unit), by Country 2024 & 2032
- Figure 13: Asia Pacific Printed Sensor Industry Revenue Share (%), by Country 2024 & 2032
- Figure 14: Asia Pacific Printed Sensor Industry Volume Share (%), by Country 2024 & 2032
- Figure 15: South America Printed Sensor Industry Revenue (Million), by Country 2024 & 2032
- Figure 16: South America Printed Sensor Industry Volume (K Unit), by Country 2024 & 2032
- Figure 17: South America Printed Sensor Industry Revenue Share (%), by Country 2024 & 2032
- Figure 18: South America Printed Sensor Industry Volume Share (%), by Country 2024 & 2032
- Figure 19: North America Printed Sensor Industry Revenue (Million), by Country 2024 & 2032
- Figure 20: North America Printed Sensor Industry Volume (K Unit), by Country 2024 & 2032
- Figure 21: North America Printed Sensor Industry Revenue Share (%), by Country 2024 & 2032
- Figure 22: North America Printed Sensor Industry Volume Share (%), by Country 2024 & 2032
- Figure 23: MEA Printed Sensor Industry Revenue (Million), by Country 2024 & 2032
- Figure 24: MEA Printed Sensor Industry Volume (K Unit), by Country 2024 & 2032
- Figure 25: MEA Printed Sensor Industry Revenue Share (%), by Country 2024 & 2032
- Figure 26: MEA Printed Sensor Industry Volume Share (%), by Country 2024 & 2032
- Figure 27: North America Printed Sensor Industry Revenue (Million), by End-User Industry 2024 & 2032
- Figure 28: North America Printed Sensor Industry Volume (K Unit), by End-User Industry 2024 & 2032
- Figure 29: North America Printed Sensor Industry Revenue Share (%), by End-User Industry 2024 & 2032
- Figure 30: North America Printed Sensor Industry Volume Share (%), by End-User Industry 2024 & 2032
- Figure 31: North America Printed Sensor Industry Revenue (Million), by Country 2024 & 2032
- Figure 32: North America Printed Sensor Industry Volume (K Unit), by Country 2024 & 2032
- Figure 33: North America Printed Sensor Industry Revenue Share (%), by Country 2024 & 2032
- Figure 34: North America Printed Sensor Industry Volume Share (%), by Country 2024 & 2032
- Figure 35: Europe Printed Sensor Industry Revenue (Million), by End-User Industry 2024 & 2032
- Figure 36: Europe Printed Sensor Industry Volume (K Unit), by End-User Industry 2024 & 2032
- Figure 37: Europe Printed Sensor Industry Revenue Share (%), by End-User Industry 2024 & 2032
- Figure 38: Europe Printed Sensor Industry Volume Share (%), by End-User Industry 2024 & 2032
- Figure 39: Europe Printed Sensor Industry Revenue (Million), by Country 2024 & 2032
- Figure 40: Europe Printed Sensor Industry Volume (K Unit), by Country 2024 & 2032
- Figure 41: Europe Printed Sensor Industry Revenue Share (%), by Country 2024 & 2032
- Figure 42: Europe Printed Sensor Industry Volume Share (%), by Country 2024 & 2032
- Figure 43: Asia Pacific Printed Sensor Industry Revenue (Million), by End-User Industry 2024 & 2032
- Figure 44: Asia Pacific Printed Sensor Industry Volume (K Unit), by End-User Industry 2024 & 2032
- Figure 45: Asia Pacific Printed Sensor Industry Revenue Share (%), by End-User Industry 2024 & 2032
- Figure 46: Asia Pacific Printed Sensor Industry Volume Share (%), by End-User Industry 2024 & 2032
- Figure 47: Asia Pacific Printed Sensor Industry Revenue (Million), by Country 2024 & 2032
- Figure 48: Asia Pacific Printed Sensor Industry Volume (K Unit), by Country 2024 & 2032
- Figure 49: Asia Pacific Printed Sensor Industry Revenue Share (%), by Country 2024 & 2032
- Figure 50: Asia Pacific Printed Sensor Industry Volume Share (%), by Country 2024 & 2032
- Figure 51: Rest of the World Printed Sensor Industry Revenue (Million), by End-User Industry 2024 & 2032
- Figure 52: Rest of the World Printed Sensor Industry Volume (K Unit), by End-User Industry 2024 & 2032
- Figure 53: Rest of the World Printed Sensor Industry Revenue Share (%), by End-User Industry 2024 & 2032
- Figure 54: Rest of the World Printed Sensor Industry Volume Share (%), by End-User Industry 2024 & 2032
- Figure 55: Rest of the World Printed Sensor Industry Revenue (Million), by Country 2024 & 2032
- Figure 56: Rest of the World Printed Sensor Industry Volume (K Unit), by Country 2024 & 2032
- Figure 57: Rest of the World Printed Sensor Industry Revenue Share (%), by Country 2024 & 2032
- Figure 58: Rest of the World Printed Sensor Industry Volume Share (%), by Country 2024 & 2032
List of Tables
- Table 1: Global Printed Sensor Industry Revenue Million Forecast, by Region 2019 & 2032
- Table 2: Global Printed Sensor Industry Volume K Unit Forecast, by Region 2019 & 2032
- Table 3: Global Printed Sensor Industry Revenue Million Forecast, by End-User Industry 2019 & 2032
- Table 4: Global Printed Sensor Industry Volume K Unit Forecast, by End-User Industry 2019 & 2032
- Table 5: Global Printed Sensor Industry Revenue Million Forecast, by Region 2019 & 2032
- Table 6: Global Printed Sensor Industry Volume K Unit Forecast, by Region 2019 & 2032
- Table 7: Global Printed Sensor Industry Revenue Million Forecast, by Country 2019 & 2032
- Table 8: Global Printed Sensor Industry Volume K Unit Forecast, by Country 2019 & 2032
- Table 9: United States Printed Sensor Industry Revenue (Million) Forecast, by Application 2019 & 2032
- Table 10: United States Printed Sensor Industry Volume (K Unit) Forecast, by Application 2019 & 2032
- Table 11: Canada Printed Sensor Industry Revenue (Million) Forecast, by Application 2019 & 2032
- Table 12: Canada Printed Sensor Industry Volume (K Unit) Forecast, by Application 2019 & 2032
- Table 13: Mexico Printed Sensor Industry Revenue (Million) Forecast, by Application 2019 & 2032
- Table 14: Mexico Printed Sensor Industry Volume (K Unit) Forecast, by Application 2019 & 2032
- Table 15: Global Printed Sensor Industry Revenue Million Forecast, by Country 2019 & 2032
- Table 16: Global Printed Sensor Industry Volume K Unit Forecast, by Country 2019 & 2032
- Table 17: Germany Printed Sensor Industry Revenue (Million) Forecast, by Application 2019 & 2032
- Table 18: Germany Printed Sensor Industry Volume (K Unit) Forecast, by Application 2019 & 2032
- Table 19: United Kingdom Printed Sensor Industry Revenue (Million) Forecast, by Application 2019 & 2032
- Table 20: United Kingdom Printed Sensor Industry Volume (K Unit) Forecast, by Application 2019 & 2032
- Table 21: France Printed Sensor Industry Revenue (Million) Forecast, by Application 2019 & 2032
- Table 22: France Printed Sensor Industry Volume (K Unit) Forecast, by Application 2019 & 2032
- Table 23: Spain Printed Sensor Industry Revenue (Million) Forecast, by Application 2019 & 2032
- Table 24: Spain Printed Sensor Industry Volume (K Unit) Forecast, by Application 2019 & 2032
- Table 25: Italy Printed Sensor Industry Revenue (Million) Forecast, by Application 2019 & 2032
- Table 26: Italy Printed Sensor Industry Volume (K Unit) Forecast, by Application 2019 & 2032
- Table 27: Spain Printed Sensor Industry Revenue (Million) Forecast, by Application 2019 & 2032
- Table 28: Spain Printed Sensor Industry Volume (K Unit) Forecast, by Application 2019 & 2032
- Table 29: Belgium Printed Sensor Industry Revenue (Million) Forecast, by Application 2019 & 2032
- Table 30: Belgium Printed Sensor Industry Volume (K Unit) Forecast, by Application 2019 & 2032
- Table 31: Netherland Printed Sensor Industry Revenue (Million) Forecast, by Application 2019 & 2032
- Table 32: Netherland Printed Sensor Industry Volume (K Unit) Forecast, by Application 2019 & 2032
- Table 33: Nordics Printed Sensor Industry Revenue (Million) Forecast, by Application 2019 & 2032
- Table 34: Nordics Printed Sensor Industry Volume (K Unit) Forecast, by Application 2019 & 2032
- Table 35: Rest of Europe Printed Sensor Industry Revenue (Million) Forecast, by Application 2019 & 2032
- Table 36: Rest of Europe Printed Sensor Industry Volume (K Unit) Forecast, by Application 2019 & 2032
- Table 37: Global Printed Sensor Industry Revenue Million Forecast, by Country 2019 & 2032
- Table 38: Global Printed Sensor Industry Volume K Unit Forecast, by Country 2019 & 2032
- Table 39: China Printed Sensor Industry Revenue (Million) Forecast, by Application 2019 & 2032
- Table 40: China Printed Sensor Industry Volume (K Unit) Forecast, by Application 2019 & 2032
- Table 41: Japan Printed Sensor Industry Revenue (Million) Forecast, by Application 2019 & 2032
- Table 42: Japan Printed Sensor Industry Volume (K Unit) Forecast, by Application 2019 & 2032
- Table 43: India Printed Sensor Industry Revenue (Million) Forecast, by Application 2019 & 2032
- Table 44: India Printed Sensor Industry Volume (K Unit) Forecast, by Application 2019 & 2032
- Table 45: South Korea Printed Sensor Industry Revenue (Million) Forecast, by Application 2019 & 2032
- Table 46: South Korea Printed Sensor Industry Volume (K Unit) Forecast, by Application 2019 & 2032
- Table 47: Southeast Asia Printed Sensor Industry Revenue (Million) Forecast, by Application 2019 & 2032
- Table 48: Southeast Asia Printed Sensor Industry Volume (K Unit) Forecast, by Application 2019 & 2032
- Table 49: Australia Printed Sensor Industry Revenue (Million) Forecast, by Application 2019 & 2032
- Table 50: Australia Printed Sensor Industry Volume (K Unit) Forecast, by Application 2019 & 2032
- Table 51: Indonesia Printed Sensor Industry Revenue (Million) Forecast, by Application 2019 & 2032
- Table 52: Indonesia Printed Sensor Industry Volume (K Unit) Forecast, by Application 2019 & 2032
- Table 53: Phillipes Printed Sensor Industry Revenue (Million) Forecast, by Application 2019 & 2032
- Table 54: Phillipes Printed Sensor Industry Volume (K Unit) Forecast, by Application 2019 & 2032
- Table 55: Singapore Printed Sensor Industry Revenue (Million) Forecast, by Application 2019 & 2032
- Table 56: Singapore Printed Sensor Industry Volume (K Unit) Forecast, by Application 2019 & 2032
- Table 57: Thailandc Printed Sensor Industry Revenue (Million) Forecast, by Application 2019 & 2032
- Table 58: Thailandc Printed Sensor Industry Volume (K Unit) Forecast, by Application 2019 & 2032
- Table 59: Rest of Asia Pacific Printed Sensor Industry Revenue (Million) Forecast, by Application 2019 & 2032
- Table 60: Rest of Asia Pacific Printed Sensor Industry Volume (K Unit) Forecast, by Application 2019 & 2032
- Table 61: Global Printed Sensor Industry Revenue Million Forecast, by Country 2019 & 2032
- Table 62: Global Printed Sensor Industry Volume K Unit Forecast, by Country 2019 & 2032
- Table 63: Brazil Printed Sensor Industry Revenue (Million) Forecast, by Application 2019 & 2032
- Table 64: Brazil Printed Sensor Industry Volume (K Unit) Forecast, by Application 2019 & 2032
- Table 65: Argentina Printed Sensor Industry Revenue (Million) Forecast, by Application 2019 & 2032
- Table 66: Argentina Printed Sensor Industry Volume (K Unit) Forecast, by Application 2019 & 2032
- Table 67: Peru Printed Sensor Industry Revenue (Million) Forecast, by Application 2019 & 2032
- Table 68: Peru Printed Sensor Industry Volume (K Unit) Forecast, by Application 2019 & 2032
- Table 69: Chile Printed Sensor Industry Revenue (Million) Forecast, by Application 2019 & 2032
- Table 70: Chile Printed Sensor Industry Volume (K Unit) Forecast, by Application 2019 & 2032
- Table 71: Colombia Printed Sensor Industry Revenue (Million) Forecast, by Application 2019 & 2032
- Table 72: Colombia Printed Sensor Industry Volume (K Unit) Forecast, by Application 2019 & 2032
- Table 73: Ecuador Printed Sensor Industry Revenue (Million) Forecast, by Application 2019 & 2032
- Table 74: Ecuador Printed Sensor Industry Volume (K Unit) Forecast, by Application 2019 & 2032
- Table 75: Venezuela Printed Sensor Industry Revenue (Million) Forecast, by Application 2019 & 2032
- Table 76: Venezuela Printed Sensor Industry Volume (K Unit) Forecast, by Application 2019 & 2032
- Table 77: Rest of South America Printed Sensor Industry Revenue (Million) Forecast, by Application 2019 & 2032
- Table 78: Rest of South America Printed Sensor Industry Volume (K Unit) Forecast, by Application 2019 & 2032
- Table 79: Global Printed Sensor Industry Revenue Million Forecast, by Country 2019 & 2032
- Table 80: Global Printed Sensor Industry Volume K Unit Forecast, by Country 2019 & 2032
- Table 81: United States Printed Sensor Industry Revenue (Million) Forecast, by Application 2019 & 2032
- Table 82: United States Printed Sensor Industry Volume (K Unit) Forecast, by Application 2019 & 2032
- Table 83: Canada Printed Sensor Industry Revenue (Million) Forecast, by Application 2019 & 2032
- Table 84: Canada Printed Sensor Industry Volume (K Unit) Forecast, by Application 2019 & 2032
- Table 85: Mexico Printed Sensor Industry Revenue (Million) Forecast, by Application 2019 & 2032
- Table 86: Mexico Printed Sensor Industry Volume (K Unit) Forecast, by Application 2019 & 2032
- Table 87: Global Printed Sensor Industry Revenue Million Forecast, by Country 2019 & 2032
- Table 88: Global Printed Sensor Industry Volume K Unit Forecast, by Country 2019 & 2032
- Table 89: United Arab Emirates Printed Sensor Industry Revenue (Million) Forecast, by Application 2019 & 2032
- Table 90: United Arab Emirates Printed Sensor Industry Volume (K Unit) Forecast, by Application 2019 & 2032
- Table 91: Saudi Arabia Printed Sensor Industry Revenue (Million) Forecast, by Application 2019 & 2032
- Table 92: Saudi Arabia Printed Sensor Industry Volume (K Unit) Forecast, by Application 2019 & 2032
- Table 93: South Africa Printed Sensor Industry Revenue (Million) Forecast, by Application 2019 & 2032
- Table 94: South Africa Printed Sensor Industry Volume (K Unit) Forecast, by Application 2019 & 2032
- Table 95: Rest of Middle East and Africa Printed Sensor Industry Revenue (Million) Forecast, by Application 2019 & 2032
- Table 96: Rest of Middle East and Africa Printed Sensor Industry Volume (K Unit) Forecast, by Application 2019 & 2032
- Table 97: Global Printed Sensor Industry Revenue Million Forecast, by End-User Industry 2019 & 2032
- Table 98: Global Printed Sensor Industry Volume K Unit Forecast, by End-User Industry 2019 & 2032
- Table 99: Global Printed Sensor Industry Revenue Million Forecast, by Country 2019 & 2032
- Table 100: Global Printed Sensor Industry Volume K Unit Forecast, by Country 2019 & 2032
- Table 101: Global Printed Sensor Industry Revenue Million Forecast, by End-User Industry 2019 & 2032
- Table 102: Global Printed Sensor Industry Volume K Unit Forecast, by End-User Industry 2019 & 2032
- Table 103: Global Printed Sensor Industry Revenue Million Forecast, by Country 2019 & 2032
- Table 104: Global Printed Sensor Industry Volume K Unit Forecast, by Country 2019 & 2032
- Table 105: Global Printed Sensor Industry Revenue Million Forecast, by End-User Industry 2019 & 2032
- Table 106: Global Printed Sensor Industry Volume K Unit Forecast, by End-User Industry 2019 & 2032
- Table 107: Global Printed Sensor Industry Revenue Million Forecast, by Country 2019 & 2032
- Table 108: Global Printed Sensor Industry Volume K Unit Forecast, by Country 2019 & 2032
- Table 109: Global Printed Sensor Industry Revenue Million Forecast, by End-User Industry 2019 & 2032
- Table 110: Global Printed Sensor Industry Volume K Unit Forecast, by End-User Industry 2019 & 2032
- Table 111: Global Printed Sensor Industry Revenue Million Forecast, by Country 2019 & 2032
- Table 112: Global Printed Sensor Industry Volume K Unit Forecast, by Country 2019 & 2032
Frequently Asked Questions
1. What is the projected Compound Annual Growth Rate (CAGR) of the Printed Sensor Industry?
The projected CAGR is approximately 6.62%.
2. Which companies are prominent players in the Printed Sensor Industry?
Key companies in the market include Pressure Profile Systems Inc, Butler Technologies Inc, Peratech Holdco Limited, Tekscan Inc, T+Ink Inc (IDTechEx Ltd ), Renesas Electronics Corporation, KWJ Engineering inc (SPEC Sensors LLC), FlexEnable Limited, Thin Film Electronics ASA, Plastic Logic HK Ltd, Canatu Oy, ISORG SA.
3. What are the main segments of the Printed Sensor Industry?
The market segments include End-User Industry.
4. Can you provide details about the market size?
The market size is estimated to be USD XX Million as of 2022.
5. What are some drivers contributing to market growth?
; Use of Integrated Dashboards in Advanced Driver Assistance System (ADAS) in Automotive Sector; Increasing Usage of CMOS Sensors in Consumer Electronics Products.
6. What are the notable trends driving market growth?
Consumer Electronics is Expected to Hold Major Market Share.
7. Are there any restraints impacting market growth?
; Complex Manufacturing Process.
8. Can you provide examples of recent developments in the market?
N/A
9. What pricing options are available for accessing the report?
Pricing options include single-user, multi-user, and enterprise licenses priced at USD 4750, USD 5250, and USD 8750 respectively.
10. Is the market size provided in terms of value or volume?
The market size is provided in terms of value, measured in Million and volume, measured in K Unit.
11. Are there any specific market keywords associated with the report?
Yes, the market keyword associated with the report is "Printed Sensor Industry," which aids in identifying and referencing the specific market segment covered.
12. How do I determine which pricing option suits my needs best?
The pricing options vary based on user requirements and access needs. Individual users may opt for single-user licenses, while businesses requiring broader access may choose multi-user or enterprise licenses for cost-effective access to the report.
13. Are there any additional resources or data provided in the Printed Sensor Industry report?
While the report offers comprehensive insights, it's advisable to review the specific contents or supplementary materials provided to ascertain if additional resources or data are available.
14. How can I stay updated on further developments or reports in the Printed Sensor Industry?
To stay informed about further developments, trends, and reports in the Printed Sensor Industry, consider subscribing to industry newsletters, following relevant companies and organizations, or regularly checking reputable industry news sources and publications.
Methodology
Step 1 - Identification of Relevant Samples Size from Population Database


Step 2 - Approaches for Defining Global Market Size (Value, Volume* & Price*)

Note*: In applicable scenarios
Step 3 - Data Sources
Primary Research
- Web Analytics
- Survey Reports
- Research Institute
- Latest Research Reports
- Opinion Leaders
Secondary Research
- Annual Reports
- White Paper
- Latest Press Release
- Industry Association
- Paid Database
- Investor Presentations

Step 4 - Data Triangulation
Involves using different sources of information in order to increase the validity of a study
These sources are likely to be stakeholders in a program - participants, other researchers, program staff, other community members, and so on.
Then we put all data in single framework & apply various statistical tools to find out the dynamic on the market.
During the analysis stage, feedback from the stakeholder groups would be compared to determine areas of agreement as well as areas of divergence


