
Key Insights
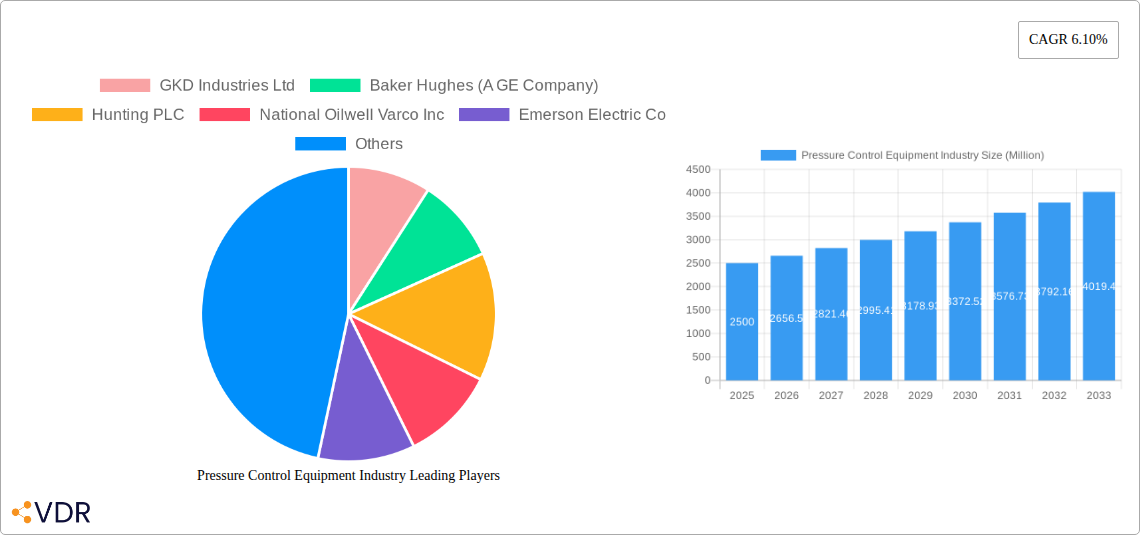
The pressure control equipment market, valued at approximately $XX million in 2025, is projected to experience robust growth, driven by a Compound Annual Growth Rate (CAGR) of 6.10% from 2025 to 2033. This expansion is fueled by several key factors. The burgeoning global energy demand, particularly in developing economies, necessitates increased oil and gas exploration and production, directly impacting the demand for sophisticated pressure control equipment. Furthermore, stringent safety regulations and the increasing focus on minimizing environmental impact are prompting the adoption of advanced, high-pressure equipment capable of withstanding extreme conditions and preventing leaks. Technological advancements, such as the development of lighter, more durable materials and improved automation, further contribute to market growth. The segment encompassing high-pressure equipment (above 10,000 PSI) is anticipated to dominate the market due to its crucial role in deepwater and challenging onshore environments. Offshore applications will also see strong growth, as advancements in subsea production technologies drive demand for specialized pressure control systems.
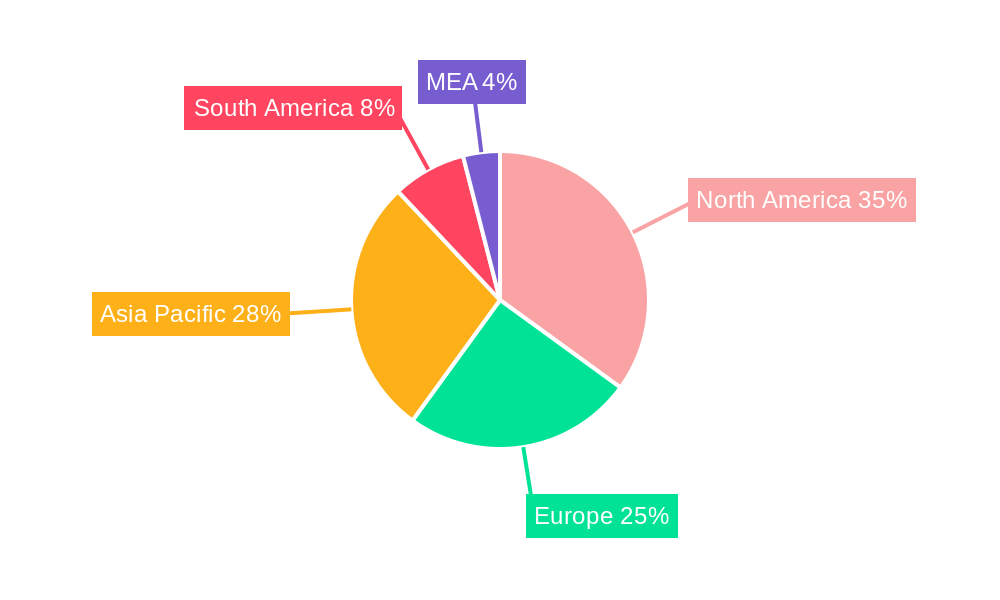
Geographic distribution reveals a significant market presence across North America, Europe, and the Asia-Pacific region. North America, propelled by robust domestic oil and gas production and stringent regulatory frameworks, currently holds a substantial market share. The Asia-Pacific region, fueled by rapid industrialization and substantial infrastructure investments, is poised for significant growth, with China and India emerging as key contributors. However, factors such as price volatility in the energy sector and the potential for fluctuating commodity prices represent significant restraints to market growth, influencing investment decisions and overall market expansion. Competition amongst established players like Baker Hughes, Schlumberger, and National Oilwell Varco, along with the emergence of innovative regional players, is intensifying, shaping market dynamics through technological advancements and strategic partnerships.
Pressure Control Equipment Industry Market Report: 2019-2033
This comprehensive report provides a detailed analysis of the Pressure Control Equipment industry, encompassing market dynamics, growth trends, regional analysis, product landscape, key players, and future outlook. The study covers the period from 2019 to 2033, with 2025 as the base year and a forecast period of 2025-2033. This report is invaluable for industry professionals, investors, and stakeholders seeking a thorough understanding of this critical sector. The total market size is estimated to reach xx Million units by 2033.
Pressure Control Equipment Industry Market Dynamics & Structure
The Pressure Control Equipment market, encompassing parent markets like Oil & Gas and child markets such as Upstream Oil & Gas, is characterized by moderate concentration, with key players holding significant market share. Technological innovation, driven by the need for enhanced safety, efficiency, and sustainability, is a major driver. Stringent regulatory frameworks, particularly concerning safety and environmental compliance, influence market dynamics. Competitive pressures from substitute products, along with end-user demographics (primarily energy companies and industrial manufacturers), shape the market landscape. Mergers and acquisitions (M&A) activity plays a significant role in consolidating market share and fostering technological advancements.
- Market Concentration: Moderately concentrated, with top 5 players holding approximately xx% market share in 2024.
- Technological Innovation: Focus on advanced materials, automation, and digitalization for enhanced performance and safety.
- Regulatory Frameworks: Stringent safety and environmental regulations drive demand for compliant equipment.
- Competitive Substitutes: Limited direct substitutes, but alternative control methods and technologies pose indirect competition.
- M&A Activity: Significant M&A activity observed in recent years, leading to market consolidation. Approximately xx deals were recorded between 2019 and 2024.
Pressure Control Equipment Industry Growth Trends & Insights
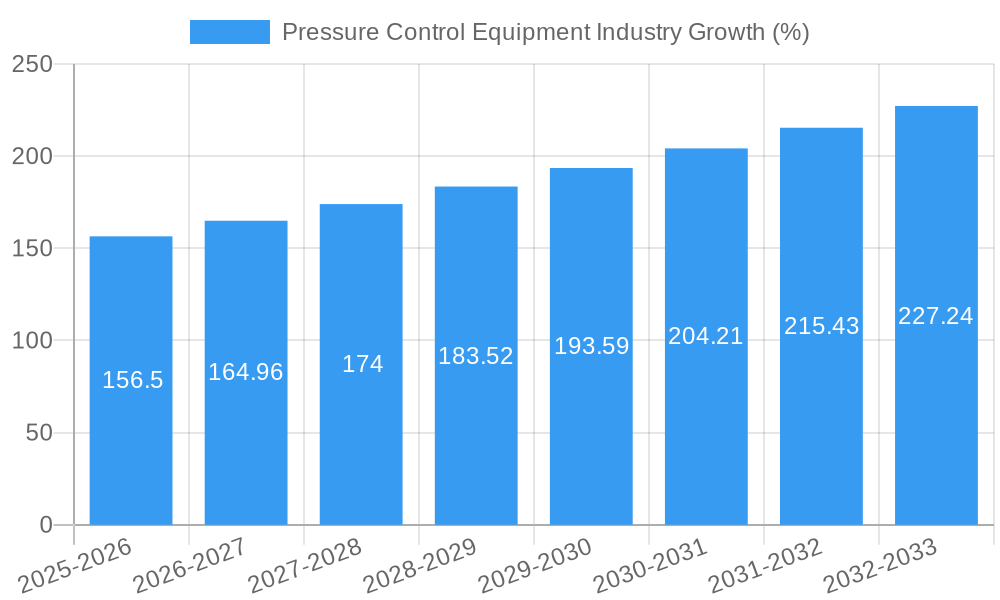
The Pressure Control Equipment market experienced steady growth during the historical period (2019-2024), driven by increasing oil and gas exploration and production activities, as well as growth in industrial applications. The market is expected to continue growing at a Compound Annual Growth Rate (CAGR) of xx% during the forecast period (2025-2033), reaching xx Million units by 2033. Technological disruptions, such as the adoption of smart sensors and remote monitoring systems, are accelerating market growth. Shifting consumer behavior towards safer and more efficient equipment further contributes to market expansion. Market penetration in emerging economies is expected to significantly contribute to growth.
Dominant Regions, Countries, or Segments in Pressure Control Equipment Industry
The offshore segment within the application category holds a significant market share, driven by the high demand for sophisticated pressure control equipment in deepwater drilling operations. North America and the Middle East are leading regional markets due to extensive oil and gas activities. Within the component segment, Valves hold the largest market share due to their critical role in controlling fluid flow. High-pressure equipment (above 10,000 PSI) dominates the market, reflecting the needs of high-pressure applications in oil and gas exploration and industrial processes.
- Leading Region: North America (xx% market share in 2024)
- Leading Country: United States (xx% market share within North America in 2024)
- Leading Segment (Component): Valves (xx% market share in 2024)
- Leading Segment (Application): Offshore (xx% market share in 2024)
- Leading Segment (Type): High Pressure (Above 10,000 PSI) (xx% market share in 2024)
- Key Drivers: Increased oil and gas exploration and production, rising industrialization, and stringent safety regulations.
Pressure Control Equipment Industry Product Landscape
The Pressure Control Equipment market showcases continuous innovation, focusing on enhanced safety, reliability, and efficiency. Product innovations include smart valves with integrated sensors, advanced control systems for precise pressure regulation, and lightweight, corrosion-resistant materials. These advancements cater to the demanding requirements of diverse applications, particularly in high-pressure and hazardous environments. Unique selling propositions include improved sealing performance, reduced fugitive emissions, and enhanced remote monitoring capabilities.
Key Drivers, Barriers & Challenges in Pressure Control Equipment Industry
Key Drivers:
- Increasing demand from oil and gas industry
- Growing industrial applications
- Stringent safety regulations
- Technological advancements
Challenges and Restraints:
- Fluctuations in oil and gas prices impacting investment decisions
- Supply chain disruptions
- Intense competition leading to price pressure
- Regulatory hurdles and compliance costs
Emerging Opportunities in Pressure Control Equipment Industry
- Growing demand for hydrogen fueling infrastructure and related equipment.
- Expansion into renewable energy sectors
- Development of equipment for unconventional oil and gas resources.
- Adoption of digital technologies and remote monitoring systems.
Growth Accelerators in the Pressure Control Equipment Industry Industry
Technological breakthroughs in materials science, automation, and data analytics are key growth accelerators. Strategic partnerships between equipment manufacturers and technology providers are fostering innovation. Market expansion into emerging economies, driven by increasing energy demand and industrialization, creates significant growth opportunities.
Key Players Shaping the Pressure Control Equipment Industry Market
- GKD Industries Ltd
- Baker Hughes (A GE Company)
- Hunting PLC
- National Oilwell Varco Inc
- Emerson Electric Co
- Schlumberger Ltd
- Lee Specialties Inc
- Allied Valves Inc
- Weatherford International PLC
- FHE USA LLC
- TIS Manufacturing Ltd
- Kirloskar Brothers Ltd
- IKM Pressure Control AS
- Brace Tool Inc
Notable Milestones in Pressure Control Equipment Industry Sector
- July 2022: Emerson announced new valves for hydrogen fueling stations, enhancing safety and reducing leaks.
- July 2022: WIKA Instruments India Pvt. Ltd. introduced the PSM-630 pressure switch for industrial applications.
- February 2022: CIRCOR International, Inc. acquired Hale Hamilton Valves Limited and Cambridge Fluid Systems for USD 51 million.
In-Depth Pressure Control Equipment Industry Market Outlook
The Pressure Control Equipment market is poised for significant growth in the coming years, driven by ongoing technological advancements, expanding applications in diverse industries, and increasing demand from emerging economies. Strategic partnerships, focused innovation in areas such as hydrogen technologies, and proactive adaptation to regulatory changes present substantial opportunities for market participants. The market is expected to witness sustained growth, offering lucrative prospects for investors and industry players alike.
Pressure Control Equipment Industry Segmentation
-
1. Component
- 1.1. Valves
- 1.2. Control Head
- 1.3. Wellhead Flange
- 1.4. Christmas Tree (Flow Tee)
- 1.5. Adapter Flange
- 1.6. Quick Unions
- 1.7. Others
-
2. Application
- 2.1. Offshore
- 2.2. Onshore
-
3. Type
- 3.1. High Pressure (Above 10,000 PSI)
- 3.2. Low Pressure (Below 10,000 PSI)
Pressure Control Equipment Industry Segmentation By Geography
- 1. North America
- 2. Europe
- 3. Asia Pacific
- 4. Middle East
- 5. Latin America
Pressure Control Equipment Industry REPORT HIGHLIGHTS
| Aspects | Details |
|---|---|
| Study Period | 2019-2033 |
| Base Year | 2024 |
| Estimated Year | 2025 |
| Forecast Period | 2025-2033 |
| Historical Period | 2019-2024 |
| Growth Rate | CAGR of 6.10% from 2019-2033 |
| Segmentation |
|
Table of Contents
- 1. Introduction
- 1.1. Research Scope
- 1.2. Market Segmentation
- 1.3. Research Methodology
- 1.4. Definitions and Assumptions
- 2. Executive Summary
- 2.1. Introduction
- 3. Market Dynamics
- 3.1. Introduction
- 3.2. Market Drivers
- 3.2.1. Technological Advancement in Oilfield Equipment; Increase in Global Investments in Exploration & Production (E&P)
- 3.3. Market Restrains
- 3.3.1. Customized Demands by Drillers; Decline in Drilling Activities and Rig Counts
- 3.4. Market Trends
- 3.4.1. Valves Segment Expected to Hold Significant Share
- 4. Market Factor Analysis
- 4.1. Porters Five Forces
- 4.2. Supply/Value Chain
- 4.3. PESTEL analysis
- 4.4. Market Entropy
- 4.5. Patent/Trademark Analysis
- 5. Global Pressure Control Equipment Industry Analysis, Insights and Forecast, 2019-2031
- 5.1. Market Analysis, Insights and Forecast - by Component
- 5.1.1. Valves
- 5.1.2. Control Head
- 5.1.3. Wellhead Flange
- 5.1.4. Christmas Tree (Flow Tee)
- 5.1.5. Adapter Flange
- 5.1.6. Quick Unions
- 5.1.7. Others
- 5.2. Market Analysis, Insights and Forecast - by Application
- 5.2.1. Offshore
- 5.2.2. Onshore
- 5.3. Market Analysis, Insights and Forecast - by Type
- 5.3.1. High Pressure (Above 10,000 PSI)
- 5.3.2. Low Pressure (Below 10,000 PSI)
- 5.4. Market Analysis, Insights and Forecast - by Region
- 5.4.1. North America
- 5.4.2. Europe
- 5.4.3. Asia Pacific
- 5.4.4. Middle East
- 5.4.5. Latin America
- 5.1. Market Analysis, Insights and Forecast - by Component
- 6. North America Pressure Control Equipment Industry Analysis, Insights and Forecast, 2019-2031
- 6.1. Market Analysis, Insights and Forecast - by Component
- 6.1.1. Valves
- 6.1.2. Control Head
- 6.1.3. Wellhead Flange
- 6.1.4. Christmas Tree (Flow Tee)
- 6.1.5. Adapter Flange
- 6.1.6. Quick Unions
- 6.1.7. Others
- 6.2. Market Analysis, Insights and Forecast - by Application
- 6.2.1. Offshore
- 6.2.2. Onshore
- 6.3. Market Analysis, Insights and Forecast - by Type
- 6.3.1. High Pressure (Above 10,000 PSI)
- 6.3.2. Low Pressure (Below 10,000 PSI)
- 6.1. Market Analysis, Insights and Forecast - by Component
- 7. Europe Pressure Control Equipment Industry Analysis, Insights and Forecast, 2019-2031
- 7.1. Market Analysis, Insights and Forecast - by Component
- 7.1.1. Valves
- 7.1.2. Control Head
- 7.1.3. Wellhead Flange
- 7.1.4. Christmas Tree (Flow Tee)
- 7.1.5. Adapter Flange
- 7.1.6. Quick Unions
- 7.1.7. Others
- 7.2. Market Analysis, Insights and Forecast - by Application
- 7.2.1. Offshore
- 7.2.2. Onshore
- 7.3. Market Analysis, Insights and Forecast - by Type
- 7.3.1. High Pressure (Above 10,000 PSI)
- 7.3.2. Low Pressure (Below 10,000 PSI)
- 7.1. Market Analysis, Insights and Forecast - by Component
- 8. Asia Pacific Pressure Control Equipment Industry Analysis, Insights and Forecast, 2019-2031
- 8.1. Market Analysis, Insights and Forecast - by Component
- 8.1.1. Valves
- 8.1.2. Control Head
- 8.1.3. Wellhead Flange
- 8.1.4. Christmas Tree (Flow Tee)
- 8.1.5. Adapter Flange
- 8.1.6. Quick Unions
- 8.1.7. Others
- 8.2. Market Analysis, Insights and Forecast - by Application
- 8.2.1. Offshore
- 8.2.2. Onshore
- 8.3. Market Analysis, Insights and Forecast - by Type
- 8.3.1. High Pressure (Above 10,000 PSI)
- 8.3.2. Low Pressure (Below 10,000 PSI)
- 8.1. Market Analysis, Insights and Forecast - by Component
- 9. Middle East Pressure Control Equipment Industry Analysis, Insights and Forecast, 2019-2031
- 9.1. Market Analysis, Insights and Forecast - by Component
- 9.1.1. Valves
- 9.1.2. Control Head
- 9.1.3. Wellhead Flange
- 9.1.4. Christmas Tree (Flow Tee)
- 9.1.5. Adapter Flange
- 9.1.6. Quick Unions
- 9.1.7. Others
- 9.2. Market Analysis, Insights and Forecast - by Application
- 9.2.1. Offshore
- 9.2.2. Onshore
- 9.3. Market Analysis, Insights and Forecast - by Type
- 9.3.1. High Pressure (Above 10,000 PSI)
- 9.3.2. Low Pressure (Below 10,000 PSI)
- 9.1. Market Analysis, Insights and Forecast - by Component
- 10. Latin America Pressure Control Equipment Industry Analysis, Insights and Forecast, 2019-2031
- 10.1. Market Analysis, Insights and Forecast - by Component
- 10.1.1. Valves
- 10.1.2. Control Head
- 10.1.3. Wellhead Flange
- 10.1.4. Christmas Tree (Flow Tee)
- 10.1.5. Adapter Flange
- 10.1.6. Quick Unions
- 10.1.7. Others
- 10.2. Market Analysis, Insights and Forecast - by Application
- 10.2.1. Offshore
- 10.2.2. Onshore
- 10.3. Market Analysis, Insights and Forecast - by Type
- 10.3.1. High Pressure (Above 10,000 PSI)
- 10.3.2. Low Pressure (Below 10,000 PSI)
- 10.1. Market Analysis, Insights and Forecast - by Component
- 11. North America Pressure Control Equipment Industry Analysis, Insights and Forecast, 2019-2031
- 11.1. Market Analysis, Insights and Forecast - By Country/Sub-region
- 11.1.1 United States
- 11.1.2 Canada
- 11.1.3 Mexico
- 12. Europe Pressure Control Equipment Industry Analysis, Insights and Forecast, 2019-2031
- 12.1. Market Analysis, Insights and Forecast - By Country/Sub-region
- 12.1.1 Germany
- 12.1.2 United Kingdom
- 12.1.3 France
- 12.1.4 Spain
- 12.1.5 Italy
- 12.1.6 Spain
- 12.1.7 Belgium
- 12.1.8 Netherland
- 12.1.9 Nordics
- 12.1.10 Rest of Europe
- 13. Asia Pacific Pressure Control Equipment Industry Analysis, Insights and Forecast, 2019-2031
- 13.1. Market Analysis, Insights and Forecast - By Country/Sub-region
- 13.1.1 China
- 13.1.2 Japan
- 13.1.3 India
- 13.1.4 South Korea
- 13.1.5 Southeast Asia
- 13.1.6 Australia
- 13.1.7 Indonesia
- 13.1.8 Phillipes
- 13.1.9 Singapore
- 13.1.10 Thailandc
- 13.1.11 Rest of Asia Pacific
- 14. South America Pressure Control Equipment Industry Analysis, Insights and Forecast, 2019-2031
- 14.1. Market Analysis, Insights and Forecast - By Country/Sub-region
- 14.1.1 Brazil
- 14.1.2 Argentina
- 14.1.3 Peru
- 14.1.4 Chile
- 14.1.5 Colombia
- 14.1.6 Ecuador
- 14.1.7 Venezuela
- 14.1.8 Rest of South America
- 15. North America Pressure Control Equipment Industry Analysis, Insights and Forecast, 2019-2031
- 15.1. Market Analysis, Insights and Forecast - By Country/Sub-region
- 15.1.1 United States
- 15.1.2 Canada
- 15.1.3 Mexico
- 16. MEA Pressure Control Equipment Industry Analysis, Insights and Forecast, 2019-2031
- 16.1. Market Analysis, Insights and Forecast - By Country/Sub-region
- 16.1.1 United Arab Emirates
- 16.1.2 Saudi Arabia
- 16.1.3 South Africa
- 16.1.4 Rest of Middle East and Africa
- 17. Competitive Analysis
- 17.1. Global Market Share Analysis 2024
- 17.2. Company Profiles
- 17.2.1 GKD Industries Ltd
- 17.2.1.1. Overview
- 17.2.1.2. Products
- 17.2.1.3. SWOT Analysis
- 17.2.1.4. Recent Developments
- 17.2.1.5. Financials (Based on Availability)
- 17.2.2 Baker Hughes (A GE Company)
- 17.2.2.1. Overview
- 17.2.2.2. Products
- 17.2.2.3. SWOT Analysis
- 17.2.2.4. Recent Developments
- 17.2.2.5. Financials (Based on Availability)
- 17.2.3 Hunting PLC
- 17.2.3.1. Overview
- 17.2.3.2. Products
- 17.2.3.3. SWOT Analysis
- 17.2.3.4. Recent Developments
- 17.2.3.5. Financials (Based on Availability)
- 17.2.4 National Oilwell Varco Inc
- 17.2.4.1. Overview
- 17.2.4.2. Products
- 17.2.4.3. SWOT Analysis
- 17.2.4.4. Recent Developments
- 17.2.4.5. Financials (Based on Availability)
- 17.2.5 Emerson Electric Co
- 17.2.5.1. Overview
- 17.2.5.2. Products
- 17.2.5.3. SWOT Analysis
- 17.2.5.4. Recent Developments
- 17.2.5.5. Financials (Based on Availability)
- 17.2.6 Schlumberger Ltd
- 17.2.6.1. Overview
- 17.2.6.2. Products
- 17.2.6.3. SWOT Analysis
- 17.2.6.4. Recent Developments
- 17.2.6.5. Financials (Based on Availability)
- 17.2.7 Lee Specialties Inc
- 17.2.7.1. Overview
- 17.2.7.2. Products
- 17.2.7.3. SWOT Analysis
- 17.2.7.4. Recent Developments
- 17.2.7.5. Financials (Based on Availability)
- 17.2.8 Allied Valves Inc
- 17.2.8.1. Overview
- 17.2.8.2. Products
- 17.2.8.3. SWOT Analysis
- 17.2.8.4. Recent Developments
- 17.2.8.5. Financials (Based on Availability)
- 17.2.9 Weatherford International PLC
- 17.2.9.1. Overview
- 17.2.9.2. Products
- 17.2.9.3. SWOT Analysis
- 17.2.9.4. Recent Developments
- 17.2.9.5. Financials (Based on Availability)
- 17.2.10 FHE USA LLC
- 17.2.10.1. Overview
- 17.2.10.2. Products
- 17.2.10.3. SWOT Analysis
- 17.2.10.4. Recent Developments
- 17.2.10.5. Financials (Based on Availability)
- 17.2.11 TIS Manufacturing Ltd
- 17.2.11.1. Overview
- 17.2.11.2. Products
- 17.2.11.3. SWOT Analysis
- 17.2.11.4. Recent Developments
- 17.2.11.5. Financials (Based on Availability)
- 17.2.12 Kirloskar Brothers Ltd
- 17.2.12.1. Overview
- 17.2.12.2. Products
- 17.2.12.3. SWOT Analysis
- 17.2.12.4. Recent Developments
- 17.2.12.5. Financials (Based on Availability)
- 17.2.13 IKM Pressure Control AS
- 17.2.13.1. Overview
- 17.2.13.2. Products
- 17.2.13.3. SWOT Analysis
- 17.2.13.4. Recent Developments
- 17.2.13.5. Financials (Based on Availability)
- 17.2.14 Brace Tool Inc
- 17.2.14.1. Overview
- 17.2.14.2. Products
- 17.2.14.3. SWOT Analysis
- 17.2.14.4. Recent Developments
- 17.2.14.5. Financials (Based on Availability)
- 17.2.1 GKD Industries Ltd
List of Figures
- Figure 1: Global Pressure Control Equipment Industry Revenue Breakdown (Million, %) by Region 2024 & 2032
- Figure 2: Global Pressure Control Equipment Industry Volume Breakdown (K Unit, %) by Region 2024 & 2032
- Figure 3: North America Pressure Control Equipment Industry Revenue (Million), by Country 2024 & 2032
- Figure 4: North America Pressure Control Equipment Industry Volume (K Unit), by Country 2024 & 2032
- Figure 5: North America Pressure Control Equipment Industry Revenue Share (%), by Country 2024 & 2032
- Figure 6: North America Pressure Control Equipment Industry Volume Share (%), by Country 2024 & 2032
- Figure 7: Europe Pressure Control Equipment Industry Revenue (Million), by Country 2024 & 2032
- Figure 8: Europe Pressure Control Equipment Industry Volume (K Unit), by Country 2024 & 2032
- Figure 9: Europe Pressure Control Equipment Industry Revenue Share (%), by Country 2024 & 2032
- Figure 10: Europe Pressure Control Equipment Industry Volume Share (%), by Country 2024 & 2032
- Figure 11: Asia Pacific Pressure Control Equipment Industry Revenue (Million), by Country 2024 & 2032
- Figure 12: Asia Pacific Pressure Control Equipment Industry Volume (K Unit), by Country 2024 & 2032
- Figure 13: Asia Pacific Pressure Control Equipment Industry Revenue Share (%), by Country 2024 & 2032
- Figure 14: Asia Pacific Pressure Control Equipment Industry Volume Share (%), by Country 2024 & 2032
- Figure 15: South America Pressure Control Equipment Industry Revenue (Million), by Country 2024 & 2032
- Figure 16: South America Pressure Control Equipment Industry Volume (K Unit), by Country 2024 & 2032
- Figure 17: South America Pressure Control Equipment Industry Revenue Share (%), by Country 2024 & 2032
- Figure 18: South America Pressure Control Equipment Industry Volume Share (%), by Country 2024 & 2032
- Figure 19: North America Pressure Control Equipment Industry Revenue (Million), by Country 2024 & 2032
- Figure 20: North America Pressure Control Equipment Industry Volume (K Unit), by Country 2024 & 2032
- Figure 21: North America Pressure Control Equipment Industry Revenue Share (%), by Country 2024 & 2032
- Figure 22: North America Pressure Control Equipment Industry Volume Share (%), by Country 2024 & 2032
- Figure 23: MEA Pressure Control Equipment Industry Revenue (Million), by Country 2024 & 2032
- Figure 24: MEA Pressure Control Equipment Industry Volume (K Unit), by Country 2024 & 2032
- Figure 25: MEA Pressure Control Equipment Industry Revenue Share (%), by Country 2024 & 2032
- Figure 26: MEA Pressure Control Equipment Industry Volume Share (%), by Country 2024 & 2032
- Figure 27: North America Pressure Control Equipment Industry Revenue (Million), by Component 2024 & 2032
- Figure 28: North America Pressure Control Equipment Industry Volume (K Unit), by Component 2024 & 2032
- Figure 29: North America Pressure Control Equipment Industry Revenue Share (%), by Component 2024 & 2032
- Figure 30: North America Pressure Control Equipment Industry Volume Share (%), by Component 2024 & 2032
- Figure 31: North America Pressure Control Equipment Industry Revenue (Million), by Application 2024 & 2032
- Figure 32: North America Pressure Control Equipment Industry Volume (K Unit), by Application 2024 & 2032
- Figure 33: North America Pressure Control Equipment Industry Revenue Share (%), by Application 2024 & 2032
- Figure 34: North America Pressure Control Equipment Industry Volume Share (%), by Application 2024 & 2032
- Figure 35: North America Pressure Control Equipment Industry Revenue (Million), by Type 2024 & 2032
- Figure 36: North America Pressure Control Equipment Industry Volume (K Unit), by Type 2024 & 2032
- Figure 37: North America Pressure Control Equipment Industry Revenue Share (%), by Type 2024 & 2032
- Figure 38: North America Pressure Control Equipment Industry Volume Share (%), by Type 2024 & 2032
- Figure 39: North America Pressure Control Equipment Industry Revenue (Million), by Country 2024 & 2032
- Figure 40: North America Pressure Control Equipment Industry Volume (K Unit), by Country 2024 & 2032
- Figure 41: North America Pressure Control Equipment Industry Revenue Share (%), by Country 2024 & 2032
- Figure 42: North America Pressure Control Equipment Industry Volume Share (%), by Country 2024 & 2032
- Figure 43: Europe Pressure Control Equipment Industry Revenue (Million), by Component 2024 & 2032
- Figure 44: Europe Pressure Control Equipment Industry Volume (K Unit), by Component 2024 & 2032
- Figure 45: Europe Pressure Control Equipment Industry Revenue Share (%), by Component 2024 & 2032
- Figure 46: Europe Pressure Control Equipment Industry Volume Share (%), by Component 2024 & 2032
- Figure 47: Europe Pressure Control Equipment Industry Revenue (Million), by Application 2024 & 2032
- Figure 48: Europe Pressure Control Equipment Industry Volume (K Unit), by Application 2024 & 2032
- Figure 49: Europe Pressure Control Equipment Industry Revenue Share (%), by Application 2024 & 2032
- Figure 50: Europe Pressure Control Equipment Industry Volume Share (%), by Application 2024 & 2032
- Figure 51: Europe Pressure Control Equipment Industry Revenue (Million), by Type 2024 & 2032
- Figure 52: Europe Pressure Control Equipment Industry Volume (K Unit), by Type 2024 & 2032
- Figure 53: Europe Pressure Control Equipment Industry Revenue Share (%), by Type 2024 & 2032
- Figure 54: Europe Pressure Control Equipment Industry Volume Share (%), by Type 2024 & 2032
- Figure 55: Europe Pressure Control Equipment Industry Revenue (Million), by Country 2024 & 2032
- Figure 56: Europe Pressure Control Equipment Industry Volume (K Unit), by Country 2024 & 2032
- Figure 57: Europe Pressure Control Equipment Industry Revenue Share (%), by Country 2024 & 2032
- Figure 58: Europe Pressure Control Equipment Industry Volume Share (%), by Country 2024 & 2032
- Figure 59: Asia Pacific Pressure Control Equipment Industry Revenue (Million), by Component 2024 & 2032
- Figure 60: Asia Pacific Pressure Control Equipment Industry Volume (K Unit), by Component 2024 & 2032
- Figure 61: Asia Pacific Pressure Control Equipment Industry Revenue Share (%), by Component 2024 & 2032
- Figure 62: Asia Pacific Pressure Control Equipment Industry Volume Share (%), by Component 2024 & 2032
- Figure 63: Asia Pacific Pressure Control Equipment Industry Revenue (Million), by Application 2024 & 2032
- Figure 64: Asia Pacific Pressure Control Equipment Industry Volume (K Unit), by Application 2024 & 2032
- Figure 65: Asia Pacific Pressure Control Equipment Industry Revenue Share (%), by Application 2024 & 2032
- Figure 66: Asia Pacific Pressure Control Equipment Industry Volume Share (%), by Application 2024 & 2032
- Figure 67: Asia Pacific Pressure Control Equipment Industry Revenue (Million), by Type 2024 & 2032
- Figure 68: Asia Pacific Pressure Control Equipment Industry Volume (K Unit), by Type 2024 & 2032
- Figure 69: Asia Pacific Pressure Control Equipment Industry Revenue Share (%), by Type 2024 & 2032
- Figure 70: Asia Pacific Pressure Control Equipment Industry Volume Share (%), by Type 2024 & 2032
- Figure 71: Asia Pacific Pressure Control Equipment Industry Revenue (Million), by Country 2024 & 2032
- Figure 72: Asia Pacific Pressure Control Equipment Industry Volume (K Unit), by Country 2024 & 2032
- Figure 73: Asia Pacific Pressure Control Equipment Industry Revenue Share (%), by Country 2024 & 2032
- Figure 74: Asia Pacific Pressure Control Equipment Industry Volume Share (%), by Country 2024 & 2032
- Figure 75: Middle East Pressure Control Equipment Industry Revenue (Million), by Component 2024 & 2032
- Figure 76: Middle East Pressure Control Equipment Industry Volume (K Unit), by Component 2024 & 2032
- Figure 77: Middle East Pressure Control Equipment Industry Revenue Share (%), by Component 2024 & 2032
- Figure 78: Middle East Pressure Control Equipment Industry Volume Share (%), by Component 2024 & 2032
- Figure 79: Middle East Pressure Control Equipment Industry Revenue (Million), by Application 2024 & 2032
- Figure 80: Middle East Pressure Control Equipment Industry Volume (K Unit), by Application 2024 & 2032
- Figure 81: Middle East Pressure Control Equipment Industry Revenue Share (%), by Application 2024 & 2032
- Figure 82: Middle East Pressure Control Equipment Industry Volume Share (%), by Application 2024 & 2032
- Figure 83: Middle East Pressure Control Equipment Industry Revenue (Million), by Type 2024 & 2032
- Figure 84: Middle East Pressure Control Equipment Industry Volume (K Unit), by Type 2024 & 2032
- Figure 85: Middle East Pressure Control Equipment Industry Revenue Share (%), by Type 2024 & 2032
- Figure 86: Middle East Pressure Control Equipment Industry Volume Share (%), by Type 2024 & 2032
- Figure 87: Middle East Pressure Control Equipment Industry Revenue (Million), by Country 2024 & 2032
- Figure 88: Middle East Pressure Control Equipment Industry Volume (K Unit), by Country 2024 & 2032
- Figure 89: Middle East Pressure Control Equipment Industry Revenue Share (%), by Country 2024 & 2032
- Figure 90: Middle East Pressure Control Equipment Industry Volume Share (%), by Country 2024 & 2032
- Figure 91: Latin America Pressure Control Equipment Industry Revenue (Million), by Component 2024 & 2032
- Figure 92: Latin America Pressure Control Equipment Industry Volume (K Unit), by Component 2024 & 2032
- Figure 93: Latin America Pressure Control Equipment Industry Revenue Share (%), by Component 2024 & 2032
- Figure 94: Latin America Pressure Control Equipment Industry Volume Share (%), by Component 2024 & 2032
- Figure 95: Latin America Pressure Control Equipment Industry Revenue (Million), by Application 2024 & 2032
- Figure 96: Latin America Pressure Control Equipment Industry Volume (K Unit), by Application 2024 & 2032
- Figure 97: Latin America Pressure Control Equipment Industry Revenue Share (%), by Application 2024 & 2032
- Figure 98: Latin America Pressure Control Equipment Industry Volume Share (%), by Application 2024 & 2032
- Figure 99: Latin America Pressure Control Equipment Industry Revenue (Million), by Type 2024 & 2032
- Figure 100: Latin America Pressure Control Equipment Industry Volume (K Unit), by Type 2024 & 2032
- Figure 101: Latin America Pressure Control Equipment Industry Revenue Share (%), by Type 2024 & 2032
- Figure 102: Latin America Pressure Control Equipment Industry Volume Share (%), by Type 2024 & 2032
- Figure 103: Latin America Pressure Control Equipment Industry Revenue (Million), by Country 2024 & 2032
- Figure 104: Latin America Pressure Control Equipment Industry Volume (K Unit), by Country 2024 & 2032
- Figure 105: Latin America Pressure Control Equipment Industry Revenue Share (%), by Country 2024 & 2032
- Figure 106: Latin America Pressure Control Equipment Industry Volume Share (%), by Country 2024 & 2032
List of Tables
- Table 1: Global Pressure Control Equipment Industry Revenue Million Forecast, by Region 2019 & 2032
- Table 2: Global Pressure Control Equipment Industry Volume K Unit Forecast, by Region 2019 & 2032
- Table 3: Global Pressure Control Equipment Industry Revenue Million Forecast, by Component 2019 & 2032
- Table 4: Global Pressure Control Equipment Industry Volume K Unit Forecast, by Component 2019 & 2032
- Table 5: Global Pressure Control Equipment Industry Revenue Million Forecast, by Application 2019 & 2032
- Table 6: Global Pressure Control Equipment Industry Volume K Unit Forecast, by Application 2019 & 2032
- Table 7: Global Pressure Control Equipment Industry Revenue Million Forecast, by Type 2019 & 2032
- Table 8: Global Pressure Control Equipment Industry Volume K Unit Forecast, by Type 2019 & 2032
- Table 9: Global Pressure Control Equipment Industry Revenue Million Forecast, by Region 2019 & 2032
- Table 10: Global Pressure Control Equipment Industry Volume K Unit Forecast, by Region 2019 & 2032
- Table 11: Global Pressure Control Equipment Industry Revenue Million Forecast, by Country 2019 & 2032
- Table 12: Global Pressure Control Equipment Industry Volume K Unit Forecast, by Country 2019 & 2032
- Table 13: United States Pressure Control Equipment Industry Revenue (Million) Forecast, by Application 2019 & 2032
- Table 14: United States Pressure Control Equipment Industry Volume (K Unit) Forecast, by Application 2019 & 2032
- Table 15: Canada Pressure Control Equipment Industry Revenue (Million) Forecast, by Application 2019 & 2032
- Table 16: Canada Pressure Control Equipment Industry Volume (K Unit) Forecast, by Application 2019 & 2032
- Table 17: Mexico Pressure Control Equipment Industry Revenue (Million) Forecast, by Application 2019 & 2032
- Table 18: Mexico Pressure Control Equipment Industry Volume (K Unit) Forecast, by Application 2019 & 2032
- Table 19: Global Pressure Control Equipment Industry Revenue Million Forecast, by Country 2019 & 2032
- Table 20: Global Pressure Control Equipment Industry Volume K Unit Forecast, by Country 2019 & 2032
- Table 21: Germany Pressure Control Equipment Industry Revenue (Million) Forecast, by Application 2019 & 2032
- Table 22: Germany Pressure Control Equipment Industry Volume (K Unit) Forecast, by Application 2019 & 2032
- Table 23: United Kingdom Pressure Control Equipment Industry Revenue (Million) Forecast, by Application 2019 & 2032
- Table 24: United Kingdom Pressure Control Equipment Industry Volume (K Unit) Forecast, by Application 2019 & 2032
- Table 25: France Pressure Control Equipment Industry Revenue (Million) Forecast, by Application 2019 & 2032
- Table 26: France Pressure Control Equipment Industry Volume (K Unit) Forecast, by Application 2019 & 2032
- Table 27: Spain Pressure Control Equipment Industry Revenue (Million) Forecast, by Application 2019 & 2032
- Table 28: Spain Pressure Control Equipment Industry Volume (K Unit) Forecast, by Application 2019 & 2032
- Table 29: Italy Pressure Control Equipment Industry Revenue (Million) Forecast, by Application 2019 & 2032
- Table 30: Italy Pressure Control Equipment Industry Volume (K Unit) Forecast, by Application 2019 & 2032
- Table 31: Spain Pressure Control Equipment Industry Revenue (Million) Forecast, by Application 2019 & 2032
- Table 32: Spain Pressure Control Equipment Industry Volume (K Unit) Forecast, by Application 2019 & 2032
- Table 33: Belgium Pressure Control Equipment Industry Revenue (Million) Forecast, by Application 2019 & 2032
- Table 34: Belgium Pressure Control Equipment Industry Volume (K Unit) Forecast, by Application 2019 & 2032
- Table 35: Netherland Pressure Control Equipment Industry Revenue (Million) Forecast, by Application 2019 & 2032
- Table 36: Netherland Pressure Control Equipment Industry Volume (K Unit) Forecast, by Application 2019 & 2032
- Table 37: Nordics Pressure Control Equipment Industry Revenue (Million) Forecast, by Application 2019 & 2032
- Table 38: Nordics Pressure Control Equipment Industry Volume (K Unit) Forecast, by Application 2019 & 2032
- Table 39: Rest of Europe Pressure Control Equipment Industry Revenue (Million) Forecast, by Application 2019 & 2032
- Table 40: Rest of Europe Pressure Control Equipment Industry Volume (K Unit) Forecast, by Application 2019 & 2032
- Table 41: Global Pressure Control Equipment Industry Revenue Million Forecast, by Country 2019 & 2032
- Table 42: Global Pressure Control Equipment Industry Volume K Unit Forecast, by Country 2019 & 2032
- Table 43: China Pressure Control Equipment Industry Revenue (Million) Forecast, by Application 2019 & 2032
- Table 44: China Pressure Control Equipment Industry Volume (K Unit) Forecast, by Application 2019 & 2032
- Table 45: Japan Pressure Control Equipment Industry Revenue (Million) Forecast, by Application 2019 & 2032
- Table 46: Japan Pressure Control Equipment Industry Volume (K Unit) Forecast, by Application 2019 & 2032
- Table 47: India Pressure Control Equipment Industry Revenue (Million) Forecast, by Application 2019 & 2032
- Table 48: India Pressure Control Equipment Industry Volume (K Unit) Forecast, by Application 2019 & 2032
- Table 49: South Korea Pressure Control Equipment Industry Revenue (Million) Forecast, by Application 2019 & 2032
- Table 50: South Korea Pressure Control Equipment Industry Volume (K Unit) Forecast, by Application 2019 & 2032
- Table 51: Southeast Asia Pressure Control Equipment Industry Revenue (Million) Forecast, by Application 2019 & 2032
- Table 52: Southeast Asia Pressure Control Equipment Industry Volume (K Unit) Forecast, by Application 2019 & 2032
- Table 53: Australia Pressure Control Equipment Industry Revenue (Million) Forecast, by Application 2019 & 2032
- Table 54: Australia Pressure Control Equipment Industry Volume (K Unit) Forecast, by Application 2019 & 2032
- Table 55: Indonesia Pressure Control Equipment Industry Revenue (Million) Forecast, by Application 2019 & 2032
- Table 56: Indonesia Pressure Control Equipment Industry Volume (K Unit) Forecast, by Application 2019 & 2032
- Table 57: Phillipes Pressure Control Equipment Industry Revenue (Million) Forecast, by Application 2019 & 2032
- Table 58: Phillipes Pressure Control Equipment Industry Volume (K Unit) Forecast, by Application 2019 & 2032
- Table 59: Singapore Pressure Control Equipment Industry Revenue (Million) Forecast, by Application 2019 & 2032
- Table 60: Singapore Pressure Control Equipment Industry Volume (K Unit) Forecast, by Application 2019 & 2032
- Table 61: Thailandc Pressure Control Equipment Industry Revenue (Million) Forecast, by Application 2019 & 2032
- Table 62: Thailandc Pressure Control Equipment Industry Volume (K Unit) Forecast, by Application 2019 & 2032
- Table 63: Rest of Asia Pacific Pressure Control Equipment Industry Revenue (Million) Forecast, by Application 2019 & 2032
- Table 64: Rest of Asia Pacific Pressure Control Equipment Industry Volume (K Unit) Forecast, by Application 2019 & 2032
- Table 65: Global Pressure Control Equipment Industry Revenue Million Forecast, by Country 2019 & 2032
- Table 66: Global Pressure Control Equipment Industry Volume K Unit Forecast, by Country 2019 & 2032
- Table 67: Brazil Pressure Control Equipment Industry Revenue (Million) Forecast, by Application 2019 & 2032
- Table 68: Brazil Pressure Control Equipment Industry Volume (K Unit) Forecast, by Application 2019 & 2032
- Table 69: Argentina Pressure Control Equipment Industry Revenue (Million) Forecast, by Application 2019 & 2032
- Table 70: Argentina Pressure Control Equipment Industry Volume (K Unit) Forecast, by Application 2019 & 2032
- Table 71: Peru Pressure Control Equipment Industry Revenue (Million) Forecast, by Application 2019 & 2032
- Table 72: Peru Pressure Control Equipment Industry Volume (K Unit) Forecast, by Application 2019 & 2032
- Table 73: Chile Pressure Control Equipment Industry Revenue (Million) Forecast, by Application 2019 & 2032
- Table 74: Chile Pressure Control Equipment Industry Volume (K Unit) Forecast, by Application 2019 & 2032
- Table 75: Colombia Pressure Control Equipment Industry Revenue (Million) Forecast, by Application 2019 & 2032
- Table 76: Colombia Pressure Control Equipment Industry Volume (K Unit) Forecast, by Application 2019 & 2032
- Table 77: Ecuador Pressure Control Equipment Industry Revenue (Million) Forecast, by Application 2019 & 2032
- Table 78: Ecuador Pressure Control Equipment Industry Volume (K Unit) Forecast, by Application 2019 & 2032
- Table 79: Venezuela Pressure Control Equipment Industry Revenue (Million) Forecast, by Application 2019 & 2032
- Table 80: Venezuela Pressure Control Equipment Industry Volume (K Unit) Forecast, by Application 2019 & 2032
- Table 81: Rest of South America Pressure Control Equipment Industry Revenue (Million) Forecast, by Application 2019 & 2032
- Table 82: Rest of South America Pressure Control Equipment Industry Volume (K Unit) Forecast, by Application 2019 & 2032
- Table 83: Global Pressure Control Equipment Industry Revenue Million Forecast, by Country 2019 & 2032
- Table 84: Global Pressure Control Equipment Industry Volume K Unit Forecast, by Country 2019 & 2032
- Table 85: United States Pressure Control Equipment Industry Revenue (Million) Forecast, by Application 2019 & 2032
- Table 86: United States Pressure Control Equipment Industry Volume (K Unit) Forecast, by Application 2019 & 2032
- Table 87: Canada Pressure Control Equipment Industry Revenue (Million) Forecast, by Application 2019 & 2032
- Table 88: Canada Pressure Control Equipment Industry Volume (K Unit) Forecast, by Application 2019 & 2032
- Table 89: Mexico Pressure Control Equipment Industry Revenue (Million) Forecast, by Application 2019 & 2032
- Table 90: Mexico Pressure Control Equipment Industry Volume (K Unit) Forecast, by Application 2019 & 2032
- Table 91: Global Pressure Control Equipment Industry Revenue Million Forecast, by Country 2019 & 2032
- Table 92: Global Pressure Control Equipment Industry Volume K Unit Forecast, by Country 2019 & 2032
- Table 93: United Arab Emirates Pressure Control Equipment Industry Revenue (Million) Forecast, by Application 2019 & 2032
- Table 94: United Arab Emirates Pressure Control Equipment Industry Volume (K Unit) Forecast, by Application 2019 & 2032
- Table 95: Saudi Arabia Pressure Control Equipment Industry Revenue (Million) Forecast, by Application 2019 & 2032
- Table 96: Saudi Arabia Pressure Control Equipment Industry Volume (K Unit) Forecast, by Application 2019 & 2032
- Table 97: South Africa Pressure Control Equipment Industry Revenue (Million) Forecast, by Application 2019 & 2032
- Table 98: South Africa Pressure Control Equipment Industry Volume (K Unit) Forecast, by Application 2019 & 2032
- Table 99: Rest of Middle East and Africa Pressure Control Equipment Industry Revenue (Million) Forecast, by Application 2019 & 2032
- Table 100: Rest of Middle East and Africa Pressure Control Equipment Industry Volume (K Unit) Forecast, by Application 2019 & 2032
- Table 101: Global Pressure Control Equipment Industry Revenue Million Forecast, by Component 2019 & 2032
- Table 102: Global Pressure Control Equipment Industry Volume K Unit Forecast, by Component 2019 & 2032
- Table 103: Global Pressure Control Equipment Industry Revenue Million Forecast, by Application 2019 & 2032
- Table 104: Global Pressure Control Equipment Industry Volume K Unit Forecast, by Application 2019 & 2032
- Table 105: Global Pressure Control Equipment Industry Revenue Million Forecast, by Type 2019 & 2032
- Table 106: Global Pressure Control Equipment Industry Volume K Unit Forecast, by Type 2019 & 2032
- Table 107: Global Pressure Control Equipment Industry Revenue Million Forecast, by Country 2019 & 2032
- Table 108: Global Pressure Control Equipment Industry Volume K Unit Forecast, by Country 2019 & 2032
- Table 109: Global Pressure Control Equipment Industry Revenue Million Forecast, by Component 2019 & 2032
- Table 110: Global Pressure Control Equipment Industry Volume K Unit Forecast, by Component 2019 & 2032
- Table 111: Global Pressure Control Equipment Industry Revenue Million Forecast, by Application 2019 & 2032
- Table 112: Global Pressure Control Equipment Industry Volume K Unit Forecast, by Application 2019 & 2032
- Table 113: Global Pressure Control Equipment Industry Revenue Million Forecast, by Type 2019 & 2032
- Table 114: Global Pressure Control Equipment Industry Volume K Unit Forecast, by Type 2019 & 2032
- Table 115: Global Pressure Control Equipment Industry Revenue Million Forecast, by Country 2019 & 2032
- Table 116: Global Pressure Control Equipment Industry Volume K Unit Forecast, by Country 2019 & 2032
- Table 117: Global Pressure Control Equipment Industry Revenue Million Forecast, by Component 2019 & 2032
- Table 118: Global Pressure Control Equipment Industry Volume K Unit Forecast, by Component 2019 & 2032
- Table 119: Global Pressure Control Equipment Industry Revenue Million Forecast, by Application 2019 & 2032
- Table 120: Global Pressure Control Equipment Industry Volume K Unit Forecast, by Application 2019 & 2032
- Table 121: Global Pressure Control Equipment Industry Revenue Million Forecast, by Type 2019 & 2032
- Table 122: Global Pressure Control Equipment Industry Volume K Unit Forecast, by Type 2019 & 2032
- Table 123: Global Pressure Control Equipment Industry Revenue Million Forecast, by Country 2019 & 2032
- Table 124: Global Pressure Control Equipment Industry Volume K Unit Forecast, by Country 2019 & 2032
- Table 125: Global Pressure Control Equipment Industry Revenue Million Forecast, by Component 2019 & 2032
- Table 126: Global Pressure Control Equipment Industry Volume K Unit Forecast, by Component 2019 & 2032
- Table 127: Global Pressure Control Equipment Industry Revenue Million Forecast, by Application 2019 & 2032
- Table 128: Global Pressure Control Equipment Industry Volume K Unit Forecast, by Application 2019 & 2032
- Table 129: Global Pressure Control Equipment Industry Revenue Million Forecast, by Type 2019 & 2032
- Table 130: Global Pressure Control Equipment Industry Volume K Unit Forecast, by Type 2019 & 2032
- Table 131: Global Pressure Control Equipment Industry Revenue Million Forecast, by Country 2019 & 2032
- Table 132: Global Pressure Control Equipment Industry Volume K Unit Forecast, by Country 2019 & 2032
- Table 133: Global Pressure Control Equipment Industry Revenue Million Forecast, by Component 2019 & 2032
- Table 134: Global Pressure Control Equipment Industry Volume K Unit Forecast, by Component 2019 & 2032
- Table 135: Global Pressure Control Equipment Industry Revenue Million Forecast, by Application 2019 & 2032
- Table 136: Global Pressure Control Equipment Industry Volume K Unit Forecast, by Application 2019 & 2032
- Table 137: Global Pressure Control Equipment Industry Revenue Million Forecast, by Type 2019 & 2032
- Table 138: Global Pressure Control Equipment Industry Volume K Unit Forecast, by Type 2019 & 2032
- Table 139: Global Pressure Control Equipment Industry Revenue Million Forecast, by Country 2019 & 2032
- Table 140: Global Pressure Control Equipment Industry Volume K Unit Forecast, by Country 2019 & 2032
Frequently Asked Questions
1. What is the projected Compound Annual Growth Rate (CAGR) of the Pressure Control Equipment Industry?
The projected CAGR is approximately 6.10%.
2. Which companies are prominent players in the Pressure Control Equipment Industry?
Key companies in the market include GKD Industries Ltd, Baker Hughes (A GE Company), Hunting PLC, National Oilwell Varco Inc, Emerson Electric Co, Schlumberger Ltd, Lee Specialties Inc, Allied Valves Inc, Weatherford International PLC, FHE USA LLC, TIS Manufacturing Ltd, Kirloskar Brothers Ltd, IKM Pressure Control AS, Brace Tool Inc.
3. What are the main segments of the Pressure Control Equipment Industry?
The market segments include Component, Application, Type.
4. Can you provide details about the market size?
The market size is estimated to be USD XX Million as of 2022.
5. What are some drivers contributing to market growth?
Technological Advancement in Oilfield Equipment; Increase in Global Investments in Exploration & Production (E&P).
6. What are the notable trends driving market growth?
Valves Segment Expected to Hold Significant Share.
7. Are there any restraints impacting market growth?
Customized Demands by Drillers; Decline in Drilling Activities and Rig Counts.
8. Can you provide examples of recent developments in the market?
July 2022 - Emerson announced new valves for hydrogen fuelling stations to ensure maintenance safety and offer redundant protection from high pressure and superior sealing technology to avoid leaks. In high-pressure gas applications like hydrogen filling stations and tube trailers, the innovative technology reliably isolates process pressure, lowering fugitive emissions and raising safety.
9. What pricing options are available for accessing the report?
Pricing options include single-user, multi-user, and enterprise licenses priced at USD 4750, USD 5250, and USD 8750 respectively.
10. Is the market size provided in terms of value or volume?
The market size is provided in terms of value, measured in Million and volume, measured in K Unit.
11. Are there any specific market keywords associated with the report?
Yes, the market keyword associated with the report is "Pressure Control Equipment Industry," which aids in identifying and referencing the specific market segment covered.
12. How do I determine which pricing option suits my needs best?
The pricing options vary based on user requirements and access needs. Individual users may opt for single-user licenses, while businesses requiring broader access may choose multi-user or enterprise licenses for cost-effective access to the report.
13. Are there any additional resources or data provided in the Pressure Control Equipment Industry report?
While the report offers comprehensive insights, it's advisable to review the specific contents or supplementary materials provided to ascertain if additional resources or data are available.
14. How can I stay updated on further developments or reports in the Pressure Control Equipment Industry?
To stay informed about further developments, trends, and reports in the Pressure Control Equipment Industry, consider subscribing to industry newsletters, following relevant companies and organizations, or regularly checking reputable industry news sources and publications.
Methodology
Step 1 - Identification of Relevant Samples Size from Population Database


Step 2 - Approaches for Defining Global Market Size (Value, Volume* & Price*)

Note*: In applicable scenarios
Step 3 - Data Sources
Primary Research
- Web Analytics
- Survey Reports
- Research Institute
- Latest Research Reports
- Opinion Leaders
Secondary Research
- Annual Reports
- White Paper
- Latest Press Release
- Industry Association
- Paid Database
- Investor Presentations

Step 4 - Data Triangulation
Involves using different sources of information in order to increase the validity of a study
These sources are likely to be stakeholders in a program - participants, other researchers, program staff, other community members, and so on.
Then we put all data in single framework & apply various statistical tools to find out the dynamic on the market.
During the analysis stage, feedback from the stakeholder groups would be compared to determine areas of agreement as well as areas of divergence


